3922
Diagnosing first-episode depression with high-order regional homogeneity1Department of Radiology and BRIC, University of North Carolina at Chapel Hill, chapel hill, NC, United States, 2The First School of Clinical Medicine, Guangzhou University of Chinese Medicine, Guangzhou, China, 3Department of Radiology, The First Affiliated Hospital of Guangzhou University of Chinese Medicine, Guangzhou, China
Synopsis
The brain is a dynamic biosystem where the regions communicate with each other in a time-varying and adaptive way. Recently, abnormally varied brain statuses in brain diseases have been demonstrated with dynamic functional connectivity (FC) and a newly developed technique, high-order FC, which measures synchronization of the FC dynamics, providing a valuable way to characterize high-level brain function. However, there is a lack of method in quantification of local synchronization of the FC dynamics, another important facet of the high-level brain functional organization that could underpin complex regional brain activities. To this end, we propose a new method called high-order regional homogeneity (high-order ReHo) to evaluate such complex organizations of the local FC dynamics. We demonstrated that such a metric is more sensitive compared to the traditional low-order ReHo approach in individualized depression classification.
Introduction
Regional homogeneity (ReHo) of resting state fMRI (rs-fMRI) provides a simple while effective approach for investigating local functional connectivity (FC) or local brain activity1. It has been extensively used to investigate perturbed local brain activities or metabolism as potential biomarkers of brain diseases, including major depression disorder (MDD)2. However, this metric is not always sufficient for machine learning-based individualized diagnosis, possibly because subtle differences in ReHo calculated directly from low-order rs-fMRI signals (i.e., low-order ReHo) may not provide adequate separation between patients and healthy controls (HC). Recently, dynamic FC analysis of rs-fMRI has been demonstrated as a promising technique in understanding various neurological diseases3 and psychiatric disorders such as MDD4,5. Previously, we have proposed a new method called high-order FC that probes temporal synchronization of FC dynamics, an effective measurement of high-level, complex brain functional organization6. It is quite interesting and necessary to investigate if ReHo defined on dynamic FC time series instead of the raw rs-fMRI signals, which we coined “high-order ReHo”, could measure another facet of complex local brain functional organization and achieve improved MDD diagnostic accuracy compared to the traditional ReHo. We applied this new approach to extract high-level regional features and trained a linear support vector machine (SVM)-based diagnostic model using a large sample of the first-episode, drug-naïve MDD patients. Results show that our method led to significantly improved classification accuracy compared to the low-order ReHo.Methods
Totally, 58 first-episode, drug-naïve MDD patients and 58 HC were recruited
from the First Affiliated Hospital of Guangzhou University of Chinese Medicine,
China. Rs-fMRI scans were acquired by a 3.0T GE scanner with 185 volumes (TR/TE
= 2000/30 ms). Commonly accepted preprocessing pipeline was adopted6. Data scrubbing was conducted to
remove micro-head motion-derived artifacts for better estimation of dynamic FC6. A sliding window strategy was
adopted to segment the preprocessed rs-fMRI time6. Time-varying FC was calculated between a given
voxel and its 26 nearest neighbors in each sliding window. The high-order ReHo
was obtained by calculating a Kendall’s coefficient of concordance of the 26
dynamic FC time series across all sliding windows and then regarded as an
attribute of the centering voxel. For comparison, low-order ReHo was
also estimated in a similar way but using the raw rs-fMRI signals of all 27
voxels (including the centering voxel). Finally, both low- and high-order ReHo
maps were normalized (z-score transformation) and spatially smoothed with a 6-mm
full width at half maximum Gaussian kernel. To evaluate the sensitivity
in MDD detection with high-order ReHo, two linear SVM classifiers were
separately trained using our method and the low-order ReHo with 10-fold
cross-validations conducted for 100 times. The features of each subject were
the regionally averaged high- and low-order ReHo values from the 268 ROIs
defined by Shen et al.7. L1-norm regularized least
squares regression (LASSO)8 was used to reduce feature dimension. An
additional inner 10-fold cross-validation was used to tune the parameters of
LASSO. Finally, the classification
performance metrics were used to compare the two models9.Results and discussion
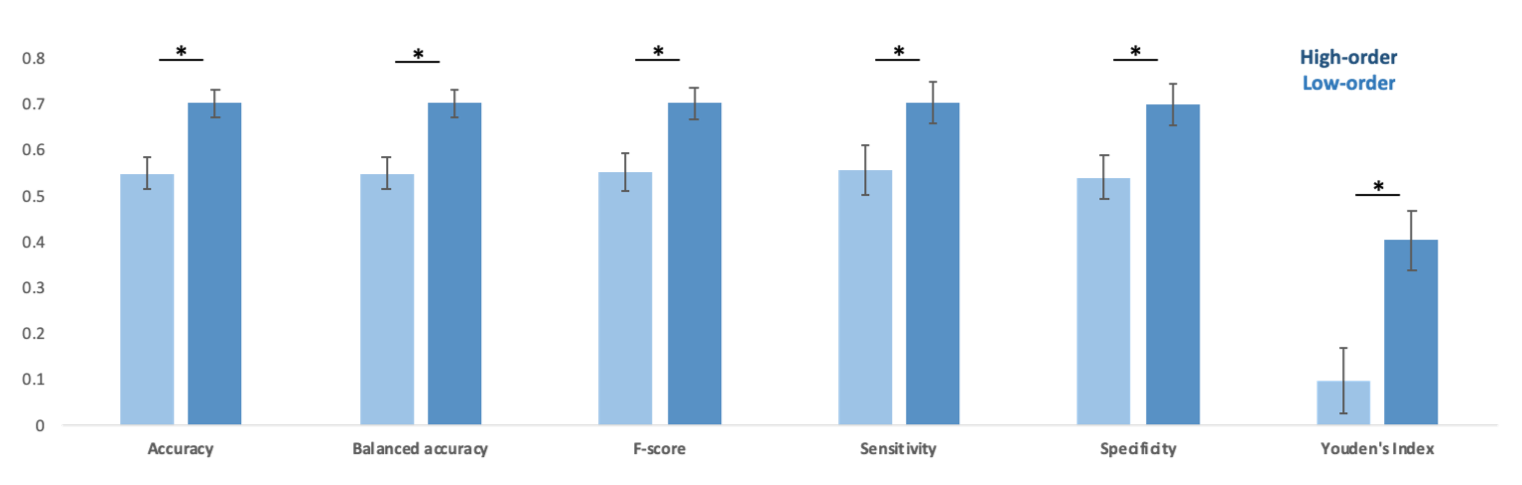
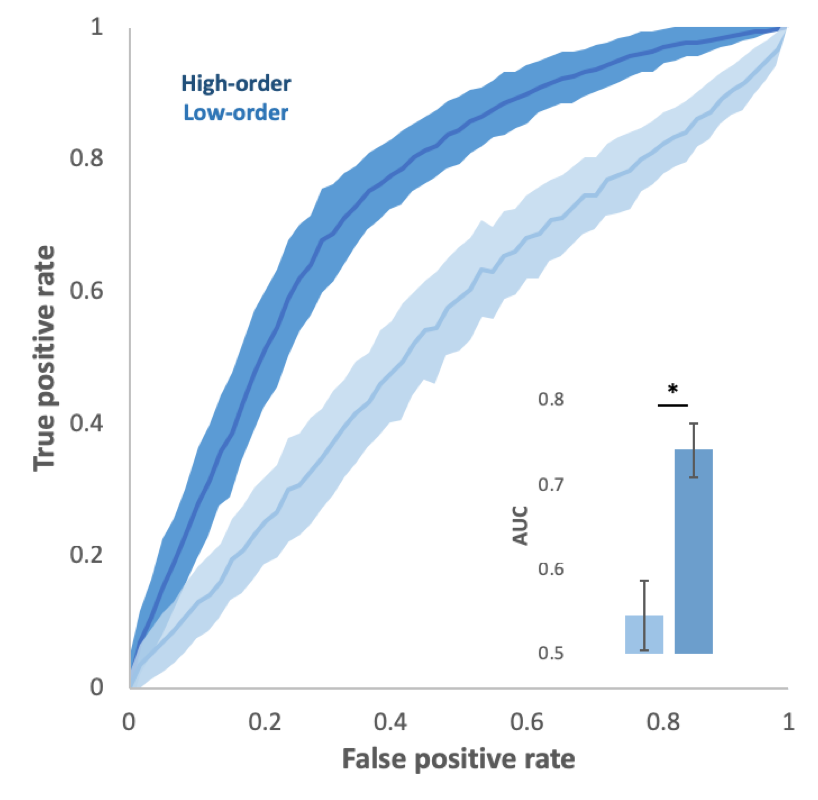
The classification performance by using low-order and high-order ReHo features is depicted in Fig. 1. High-order ReHo achieves significantly higher performance than low-order ReHo (accuracy = 0.70 vs. 0.55). In addition, the results of
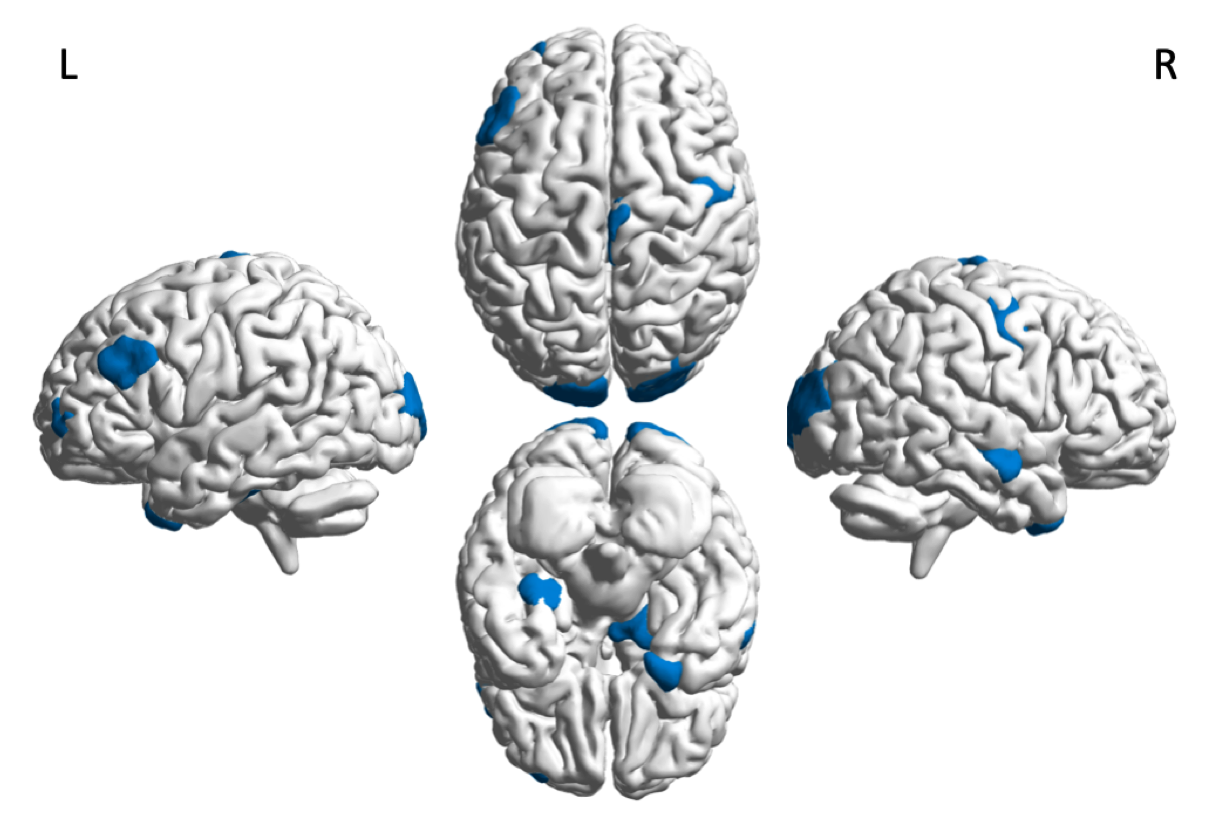
receiver operating characteristic (ROC) and area under ROC (AUC) also demonstrate superior performance of high-order ReHo in MDD classification (Fig. 2). The brain regions corresponding to the selected high-order ReHo features with the highest voting (above 95% ranking) across all the 10-fold cross-validations are presented in Fig. 3 to indicate potential imaging biomarkers with high diagnostic values. Most of the features are located at the default mode (middle temporal gyrus, parahippocampal gyrus, and inferior parietal lobule), frontoparietal (middle frontal gyrus), visual, and sensorimotor networks. Due to low accuracy, low-order ReHo features are not shown. Our results are largely consistent with the previous group comparison studies that the MDD-related abnormality of low-order ReHo in the default mode network and limbic system10. Despite the similar findings, high-order ReHo showed much improved sensitivity, making it suitable for individual diagnosis. Notably, the parahippocampus was especially suggested by our MDD diagnostic model as one of the four regions with the highest discriminability, further validated by a previous MDD classification study 11. This suggests that parahippocampus could be a target to the MDD pathology.Conclusion
We have developed a new informative, sensitive, and intuitive approach (high-order ReHo) that could characterize high-level, more complex brain regional activities based on the locally synchronized FC dynamics. This new rs-fMRI metric demonstrated significantly improved MDD classification performance compared to conventional ReHo. Our method provides an easy-to-use, intuitive, and sensitive tool for future clinical neuroscience studies targeting on biomarker detection, individualized diagnosis, and treatment design.Acknowledgements
This study was supported by National Natural Science Foundation of China (91649117, 81771344, and 81471251) and Science and Technology Plan Project of Guangzhou (2018-1002-SF-0442). Y. L. is supported by a scholarship from China Scholarship council (201708440259). The funders had no role in study design, data collection, and analysis, decision to publish, or preparation of the manuscript.References
1.Yufeng Zang, Tianzi Jiang, Yingli Lu, Yong He, Lixia Tiana. Regional homogeneity approach to fMRI data analysis. NeuroImage. 2004; 22: 394 – 400.
2. HuiHui Hao, Chuang Chen, WeiBing Mao, JianGuo Zhong, ZhenYu Dai. Aberrant brain regional homogeneity in first-episode drug-naïve patients with major depressive disorder: A voxel-wise meta-analysis. Journal of Affective Disorders. 2019; 245: 63–71.
3. Dongmei Zhi, Vince D. Calhoun, et al. Aberrant Dynamic Functional Network Connectivity and Graph Properties in Major Depressive Disorder. Frontiers in Psychiatry. July 2018; 9 (339).
4. Murat Demirtaş, Cristian Tornador, Carles Falcón, et al. Dynamic functional connectivity reveals altered variability in functional connectivity among patients with major depressive disorder. Human Brain Mapping. 2016; 37: 2918–2930.
5. Hutchison, R. Matthew, Thilo Womelsdorf, Elena A. Allen, Peter A. Bandettini, Vince D. Calhoun, Maurizio Corbetta, Stefania Della Penna et al. Dynamic functional connectivity: promise, issues, and interpretations. Neuroimage 80 (2013): 360-378.
6. Simultaneous Estimation of Low- and High-Order Functional Connectivity for Identifying Mild Cognitive Impairment. Yueying Zhou et al. Front Neuroinform. 2018;12:3.
7. X. Shen , F. Tokoglu, X. Papademetris , R.T. Constable. Groupwise whole-brain parcellation from resting-state fMRI data for network node identification. NeuroImage. 2013; 82: 403–415.
8. Tibshirani R. Regression shrinkage and selection via the lasso. Journal of the Royal Statistical Society. Series B (Methodological). 1996 Jan 1:267-88.
9. Marina Sokolova and Guy Lapalme. A systematic analysis of performance measures for classification tasks. Information Processing and Management. 2009; 45: 427–43.
10. Zhijian Yao, Li Wang, Qing Lu, et al. Regional homogeneity in depression and its relationship with separate depressive symptom clusters: A resting-state fMRI study. Journal of Affective Disorders. June 2009; 115(3): 430-438.
11. Ling-Li Zeng, Hui Shen, et al. Identifying major depression using whole-brain functional connectivity: a multivariate pattern analysis. Brain. 1 May 2012; 135 (5): 1498–1507.
Figures