3921
Abnormal brain network configuration associated with posttraumatic stress disorder: a novel combined approach using graph theory and scaled subprofile modeling1Department of Human Anatomy and Cell Science, University of Manitoba, Winnipeg, MB, Canada, 2Neuroscience Research Program, Kleysen Institute for Advanced Medicine, Winnipeg, MB, Canada, 3Department of Psychology, University of Manitoba, Winnipeg, MB, Canada, 4Department of Psychology, Ryerson University, Toronto, ON, Canada
Synopsis
Posttraumatic stress disorder (PTSD) is a prevalent psychiatric disorder with etiology and symptom expression that can vary greatly among patients. Currently, no objective clinical biomarker exists for assessing clinical severity and treatment response. In order to develop a reliable method of characterizing PTSD, we must understand how the brain changes in response to trauma. We propose a novel approach, combining graph theory analysis and scaled subprofile modeling (SSM) to identify degree centrality and its group-discriminating topographical patterns, respectively. This method has been successful in distinguishing fMRI scans of PTSD patients from trauma-exposed controls, and resulted in a reliable PTSD-related network configuration.
INTRODUCTION
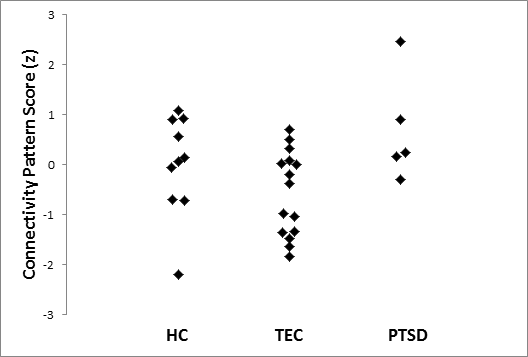
Posttraumatic stress disorder (PTSD) is a psychiatric disorder that results from exposure to highly traumatic events. It is characterized by intrusive memories, avoidance behaviours, negative alterations in cognition and mood, and altered arousal and reactivity1. These symptoms can cause significant distress, as well as impaired social and/or occupational function. The lifetime prevalence of PTSD in Canada is an estimated 9.2%, with a rate of current (1 month) PTSD of 2.4%2. As etiology and symptom expression of PTSD vary greatly, precise diagnoses and optimal treatment strategies are difficult to achieve. Currently, no well-established clinical biomarker exists, which makes it challenging to objectively assess response to treatment, or functional outcomes, such as ability to return to work. Clinicians rely on clinical interviews, which are time consuming and subjective in nature. In order to develop an objective, reliable method, we must understand the neural mechanisms behind PTSD. The brain is a highly adaptive system, and constantly reorganizes itself and attempts to compensate for abnormality. Recent imaging studies suggest evaluating network connectivity between brain regions is more relevant in understanding psychiatric disorders than isolated regional activity.3,4 Synchronous fluctuation of the functional magnetic resonance imaging (fMRI) signal indicates functional connectivity between regions, and allows us to understand activity within whole-brain networks5. However, past findings have been heterogeneous in characterizing PTSD network expression, often limited by their use of such widespread multiple comparisons.6-8 A more sensitive large-scale approach is therefore required to fully characterize how the brain changes with exposure to trauma. We propose a novel approach, combining graph theory analysis and scaled subprofile modeling (SSM). Graph theory is the study of network structures, and examines the shape of connections between nodes (i.e., brain regions). Its fundamental measure of functional connectivity is degree centrality (DC), defined as the sum of all edges (or connections) to a node. SSM is a form of principal component analysis that enables one to quantify how much an individual’s brain network resembles a pathological brain network configuration.9-11 If two distinct groups are pooled, SSM can characterize the disease-related brain activity covariance pattern that differentiates the two groups.11 SSM evaluates relationships between all features measured, and presents the combinations (or principal components) of these measures that reveal the most powerfully discerning features. The most significant components are selected and combined, creating a group-discriminating pattern. This covariance pattern is associated with subject scores (Figure 1), indicating how greatly each individual expresses this disease-related configuration. This method has demonstrated its utility in early differential diagnosis12,13 and in clinical trials,14,15 and exhibited high reproducibility.16-18METHODS
A training set of twenty-two participants underwent resting state fMRI (11 PTSD, and 11 trauma-exposed comparison group or TEC). Standard preprocessing was applied to the data using CONN (http://nitrc.org/projects/conn), and Automated Anatomical Labelling19 with 118 regions of interest. DC was calculated, and characteristic covariance patterns of those centralities that separate groups (PTSD vs. TEC) were identified. Stepwise linear regression was performed to select the relevant components.11 Due to small sample size, leave-one-out cross validation was performed to test replicability (Figure 2). We subsequently tested analytic performance in a testing set, comprised of PTSD (n=5), TEC (n=15) and non-trauma-exposed healthy controls (HC, n=10), scanned with a different MRI scanner.RESULTS
We identified a disease-related pattern of information flow in the context of brain network organization. Our results revealed a spatial pattern of degree centrality (Figure 3), which was significantly increased in PTSD versus TEC (Figure 1). The pattern proved to be replicable when used to discern PTSD vs. TEC in a testing set (Figure 4).DISCUSSION
The inclusion of many regions in this pattern that are not traditionally implicated in PTSD highlights the innovation of our approach, and importance of considering topology of the whole brain. The similar results of our analysis on data procured at a different site show promising generalizability for our approach in distinguishing PTSD from TEC. While it could not discern HC from TEC or PTSD, interestingly, HC profiles were qualitatively more similar to PTSD than TEC. In fact, when an outlier (outside 2 standard deviations) was removed, HC scores were significantly higher than TEC (t(22)=2.463, p=.022), while similar to PTSD (t(12)=-.964, p=.354). This hints at the possibility that our pattern could be associated with TEC compensatory mechanisms or resiliency.20CONLUSION
Our findings support a new paradigm for PTSD-related brain modeling. Our combined analytic approach integrating graph theory and SSM offers potential to identify more useful biomarkers than either in isolation. This paves the way for a better standard of care for patients and clinicians.Acknowledgements
The authors wish to thank the staff members of Ryerson University and University Health Network for data acquisition. This work was supported by Ontario Mental Health Foundation; New Initiatives Grant from the Faculty of Arts at Ryerson University; Canadian Institutes of Health Research; National Institute of Mental Health; Workers Compensation Board of Manitoba; Natural Science and Engineering Research Council of Canada; and University of Manitoba Start-up Fund.References
1. American Psychiatric Association, 2013. Diagnostic and statistical manual of mental disorders, 5th ed, Washington, DC.
2. Van Ameringen, M., Mancini, C., Patterson, B., Boyle, M.H., 2008. Post-traumatic stress disorder in Canada. CNS Neurosci Ther 14, 171-181.
3. Menon, V., 2011. Large-scale brain networks and psychopathology: a unifying triple network model. Trends in Cognitive Sciences 15, 483-506.
4. Patel, R., Spreng, R.N., Shin, L.M., Girard, T.A., 2012. Neurocircuitry models of posttraumatic stress disorder and beyond: a meta-analysis of functional neuroimaging studies. Neurosci Biobehav Rev 36, 2130-2142
5. Fox, M.D., Raichle, M.E., 2007. Spontaneous fluctuations in brain activity observed with functional magnetic resonance imaging. Nat Rev Neurosci 8, 700-711.
6. Kennis, M., van Rooij, S.J.H., van Den Heuvel, M.P., Kahn, R.S., Geuze, E., 2016. Functional network topology associated with posttraumatic stress disorder in veterans. NeuroImage: Clinical 10, 302-309.
7. Lei, D., Li, K., Li, L., Chen, F., Huang, X., Lui, S., Li, J., Bi, F., Gong, Q., 2015. Disrupted Functional Brain Connectome in Patients with Posttraumatic Stress Disorder. Radiology 276, 818-827.
8. Liu, F., Xie, B., Wang, Y., Guo, W., Fouche, J.-P., Long, Z., Wang, W., Chen, H., Li, M., Duan, X., Zhang, J., Qiu, M., Chen, H., 2015. Characterization of Post-traumatic Stress Disorder Using Resting-State fMRI with a Multi-level Parametric Classification Approach. A Journal of Cerebral Function and Dynamics 28, 221-237.
9. Eidelberg, D., 2009. Metabolic brain networks in neurodegenerative disorders: a functional imaging approach. Trends Neurosci 32, 548-557.
10. Eidelberg, D., Moeller, J.R., Dhawan, V., Spetsieris, P., Takikawa, S., Ishikawa, T., Chaly, T., Robeson, W., Margouleff, D., Przedborski, S., 1994. The metabolic topography of parkinsonism. J Cereb Blood Flow Metab 14, 783-801.
11. Spetsieris, P., Ma, Y., Peng, S., Ko, J.H., Dhawan, V., Tang, C.C., Eidelberg, D., 2013. Identification of Disease-related Spatial Covariance Patterns using Neuroimaging Data. J Vis Exp.
12. Holtbernd, F., Gagnon, J.F., Postuma, R.B., Ma, Y., Tang, C.C., Feigin, A., Dhawan, V., Vendette, M., Soucy, J.P., Eidelberg, D., Montplaisir, J., 2014. Abnormal metabolic network activity in REM sleep behavior disorder. NEUROLOGY.
13. Tang, C.C., Poston, K.L., Eckert, T., Feigin, A., Frucht, S., Gudesblatt, M., Dhawan, V., Lesser, M., Vonsattel, J.P., Fahn, S., Eidelberg, D., 2010. Differential diagnosis of parkinsonism: a metabolic imaging study using pattern analysis. Lancet Neurol 9, 149-158.
14. Feigin, A., Kaplitt, M.G., Tang, C., Lin, T., Mattis, P., Dhawan, V., During, M.J., Eidelberg, D., 2007. Modulation of metabolic brain networks after subthalamic gene therapy for Parkinson's disease. Proc Natl Acad Sci U S A 104, 19559-19564.
15. Ko, J.H., Feigin, A., Mattis, P.J., Tang, C.C., Ma, Y., Dhawan, V., During, M.J., Kaplitt, M.G., Eidelberg, D., 2014a. Network modulation following sham surgery in Parkinson's disease. J Clin Invest 124, 3656-3666.
16. Ko, J.H., Spetsieris, P., Ma, Y., Dhawan, V., Eidelberg, D., 2014b. Quantifying significance of topographical similarities of disease-related brain metabolic patterns. PLOS ONE 9, e88119.
17. Ma, Y., Tang, C., Spetsieris, P.G., Dhawan, V., Eidelberg, D., 2007. Abnormal metabolic network activity in Parkinson's disease: test-retest reproducibility. J Cereb Blood Flow Metab 27, 597-605.
18. Peng, S., Ma, Y., Spetsieris, P.G., Mattis, P., Feigin, A., Dhawan, V., Eidelberg, D., 2014. Characterization of disease-related covariance topographies with SSMPCA toolbox: Effects of spatial normalization and PET scanners. Hum Brain Mapp 35, 1801-1814.
19. Mazoyer, B., Joliot, M., 2002. Automated anatomical labeling of activations in SPM using a macroscopic anatomical parcellation of the MNI MRI single-subject brain. NeuroImg 15, 273-289.
20. Kennis, M., Rademaker, A.R., van Rooij, S.J., Kahn, R.S., Geuze, E., 2015a. Resting state functional connectivity of the anterior cingulate cortex in veterans with and without post-traumatic stress disorder. Hum Brain Mapp 36, 99-109.
Figures