3920
Assessment of Global and Regional Difference of Resting State Cerebral Vascular Reactivity index in Patient with Brain Tumor1Radiology, MSKCC, New York, NY, United States, 2medical physics, MSKCC, New York, NY, United States
Synopsis
The resting state fMRI (rfMRI) was used to estimate the BOLD signal change in response to natural breathing to measure the impairment of cerebra vascular reactivity (CVR) due to the presence of tumor. CVR associated values were obtained from the low frequency fluctuation of rfMRI and averaged over whole brain and tumor region of interests to measure the frequency related CVR properties respectively. These results indicate the existence of inter/intrasubject variability in low frequency and more sensitivity of the whole brain homogeneity to frequency rather than tumor. CVR mapping can determine the area of potential neuro-vascular uncoupling in the brain.
Purpose
Since the fluctuation of amplitudes of slow oscillation (<0.1Hz) in arterial blood CO2 level is occurring naturally due to change in respiration pattern, resting state fMRI (rfMRI) can be used to measure cerebra vascular reactivity (CVR) as a change in cerebral Blood flow in response to spontaneous breathing¹²³. Different parameters derived from spontaneous low frequency fluctuation (LFF) of rfMRI have been used to quantify CVR. The purpose of this study is to utilize rfMRI to estimate the BOLD signal change in response to natural breathing to measure the impairment of CVR due to the presence of tumor and to determine whether this tumor-induced CVR can be corrected using specific frequency band.Material and Methods
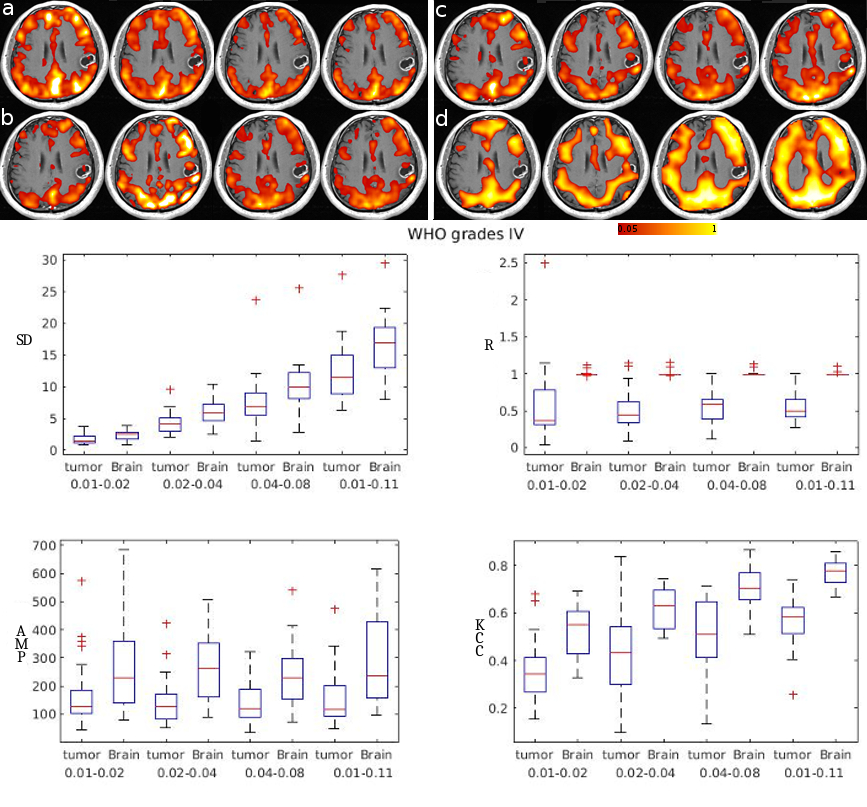
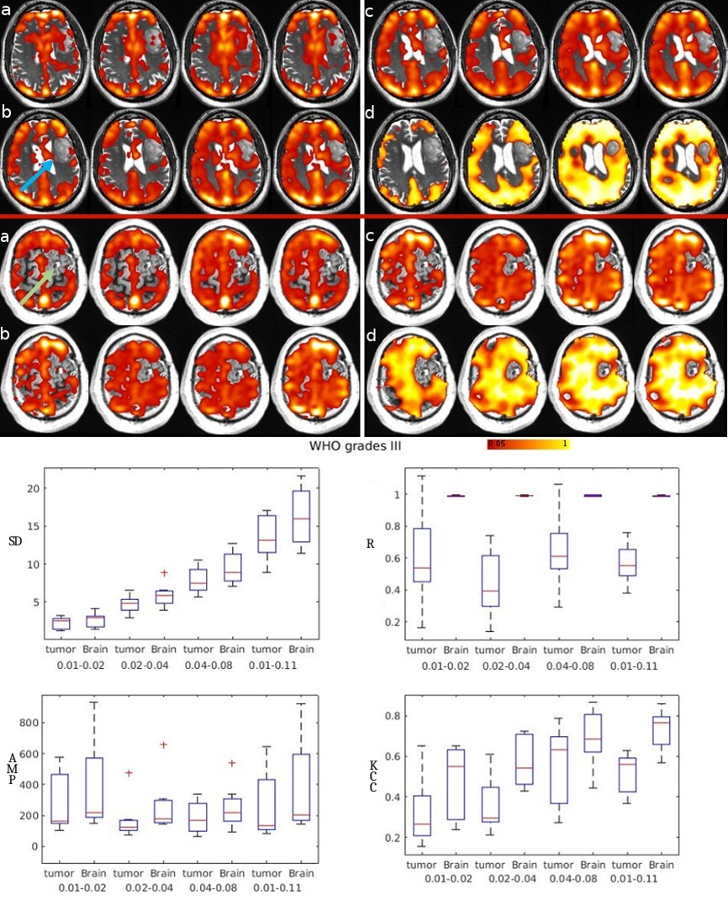
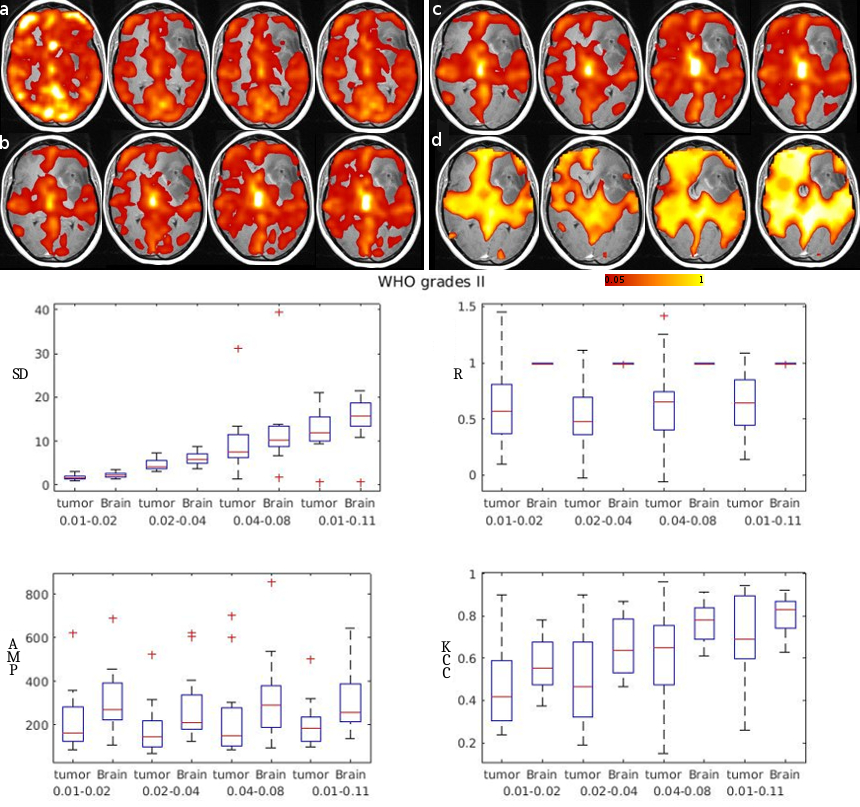
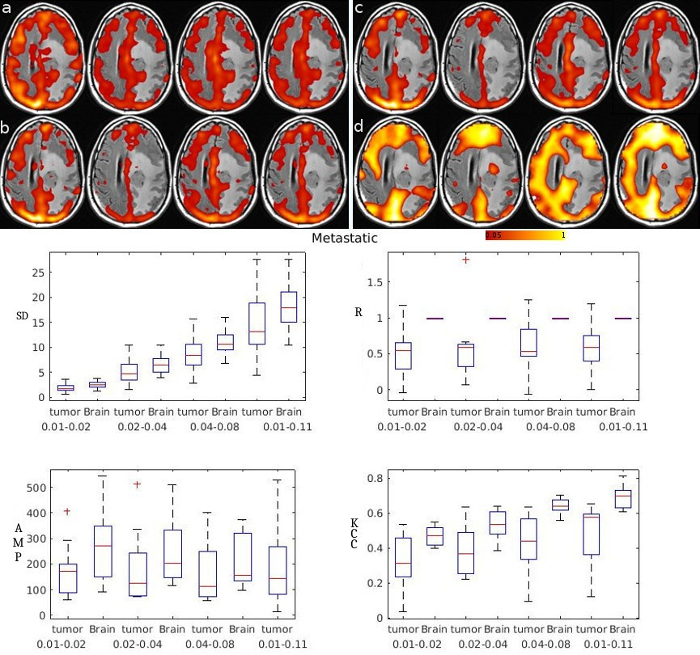
10 controls (49.25±8.15 years) and 60 patients (49.73 s±15.36 years) were included in this study. Patient were grouped according to pathology: glioma grade IV(GBM) (N=24), grade III (N=7), grade II and I (N=19) and metastases(MET) (N= 10). After preprocessing, the rfMRI signal was first, filtered into 3 different frequency band (0.01-0.02, 0.02-0.04, 0.04-0.08 along with a full band 0.01-0.1 Hz) and then the LFF time series was calculated in each frequency band. A linear regression model was carried out using LFF as a dependent variable and the mask of each voxel in the brain as an independent variable. The standard deviation of residual error (SD map), regression coefficient (R map), the amplitude-spectrum associated with frequency (AMP map), the amplitude of low-frequency fluctuation (ALFF)⁴ and the regional homogeneity based on the Kendall’s coefficient of concordance (KCC map)⁵ derived from LFF were estimated voxel wise and averaged over whole brain and tumor region of interests (ROIs) to measure the global and regional frequency related CVR properties respectively. All statistical test was set at minimum 0.99% significant.Results
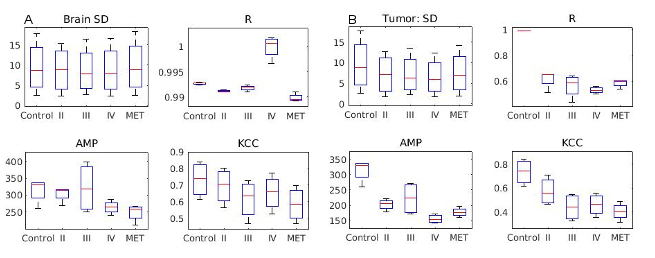
ALFF associated with full frequency band was highly correlated with SD (r>0.95) and R (r>0.6) maps in whole brain and tumor ROIs in all 3-frequency band. The average value of SD in control and patients, across both ROIs increases with frequency (p<). The difference in the value of SD map between tumor and whole brain ROIs was significant in each frequency band (p<) but the % change of SD value between tumor and whole brain ROI, slowly grow with frequency (MET and GBM: 9%, grade II & III: 31%). The value of R in control brain and patients across both ROIs are relatively constant (whole brain:0.99±0.008 and tumor: 0.57±0.063) independent of change in frequency. The value of R for GBM patients was higher globally (GBM: 1>control: 0.9927>grade III: 0.9918>grade II: 0.9911>MET:0.9898) and lower in tumor ROI (GBM: 0.5< MET: 0.54< grade III: 0.61<grade II: 0.65). The difference in the value of R map between tumor and whole brain ROIs was significant in each frequency band (p<, q<0.001). The value of AMP in control brain and across patients over both ROIs are decreased as frequency increased. But the difference is not significant (17%, p<0.1). The average value of AMP globally was lower in MET brain (MET:242<GBM: 264< grade II and III: 300 <control: 314) and regionally in GBM tumor (GBM: 155< MET: 177< grade II and III: 210). The difference in the value of AMP map between tumor and whole brain ROIs was significant in each frequency band (p<, q<0.001) except for MET (significant at 0.01-0.02 band, p< The value of KCC in control and patient across whole brain ROI is significantly increased as frequency increased (p<, q< ), but the change across tumor ROI was not significant (p<0.02 and q<0.6). In GBM only, the difference in the value of KCC map between tumor and whole brain ROIs was significant across all frequency band (p<, q<). For MET, the significance was shown only at 0.01-0.02 band (p< For grade II&III, the significant difference was observed in 0.02-0.04 band only (p< ,q< ) (figure 1-5).Discussions
These results indicate that the global homogeneity of brain is more sensitive to frequency than the reginal homogeneity of tumor. The positive dependency of SD map with frequency in terms of the intrasubject variability and the value of SD (figure 1-4), suggest that LFF in lower frequency is more reliable to estimate the NVU related false negative effects. The independency of R with frequency (figure 5), indicates that regression confitente of rfMRI is only depens on the characterization of tumor.Conclusion
CVR mapping can determine the area of potential NVU in the brain to provide more accurate information in pre-surgical planning. Furthermore, rfMRI is a feasible alternative to estimate CVR map.Acknowledgements
No acknowledgement found.References
1.Davis TL, Kwong KK, Weisskoff RM, Rosen BR. Calibrated functional MRI: mapping the dynamics of oxidative metabolism. Proc. Natl. Acad. Sci. U. S. A. 1998; 95 (4), 1834–1839.
2.Biswal BB, Van Kylen J, Hyde JS. Simultaneous assessment of flow and BOLD signals in resting-state functional connectivity maps. NMR Biomed. 1997; 10, 165–170.
3.Golestani AM, Kwinta JB, Strother SC, Khatamian YB, Chen JJ. The association between cerebrovascular reactivity and resting-state fMRI functional connectivity in healthy adults: The influence of basal carbon dioxide. Neuroimage. 2016; 15; 132:301-313. doi: 10.1016/j.neuroimage.2016.02.051. Epub 2016 Feb 23.
4.Zang YF, He Y, Zhu CZ, Cao QJ, Sui MQ, Liang M, et al. Altered baseline brain activity in children with ADHD revealed by resting-state functional MRI. Brain Dev. 2007; 29, 83–91. doi: 10.1016/j.braindev.2006.07.002
5.Zang Y, Jiang T, Lu Y, He Y, Tian L. Regional homogeneity approach to fMRI data analysis. Neuroimage. 2004; 22(1):394-400.
Figures