3917
Oxygen and Glucose metabolism in connector hubs estimated from resting-state fMRI1Physics, Concordia University, Montreal, QC, Canada, 2PERFORM Centre, Montreal, QC, Canada, 3Biomedical Engineering, McGill University, Montreal, QC, Canada, 4Radiology and Biomedical Imaging, Yale University School of Medicine, New Haven, CT, United States, 5Montreal Neurological Institute, McGill University, Montreal, QC, Canada, 6Montreal Heart Institute Research Institute, Montreal, QC, Canada
Synopsis
Connector hubs are highly functionally connected regions of the brain, allowing efficient distant communication between segregated modules. To study their metabolism we localized them from resting-state fMRI data using a Sparsity-based analysis method and estimated the number of functional networks associated with each voxel (K-hubness). We used quantitative MRI with gas manipulations to estimate baseline cerebral metabolic rate of O2 (CMRO2), cerebral blood flow, oxygen extraction fraction, and FDG-PET to estimate the resting cerebral metabolic rate of Glucose (CMRGlu). Our results showed a power-law model of the relationship between K-hubness and their CMRO2 and CMRGlu, confirming the metabolic efficiency of hubs.
INTRODUCTION
The brain is a complex system and has a high energetic cost to support neuronal activity, requiring glucose and oxygen supply from the cerebral vascular system. In brain networks, hubs are defined as highly connected regions of the brain. Among hubs, “connector hubs” participate in inter-network connectivity including long-range connections and perform a crucial role in network integrity and global communication [1]. Because of their high degree of connectivity to other regions of the brain, it has been suggested that connector hubs have higher glucose metabolism than non-hubs when the subject is at rest [2]. Hubs are also thought to be energy efficient when compared to non-hub regions [2], suggesting that the relationship between hubness (measured using degree centrality) and glucose metabolism (measured with PET) is non-linear and follows a power law. Our overall objective in this study is to characterize baseline metabolism of functional hubs to assess whether connector hubs would exhibit distinctive oxygen and glucose metabolic patterns as compared to other brain regions.METHODS
The functional connector hubs were identified using 10 minutes resting state functional MRI data from two healthy subjects (one 22 years old male and one 30 years old female) using a 3 T MR scanner (GE Healthcare MR750) with the following parameters: in plane resolution = 240mmx240mm, TR/TE=2300/30ms, slice thickness=3.5 mm. To estimate hub maps, we employed a method developed and validated by our group: Sparsity-based Analysis of Reliable k-hubness (SPARK). SPARK allows the estimation of the actual number of functional networks associated with each voxel (k-hubness, as well as the unique possibility to identify what are the actual networks associated to each hub [3]. In order to study the cerebral metabolic rate of oxygen (CMRO2) associated to the hubs, we used quantitative MRI with three type of gases: 50% O2 (hyperoxia), 5% CO2/21% O2/74%N2 (hypercapnia) and 5% CO2/50% O2/45%N2 (Combined hypercapnia/hyperoxia). The MRI sequence consisted in a dual-echo pseudo continuous arterial spin labeling (pCASL) acquisition combined with generalized Quantitative O2 imaging (GQUO2) MRI technique, following the model proposed in Gauthier et al [4]. Relevant imaging parameters were: In plane resolution = 240mmx240mm, TR/TE1/TE2=4150/8/30ms, labeling duration=900ms, TI=2250ms, slice thickness=7 mm. The application of GQUO2 model [5] resulted in estimating the resting oxygen extraction fraction (OEF) map from intersection point of maximum BOLD signal M curves during hypercapnia, hyperoxia, and hypercapnia/hyperoxia mixture, derived from simultaneous measurements of Cerebral blood flow (CBF), BOLD signal at rest and arterial content of oxygen (CaO2). Multiplying the resting OEF map, resting Cao2, and the resting CBF, the baseline CMRO2 map could finally be estimated. The MRI data that were preprocessed data using NIAK toolbox [5]. To measure the cerebral metabolic rate of glucose (CMRGlu) within the identified connector hub, a resting state positron emission tomography (PET) with 2-[18F] fluoro-2-deoxy-D-glucose ([18F] FDG) tracer was acquired using a PET/CT GE D690 camera. Standard PET correction, reconstruction and coregistration to anatomical MRI were considered. The PET images were reconstructed on a 192x192x47 grid with a voxel size of 1.6mm x 1.6mm x 3.25mm the cerebral CMRGlu map then obtained by averaging the cortical regions values normalized to reference region (Pons) activity.RESULTS
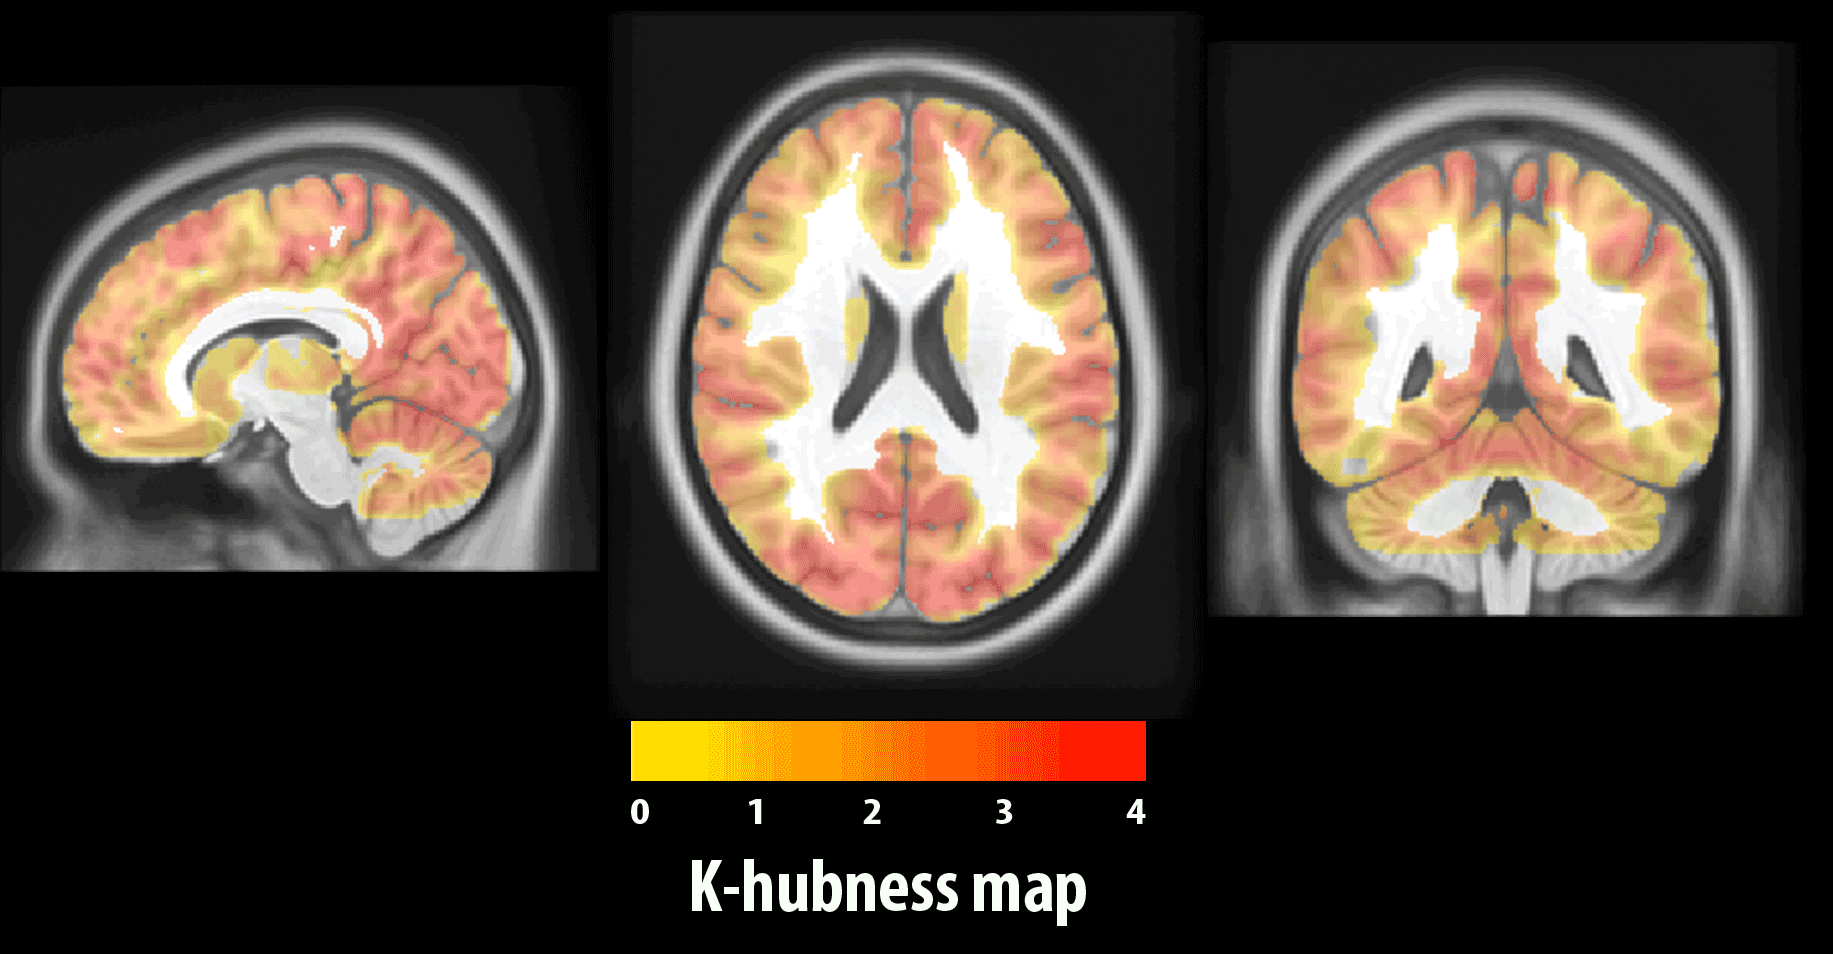
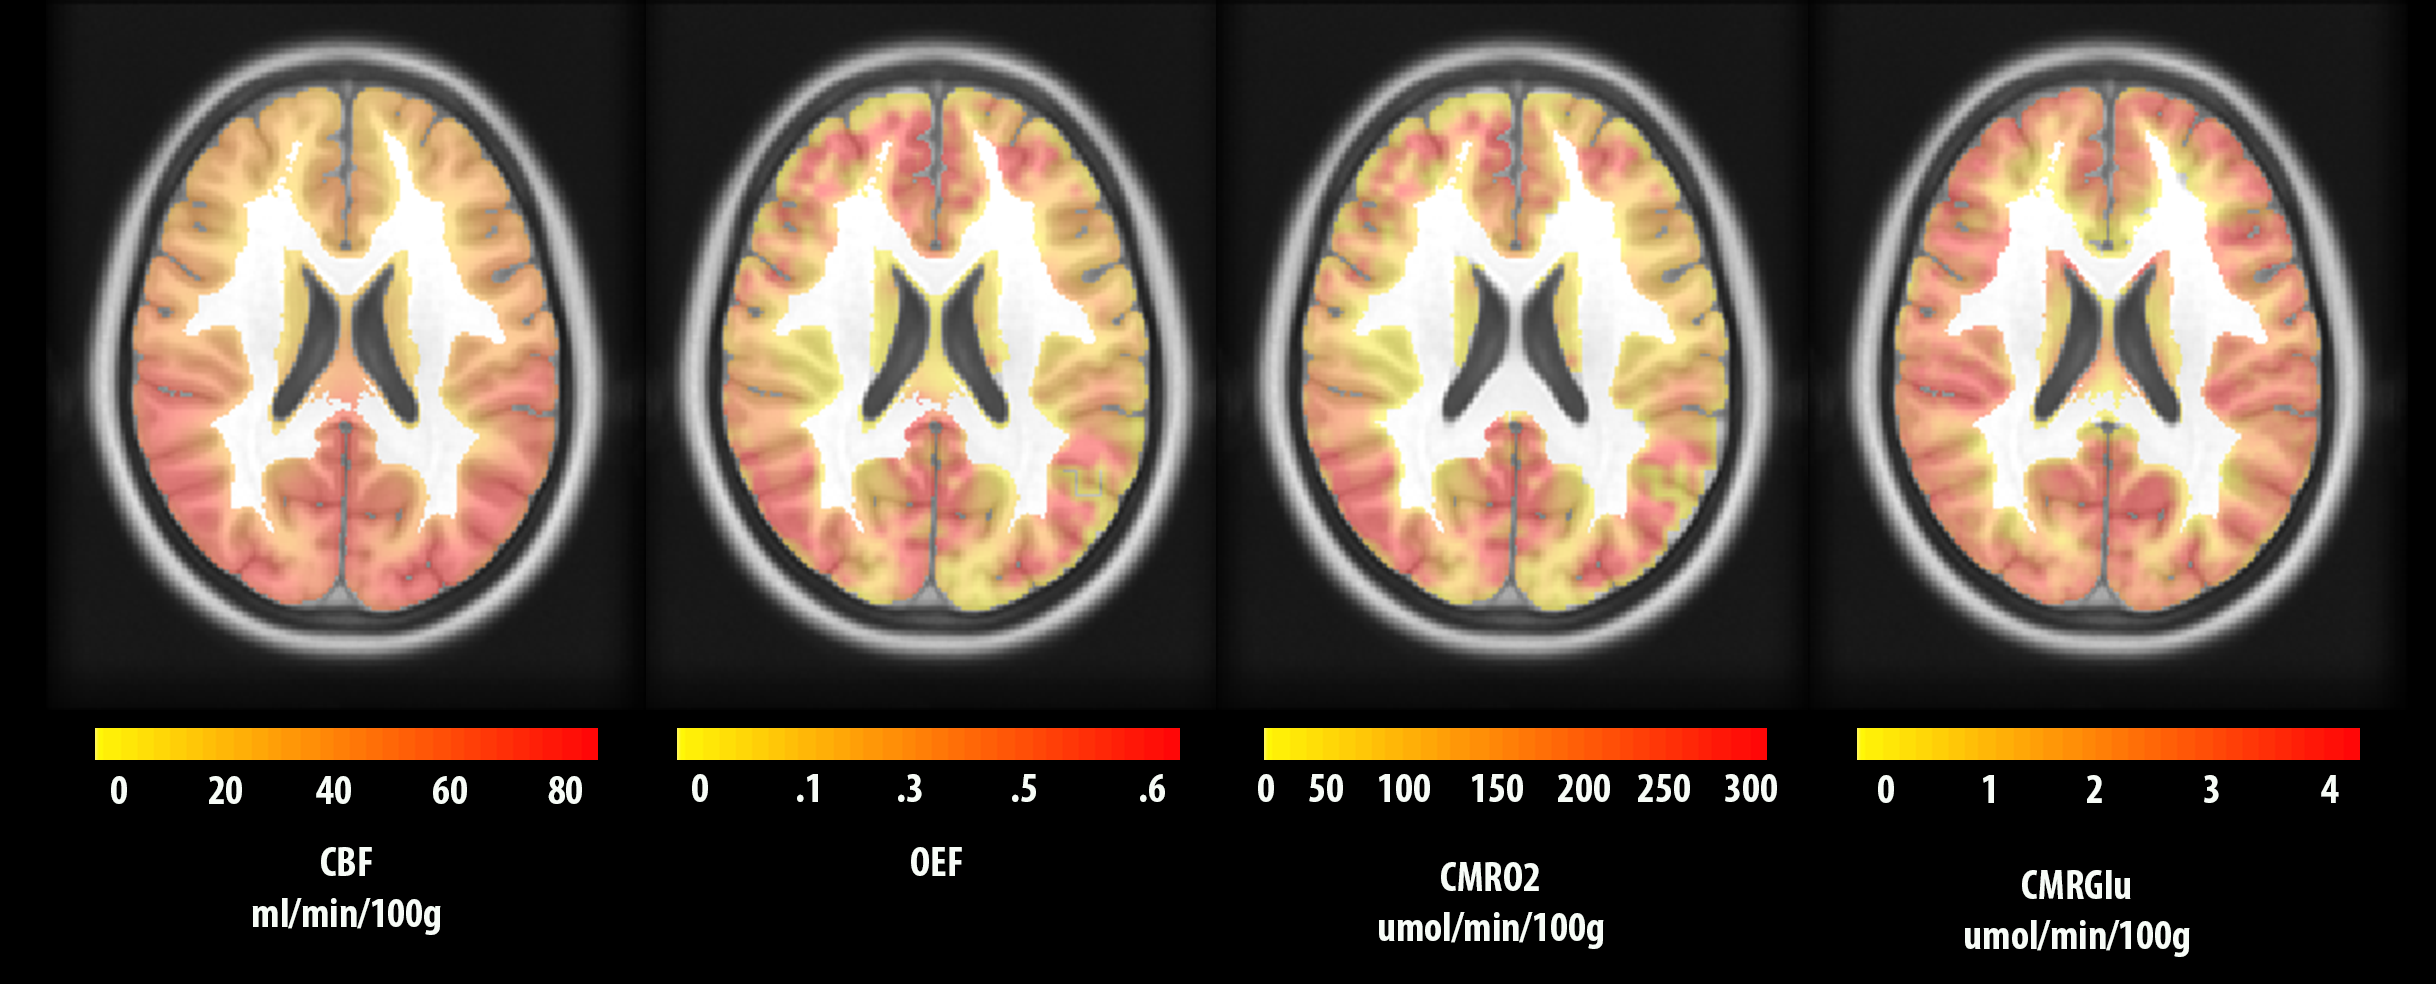
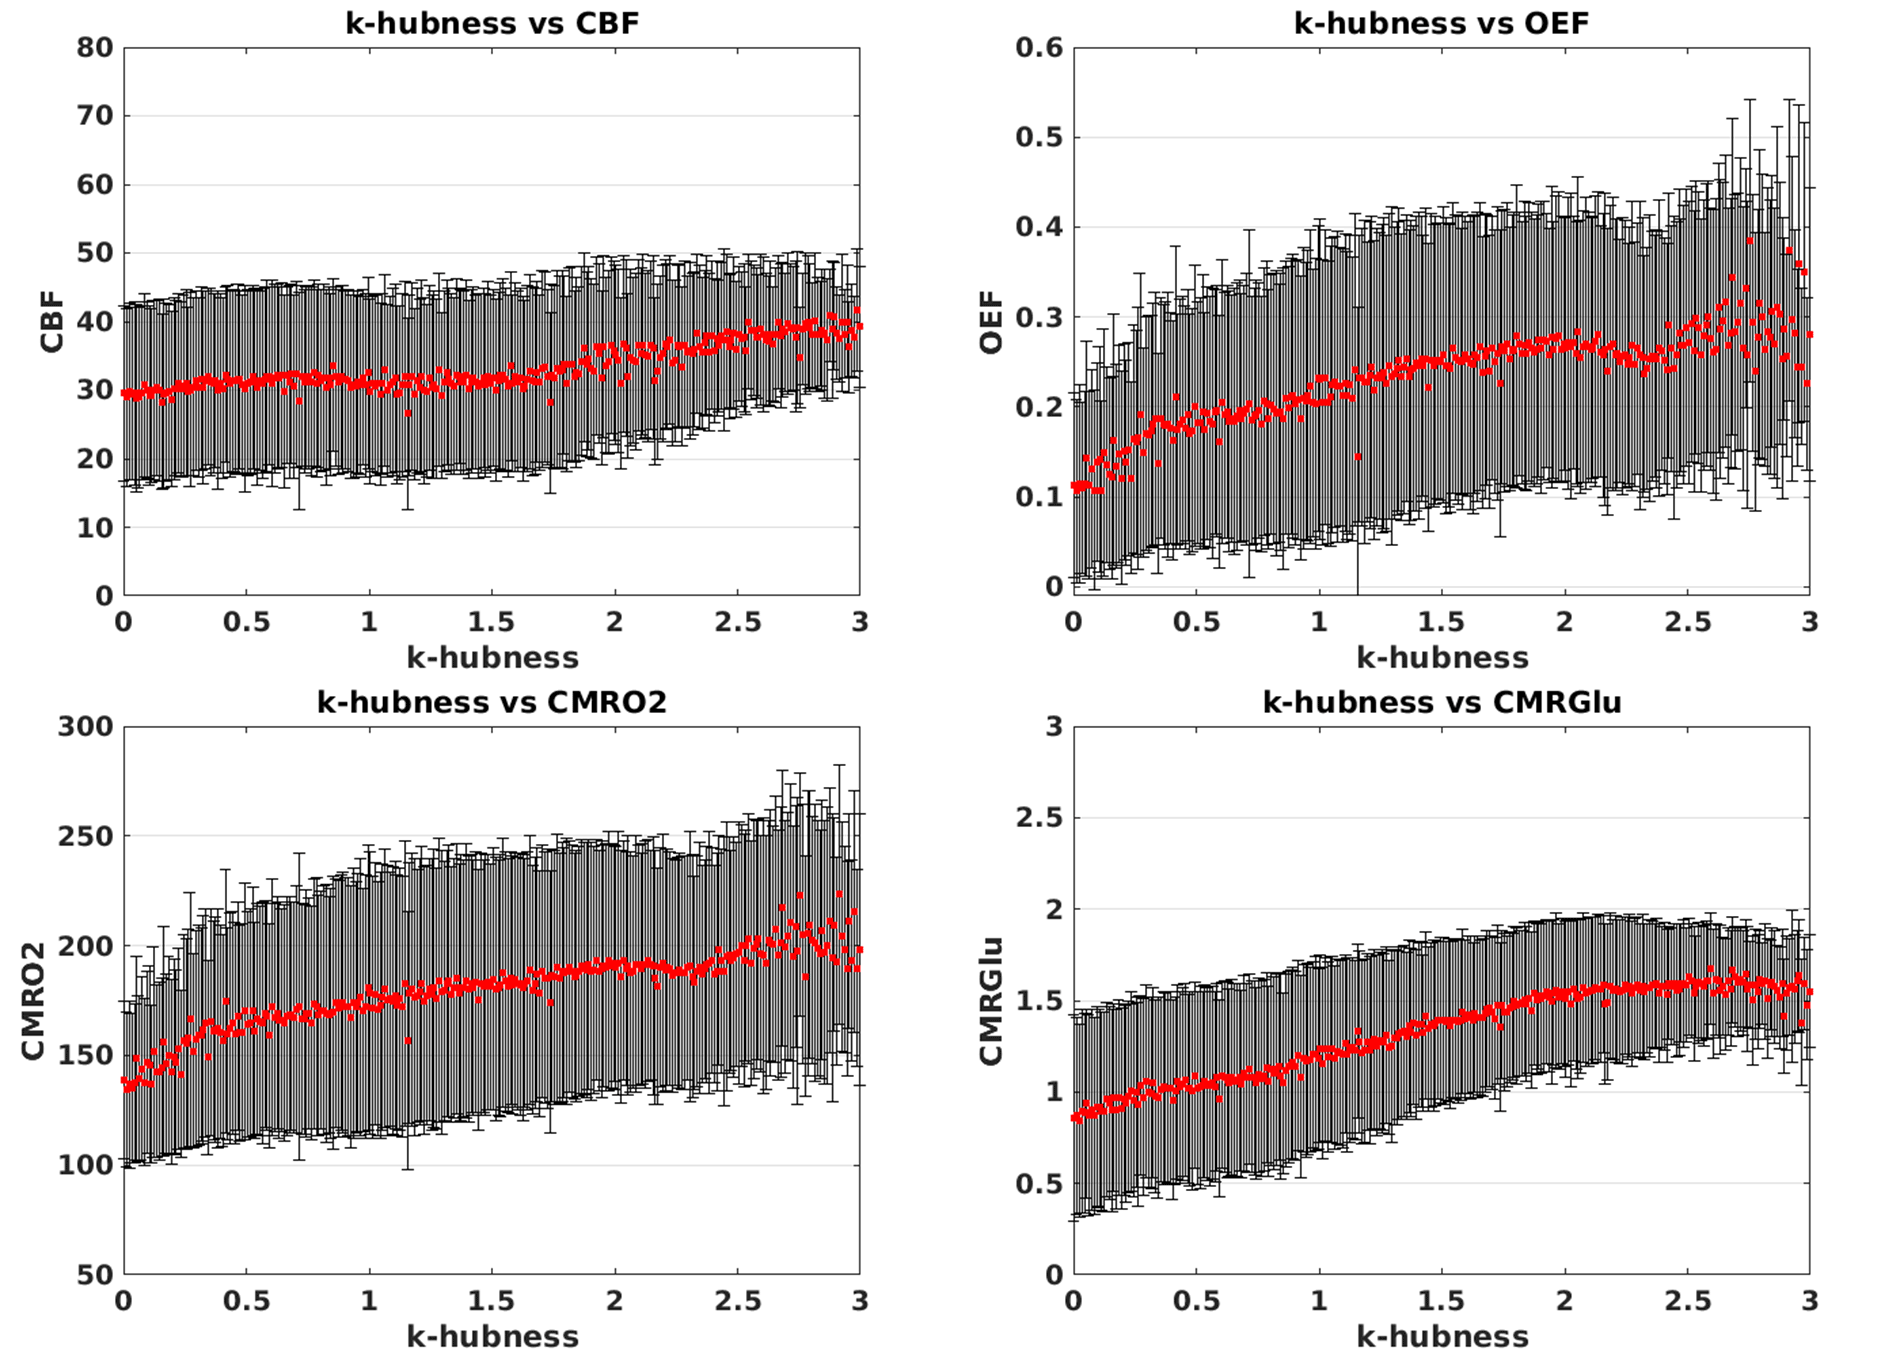
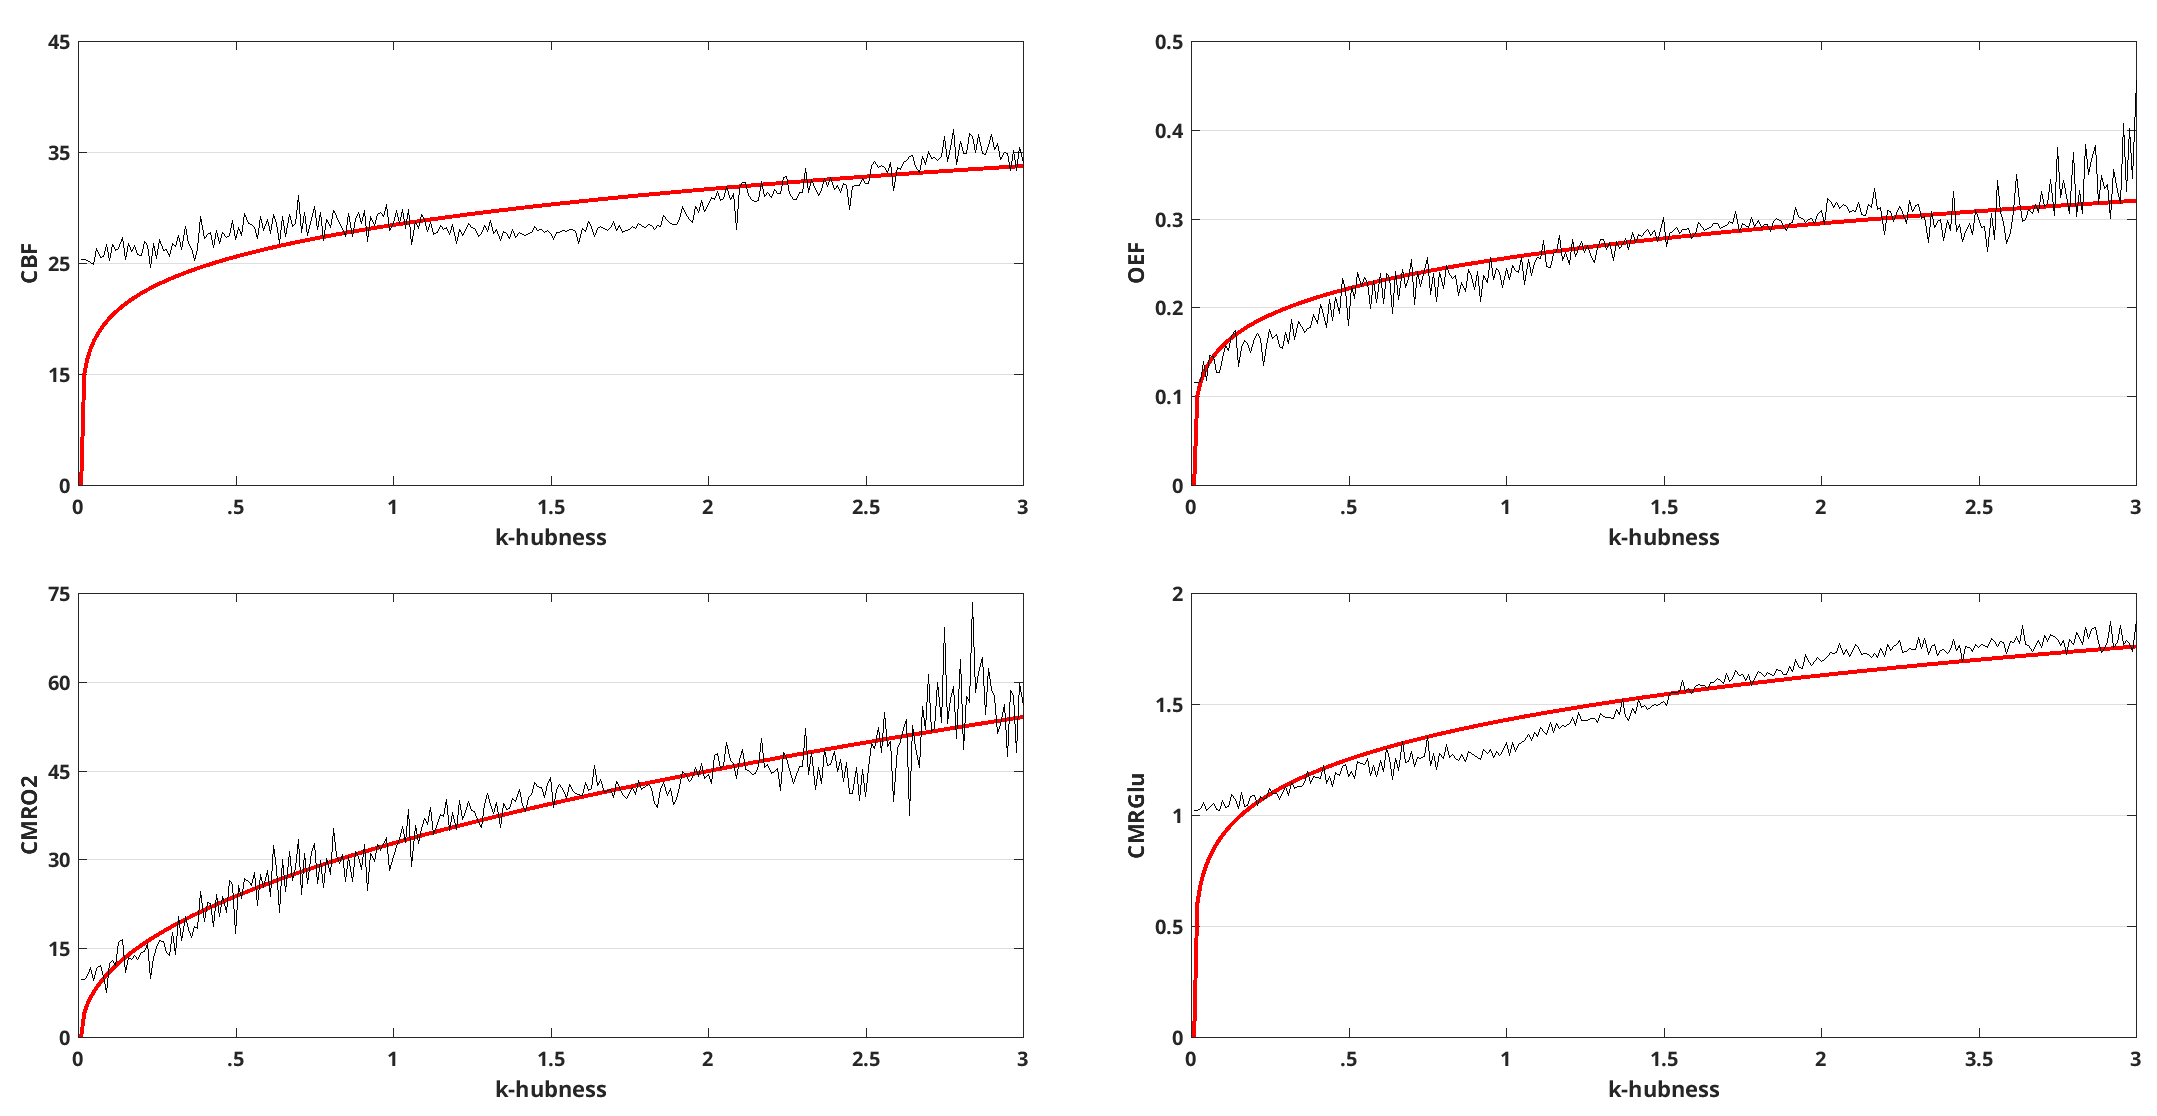
Here we present preliminary data showing the average from two subjects in grey matter. Figure 1 showed the k-hubness maps for the k<10. The range for baseline OEF was 0.1-0.6, CBF was 35-65, CMRO2 was 100-250, and CMRGlu was 0.8-1.8 (Figure 2). We studied power-law model fits between the k-hubness and: CBF, OEF, CMRO2, and CMRGlu (Figures 3) and we computed the R-squared values as an index of goodness-of-fit. The results showed the model parameters ($$$y=ax^b+c$$$) and R2 values for k-hubness and: CBF ($$$y=0.1x^1.3+28.7; R^2=0.71$$$), OEF ($$$y=0.1 x^5.8+0.0; R^2=0.91$$$), CMRO2 ($$$y=0.1 x^2.4+ 134.7; R^2=0.81$$$), and CMRGlu ($$$y=0.6x^5.3+0.6; R^2=0.93$$$) (Figures 4).DISCUSSION AND CONCLUSION
In agreement with previous findings on glucose metabolism within hubs [2], our results suggested a power-law model between k-hubness and: CMRGlu, CMRO2, and OEF, confirming resting state glucose and oxygen consumption efficiency for the hubs when compared to non-hubs regions. Meanwhile, the relationship between k-hubness and CBF was not fitted by a power-law model, indicating a difference in flow-metabolism coupling in hubs. One limitation of the current results is the lack of physiological confounds removal. Future implementations in larger sample sizes should seek to remove these confounds to improve data quality. In addition, by analyzing more data, we expect to observe a plateau effect for the relationship between the k-hubness and CMRO2 (as observed for CMRGlu) which would further confirm the oxygen metabolism of hubs.Acknowledgements
No acknowledgement found.References
[1] Sporns O, Honey CJ, Kötter R. Identification and classification of hubs in brain networks. PloS one. 2007 Oct 17;2(10):e1049. [2] Tomasi D, Wang GJ, Volkow ND. Energetic cost of brain functional connectivity. Proceedings of the National Academy of Sciences. 2013 Aug 13;110(33):13642-7. [3] Lee K, Lina JM, Gotman J, Grova C. SPARK: Sparsity-based analysis of reliable k-hubness and overlapping network structure in brain functional connectivity. NeuroImage. 2016 Jul 1;134:434-49. [4] Gauthier CJ, Hoge RD. Magnetic resonance imaging of resting OEF and CMRO2 using a generalized calibration model for hypercapnia and hyperoxia. Neuroimage. 2012 Apr 2;60(2):1212-25. [5] Bellec P, Benhajali Y, Carbonell F, Dansereau C, Albouy G, Pelland M, Craddock C, Collignon O, Doyon J, Stip E, Orban P. Multiscale statistical testing for connectome-wide association studies in fMRI. arXiv preprint arXiv:1409.2080. 2014 Sep 7.Figures