3913
Spectral Entropy: A Useful Engineered Feature for Classification of fMRI Data Quality?1Department of Research, Nova Scotia Health Authority, Halifax, NS, Canada, 2Biomedical Translational Imaging Centre, Halifax, NS, Canada, 3Brain Networks & Neurophysiology Lab, Halifax, NS, Canada, 4Nova Scotia Department of Health and Wellness, Halifax, NS, Canada, 5Acquired Brain Injury, Nova Scotia Health Authority, Halifax, NS, Canada, 6Department of Physics and Atmospheric Science, Dalhousie University, Halifax, NS, Canada, 7Department of Medical Neuroscience, Dalhousie University, Halifax, NS, Canada, 8School of Biomedical Engineering, Dalhousie University, Halifax, NS, Canada, 9Department of Diagnostic Radiology, Dalhousie University, Halifax, NS, Canada
Synopsis
This work evaluates the use of regularized spectral entropy (rSpecEn) as a potentially useful engineered feature for the classification of fMRI scan quality in real time. rSpecEn relies on the frequency sparsity of task-based fMRI signals, and a data-driven regularization method is employed to counteract unavoidable noise. Comparison to known measures of quality are used, as well as the use of fMRI scans with intentionally degraded quality. Sensitivity to fMRI data quality measures and an exploration of high accuracy scan quality classification are presented in this feasibility study.
Introduction
Quickly identifying high vs. low quality fMRI data is critical for clinical and research applications, but methods for this are lacking. Some measures of individual scan quality exist, e.g. similarity to a “standard” group map for a given fMRI paradigm, but these are not easily determined during the scan.
Entropy is a measure of information sparsity, and a potential real-time fMRI data quality metric. It has been used to study EEG signals1, characterize adult aging in fMRI scans2, and analyze event-related time series3. We propose a novel application using the fact that, in block-design fMRI, signals rich in task information in the time domain will be sparse in the frequency domain. Our objective was therefore to determine whether spectral entropy with data-driven regularization (rSpecEn) correlates to other measures of data quality, and whether it can be used to classify the quality of empirical data with specifically introduced quality variations.
Methods
After minimal preprocessing, rSpecEn was calculated on each brain voxel4. Spectral entropy quantifies frequency sparsity, and Tikhonov regularization was used to increase sparsity of power spectra favoring the task frequency (reducing noise effects). Overall regularization strength was chosen by optimizing sensitivity and specificity of low rSpecEn in detecting active voxels in simulated data sets with known truth5. In this synthetic data, noise frequencies were chosen to approximate those of real datasets and activation strength in a spherical region in the motor cortex was varied between 2-5%6.
To test the metric’s correlation with known quality variations, a language mapping paradigm7,8 was modified by replacing stimuli with a grey screen at random intervals (blocking out 10-17% of the task) to mimic attentional loss. The paradigm was also altered by randomly blocking out ends/beginnings of task blocks to imitate modified haemodynamic responses. In three scans, participants were instructed to move, introducing motion artifacts. An uninterrupted version was used to collect four “ideal” scans.
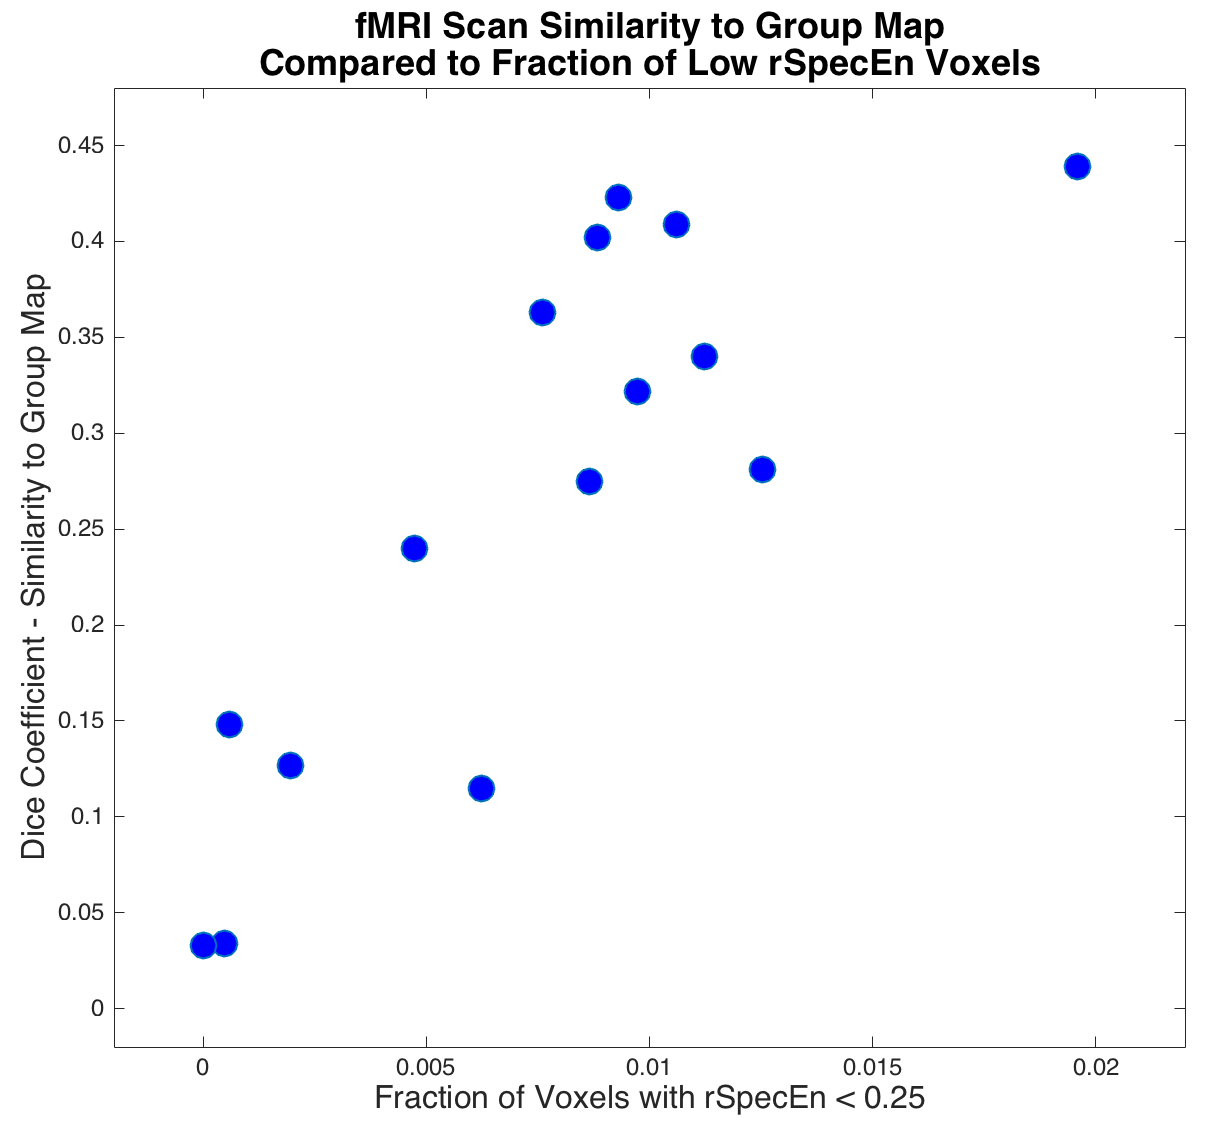
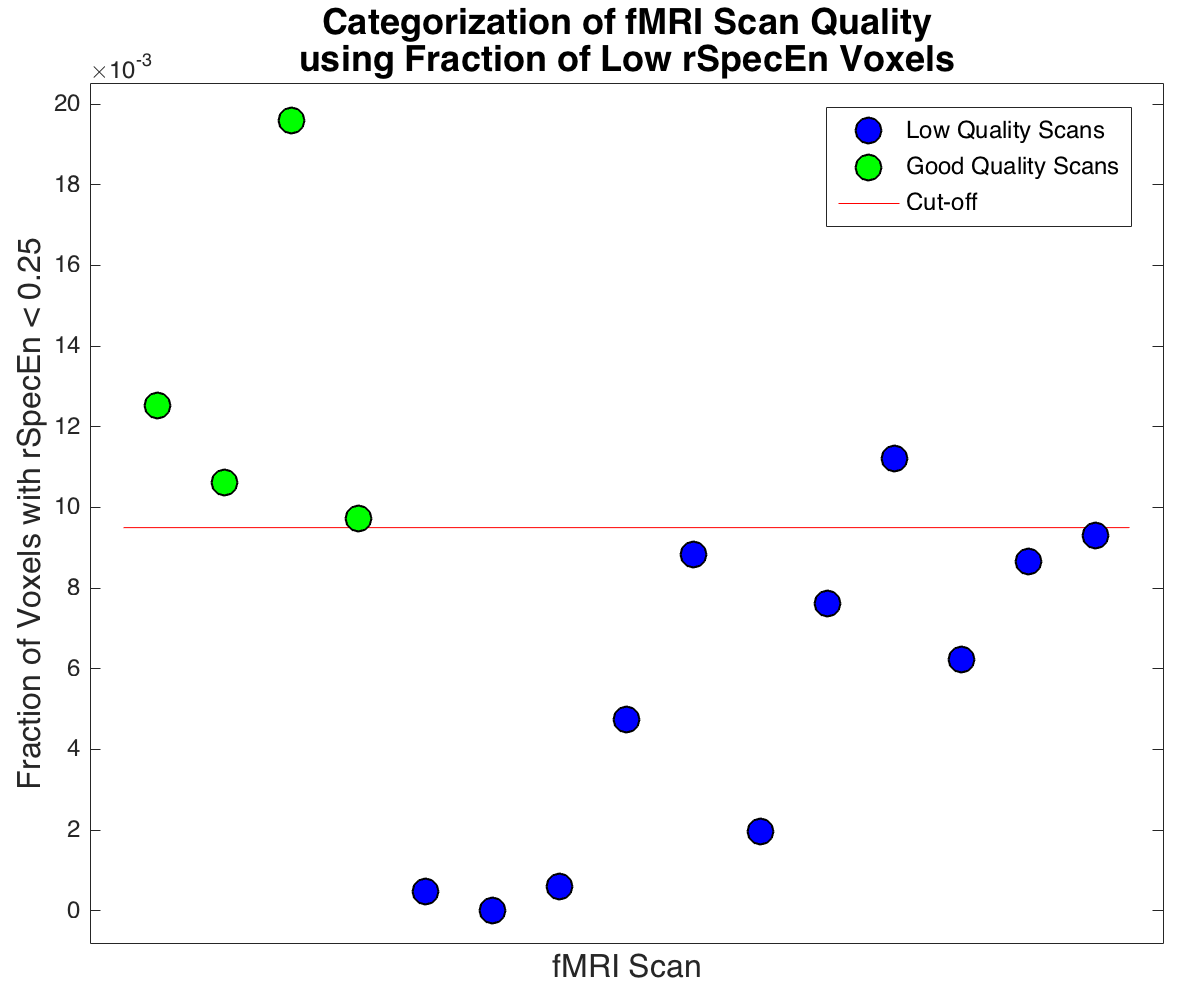
We hypothesized that greater fraction of voxels with dominant task frequency should correspond to greater data quality, whether from improved task activation or less noise/artifacts. A group map of the entire dataset (averaged t-statistic map of all subjects) was computed using the General Linear Model9 and the Dice coefficient was calculated comparing each scan to the group map. Higher values of Dice coefficient were taken to represent higher quality scans, and were compared to fraction of low rSpecEn voxels. Lastly, we tested whether an arbitrary cutoff for this fraction of low rSpecEn voxels could be used to categorize fMRI scans as “good” or “bad” quality.
Results
In datasets with varied quality, Dice coefficient comparing each scan’s map to the group map as a separate and continuous measure of quality correlated to percentage voxels with rSpecEn below a cut-off of 0.25 (r = 0.83, p < 0.001). Additionally, data could be classified into two quality groups (good and bad images) using a cutoff based on the percentage of low rSpecEn voxels in scans. If applied to a naïve classification model, this would result in an accuracy of 93% (14/15 scans).Discussion
This work is an initial exploration of an engineered feature to be used in real-time fMRI data quality classification. Assuming that group maps are “best case” scenarios of a paradigm, the Dice coefficient (measuring overlap of each scan with the group map) is used as a surrogate outcome measure approximating the utility of each scan. Correlation of an individual’s rSpecEn metric to the Dice coefficient demonstrates potential sensitivity to one data quality interpretation. Even with a simple rSpecEn cut-off, the metric demonstrated the ability to classify scan quality in this feasibility study. This represents a potential real-world application whereby scans may be quickly classified using rSpecEn as an engineered feature, likely using machine learning and large fMRI data collections.
Moving forward, data-driven approaches using large publicly available data sets will be used to determine a generalizable method for classifying fMRI quality using the fraction of low rSpecEn voxels. We are currently working on implementing a machine learning approach to build a binary classification model to accurately determine image quality. Preliminary results are promising and we expect further improvement.
Conclusion
rSpecEn uses a relatively simple metric that can be performed quickly - potentially in real-time. Correlation to measures such as Dice coefficient show sensitivity to scan quality, and arbitrary cutoffs demonstrate that rSpecEn can be a useful feature for scan classification. Future work will continue exploring classification with different machine learning modelling techniques, starting from shallow learning approaches (such as logistic regression and random forest), up to convolutional neural networks.Acknowledgements
The authors would like to thank David McAllindon and Chris Bowen for their input in this work. Additionally, we would like to acknowledge funding from NSERC Discovery grants, General Electric, the Atlantic Innovation Fund, and Brain Canada.References
1. Escudero, J., Abásolo, D., Hornero, R., Espino, P. and López, M., 2006. Analysis of electroencephalograms in Alzheimer's disease patients with multiscale entropy. Physiological measurement, 27(11), p.1091.
2. Sokunbi, M.O., 2014. Sample entropy reveals high discriminative power between young and elderly adults in short fMRI data sets. Frontiers in neuroinformatics, 8, p.69.
3. De Araujo, D.B., Tedeschi, W., Santos, A.C., Elias Jr, J., Neves, U.P.C. and Baffa, O., 2003. Shannon entropy applied to the analysis of event-related fMRI time series. NeuroImage, 20(1), pp.311-317
4. O’Grady, C., Omisade, A., Patterson, S., Rioux, J., Hashmi, J., Beyea, S. (2017, June). An Application of Spectral Entropy for Studying fMRI Interpretability.Poster session at the 2017 International Organization of Human Brain Mapping Annual Meeting in Vancouver, BC.
5. Welvaert, M., Durnez, J., Moerkerke, B., Verdoolaege, G. and Rosseel, Y., 2011. neuRosim: An R package for generating fMRI data. Journal of Statistical Software, 44(10), pp.1-18.
6. deCharms, Christopher R., Christoff, K., Glover, G.H., Pauly, J.M., Whitfield, S. and Gabrieli, J.D., 2004. Learned regulation of spatially localized brain activation using real-time fMRI. Neuroimage, 21(1), pp.436-443.
7. O’Grady, C., Omisade, A. and Sadler, R.M., 2016. Language lateralization of a bilingual person with epilepsy using a combination of fMRI and neuropsychological assessment findings. Neurocase, 22(5), pp.436-442.
8. Barnett, A., Marty-Dugas, J. and McAndrews, M.P., 2014. Advantages of sentence-level fMRI language tasks in presurgical language mapping for temporal lobe epilepsy. Epilepsy & Behavior, 32, pp.114-120. 9. Friston, K.J., Holmes, A.P., Worsley, K.J., Poline, J.P., Frith, C.D. and Frackowiak, R.S., 1994. Statistical parametric maps in functional imaging: a general linear approach. Human brain mapping, 2(4), pp.189-210.
Figures