3911
Combination of Primary and Temporal Derivative Estimates in Functional MRI1Human MR Center, University of Massachusetts Amherst, Amherst, MA, United States
Synopsis
In the general linear model analysis of a task fMRI, the response latency was analyzed by including a derivative parameter estimate of the hemodynamic response function. The existing method of combining the two estimates was improved to provide a more appropriate sign and amplitude of the combined estimate, which was presented in 2018 ISMRM. The last year’s method has been further improved to determine the sign of the combined estimate using a coordinate transformation method and to regulate the variance of the combined estimate by introducing an ellipse model. The new WSA method was experimentally confirmed using the HCP database.
Introduction
In the general linear model (GLM) analysis of a task fMRI, the response latency was analyzed by including a derivative parameter estimate of the hemodynamic response function (HRF). However, the derivative estimate has not been utilized to increase the parameter estimate although there has been a method to combine the primary and derivative parameter estimates1. We found problems in the existing method regarding the sign and variance of the combined estimate and we presented a new method of combining them with a proper sign and amplitude last year by use of a weighted square averaging (WSA) of the two estimates.2 In the WSA method there were two limitations: (i) an ad hoc adjustment of the relative weighting for the sign determination and (ii) a deviation of the combined variance from a theoretically derived equation. Therefore, we have developed a new solution that resolves the above mentioned two problems by transforming the parameter estimates into a positive realm and by regularizing the variance of the combined estimate within an expected range.Methods
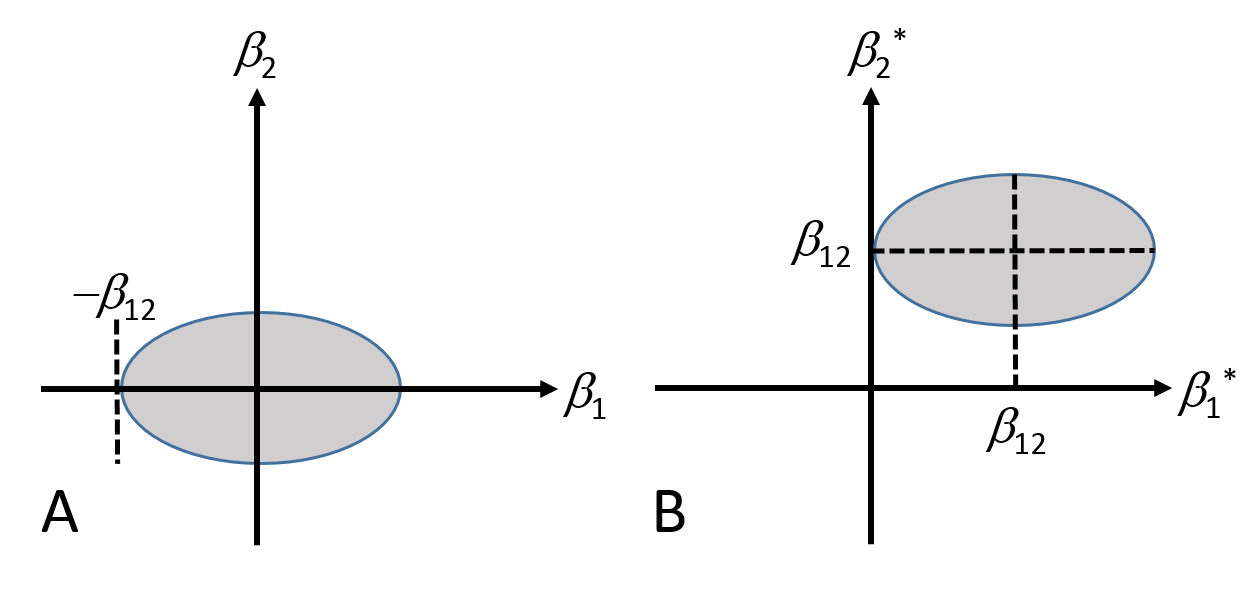
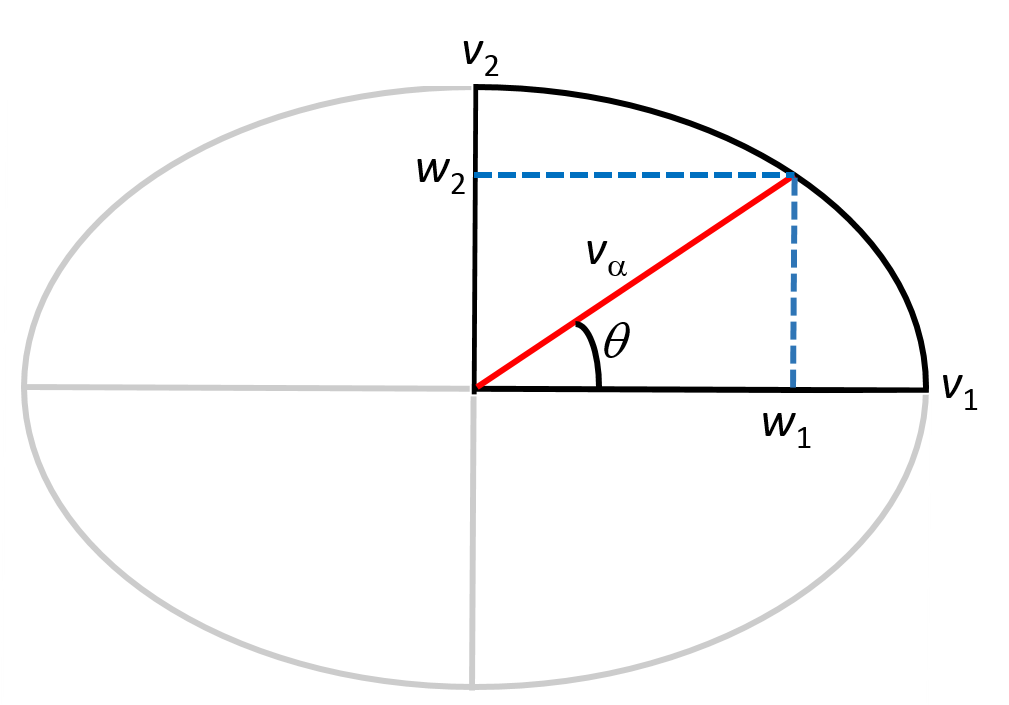
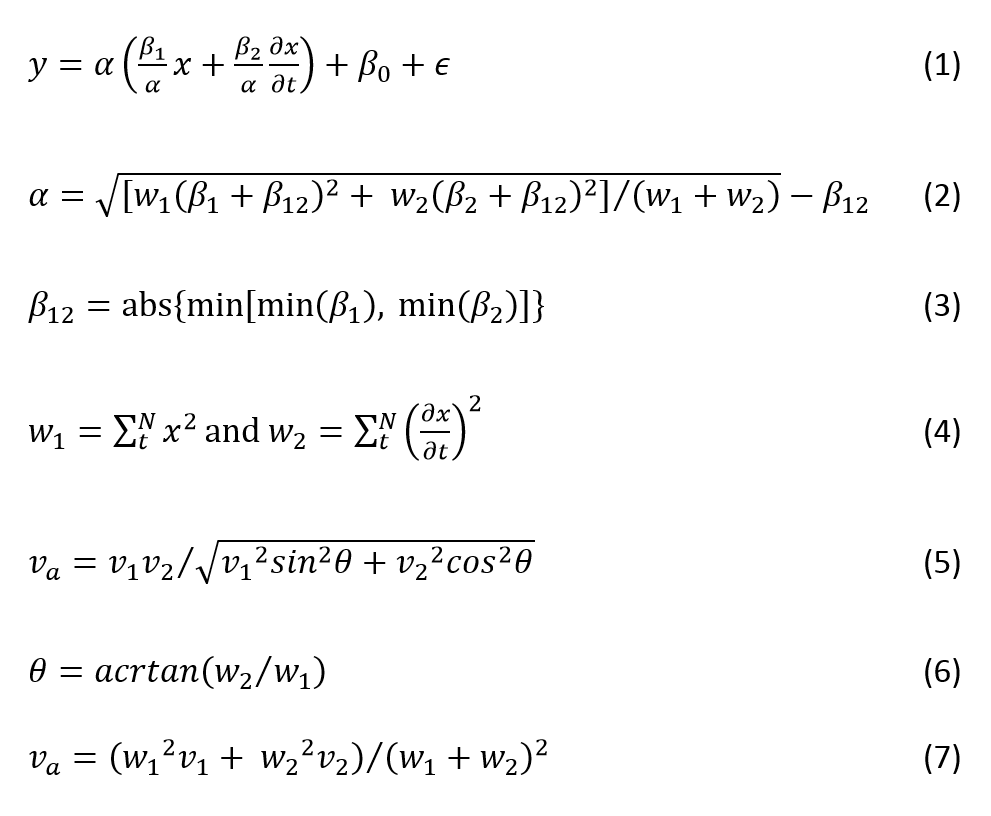
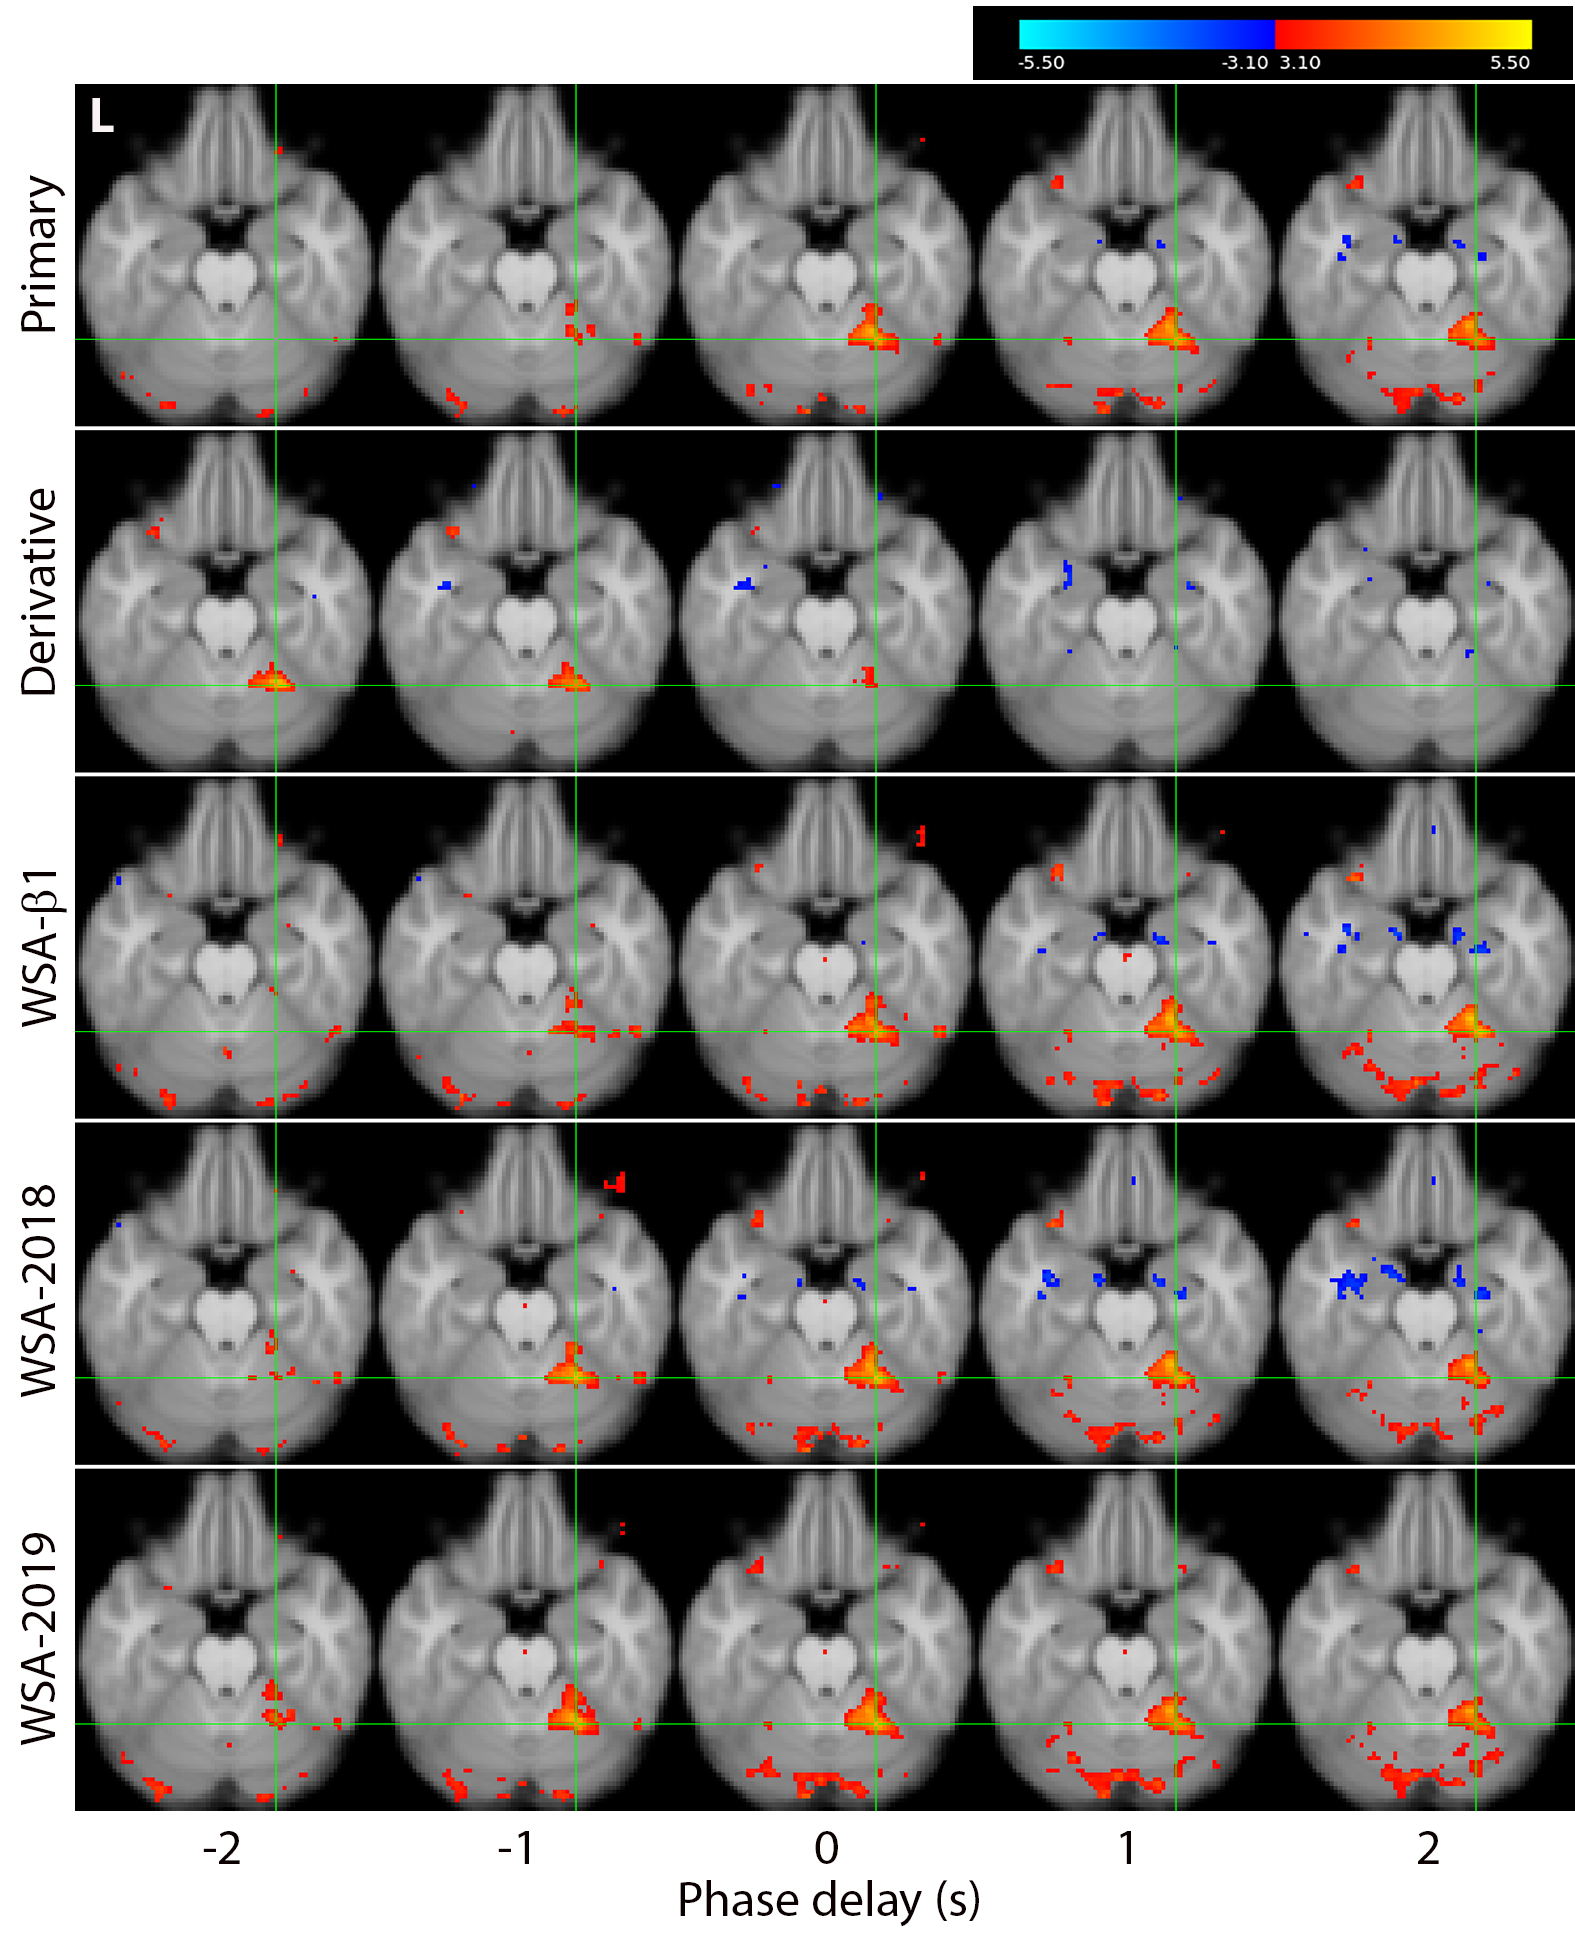
A coordinate system is considered using the parameter estimates of the primary and derivative component, β1 and β2, as graphically described in Fig. 1A. In this coordinate system β1 or β2 can be in the negative polarity, which leads to a polarity ambiguity of the combined estimate α using WSA. The coordinate system can be transformed by adding an offset so that the parameters in each coordinate is positive in its polarity as shown in Fig. 1B. The offset should be set from the minimum of the two estimates. In the transformed coordinate system, both parameters are positive in their polarity and hence the WSA can be performed without losing the polarity. The result of WSA obtained in the transformed coordinate system can be restored for its polarity by an inverse transformation. The variance of the combined estimate α is determined from the variances of the primary and derivative components using the design matrices. The variance of α is set to be confined within the ellipse that is constructed from the variances of the primary and derivative components as shown in Fig. 2. Within the ellipse, the variance of α is a radius of the ellipse with an angle to the primary variance axis and the angle is determined by the design matrices. The combined estimates and variances are described mathematically in Fig. 3. The new methods were tested using the language task fMRI data in the Human Connectome Project (HCP) database. The language task involved button responses of the right hand that can be considered as an event-related design.3 Eleven subjects were selected and there were two repeated runs in each subject. The GLM analysis was performed on the preprocessed data with the FSL’s FEAT tool. The new method was compared with Calhoun’s method for the sign of the combined estimate after the same WSA procedure as the new WSA method. The previous WSA method was applied with the ad hoc parameter λ = 0.1 and the variance of the combined estimate was obtained as in Eq. (7) of Fig. 3.Results
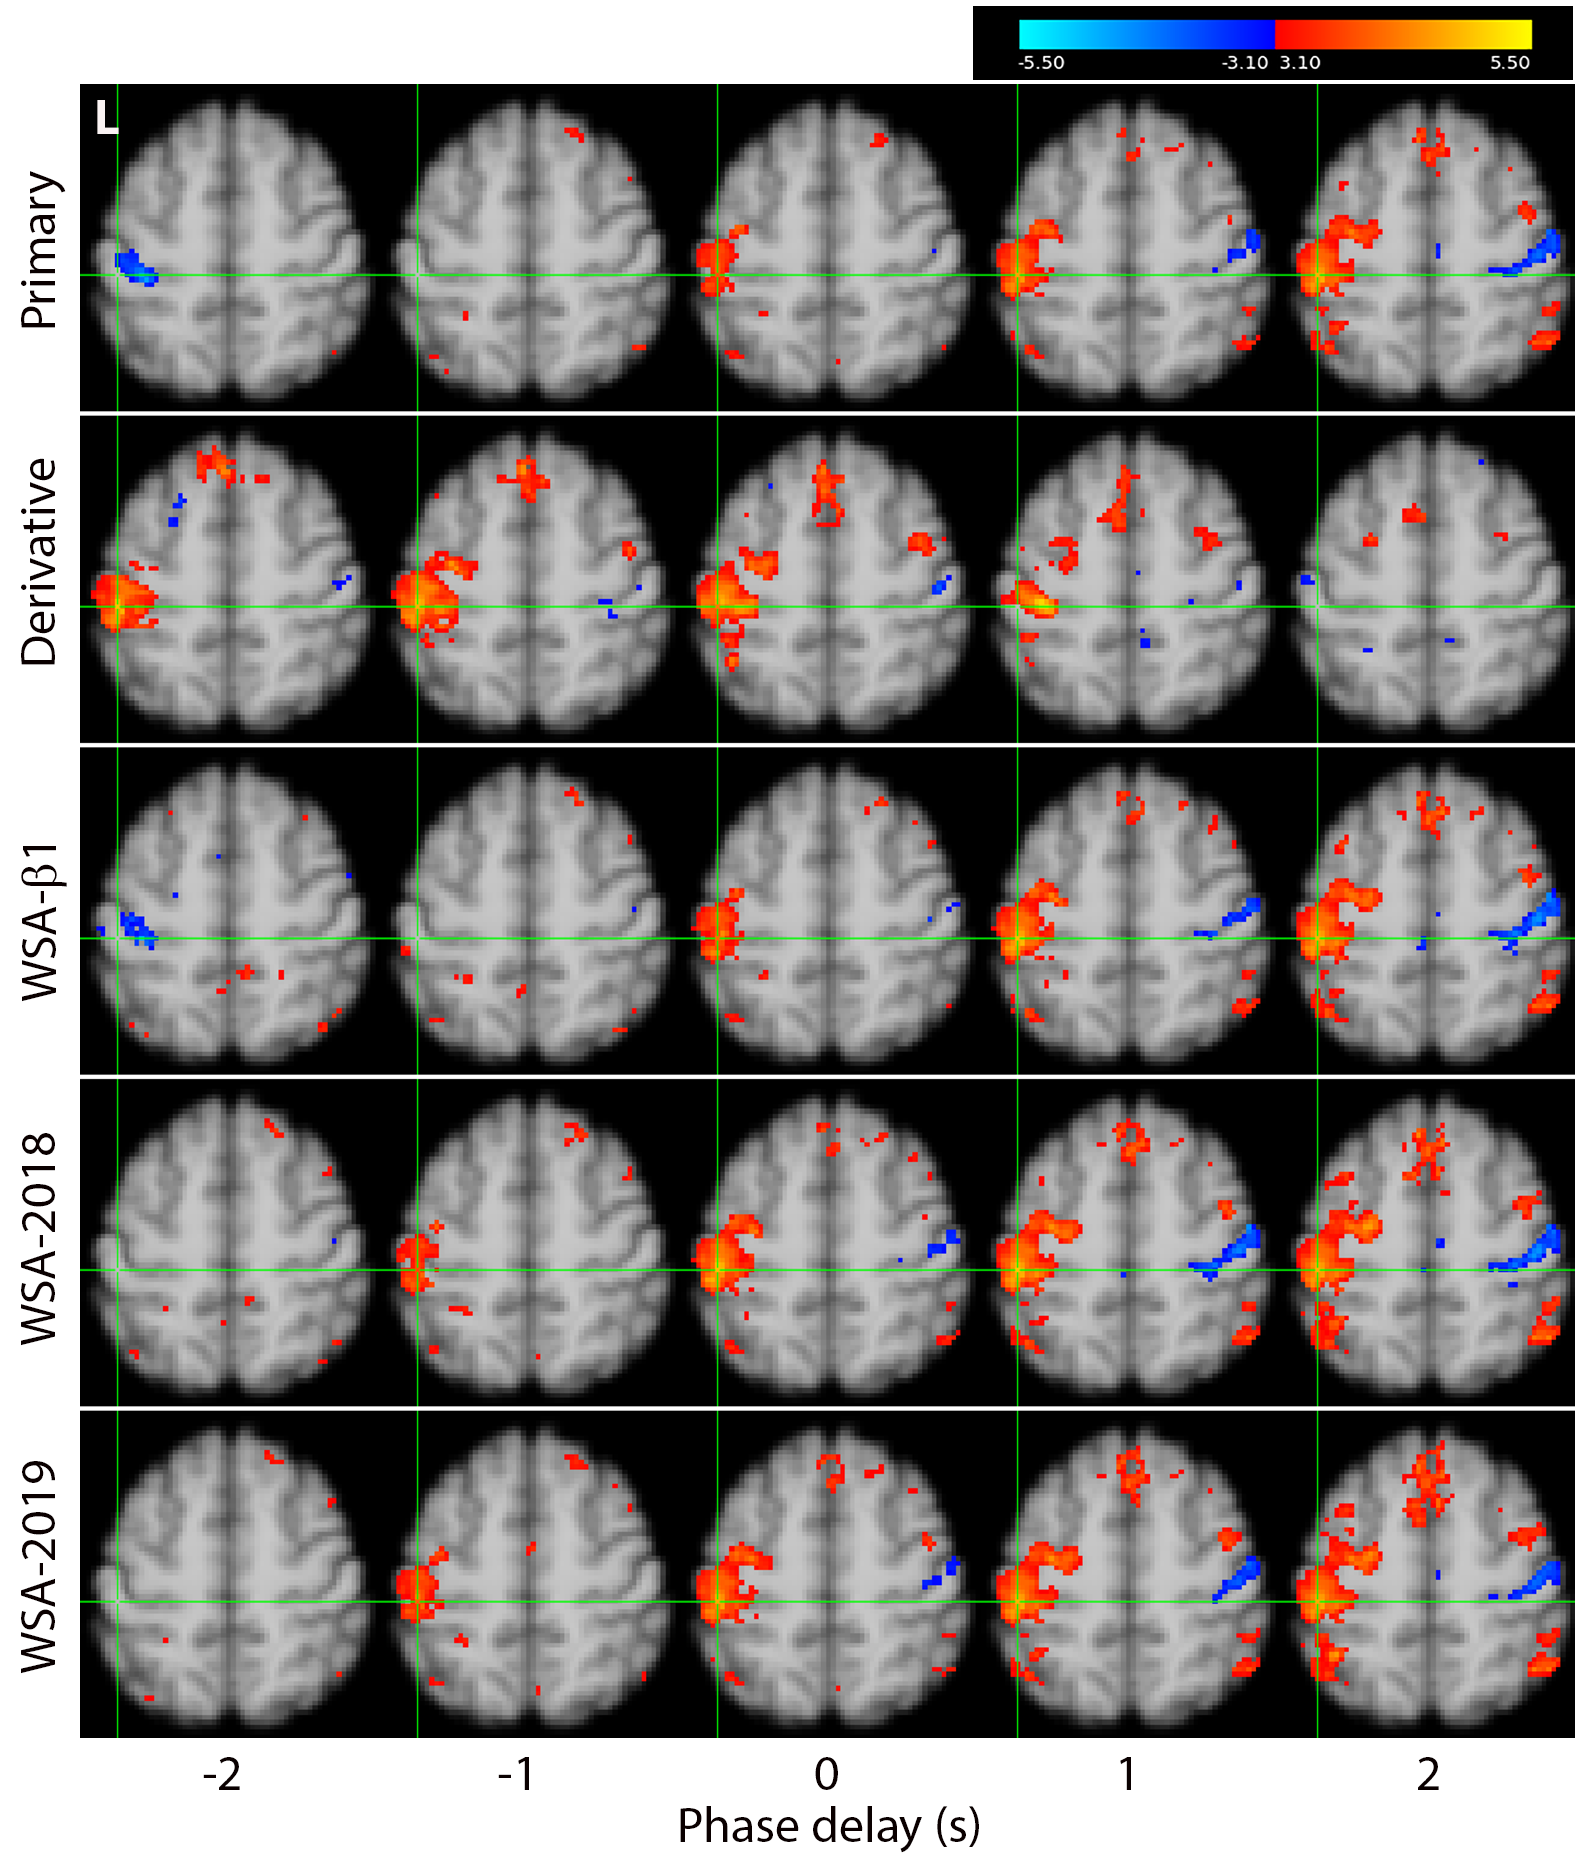
The BOLD maps for the button presses were active on the left somatosensory cortex and the right cerebellum. The z-score maps of the two cortices were compared in Figs. 4 and 5 for the primary, the derivative and the combined estimates. It was confirmed that the new WSA method is better than the other WSA methods and it is comparable with the last year’s WSA on both somatosensory cortex and cerebellum.Discussion
In the existing method, the temporal derivative has been included only to reduce the residual error in the GLM analysis, which might be due to a lack of the proper method of combining the primary and derivative estimates. The temporal derivative has been used as an alternative and effective method for the slice timing correction. This approach for the slice timing correction has the same limitation as the GLM analysis. The proposed method not only improves the BOLD sensitivity with latency but also it propagates the increased BOLD activity on the first-level GLM analysis to the higher level group analysis.Conclusions
The improved WSA method successfully reflected the BOLD signals in the primary and derivative estimates onto the combined estimate without an ad hoc adjustment of parameters that was needed in the last year’s WSA method. In addition, the ellipse model for the variance of the combined estimate was confirmed to work.Acknowledgements
The HCP data is very valuable for such a technical development and the HCP team including Dr. Barch was very responsive to questions.References
1. Calhoun VD, et al. fMRI analysis with the general linear model: removal of latency-induced amplitude bias by incorporation of hemodynamic derivative terms. Neuroimage. 2004;22(1):252-257.
2. Jung K-J, Jung H-M. A Weighted Square Averaging Method of Combining Primary and Temporal Derivative Parameter Estimates In General Linear Model Analysis of Functional MRI. 2018; Paris, France. p 2322.
3. Barch DM, et al. Function in the human connectome: task-fMRI and individual differences in behavior. Neuroimage. 2013;80:169-189.
Figures