3910
Human brain task-specific network mapping1Department of Radiology, Michigan State University, East Lansing, MI, United States
Synopsis
The activity of neural networks gives rise to simple motor behaviors as well as complex behaviors. To understand how the network activity is transformed into human behaviors, it is necessary to identify task-specific networks and analyze the dynamic network activity that changes with time. A functional area of unitary pooled activity (FAUPA) is defined as an area in which the temporal variation of the activity is the same across the entire area. Using the signal time course of a task-associated FAUPA may identify the functional network specific for the task. This study introduced a novel method to map task-specific networks.
Introduction
The activity of neural networks gives rise to simple motor behaviors as well as complex behaviors. To understand how the network activity is transformed into human behaviors, it is necessary to identify task-specific networks and analyze the dynamic network activity that changes with time. For task-fMRI data analysis, conventional methods, such as the general linear model1, sets up an expected ideal response and fits it with the BOLD signal time course on a voxel-by-voxel basis so as to generate an activation map with a chosen significance level. Thus identified activated areas depend on the threshold chosen; different thresholds may yield different areas and it may be difficult to justify a chosen threshold. In addition, patients suffering neurological disorders may respond to the tasks differently than healthy controls, and therefore the expected ideal response of the healthy controls may not match well with the patients’ response, limiting its application to disease-specific and clinically relevant studies. We recently reported the discovery of functional areas of unitary pooled activity (FAUPAs) with fMRI2. A FAUPA is defined as an area in which the temporal variation of the activity is the same across the entire area, and we used new techniques to identify FAUPAs that involved the iterative aggregation of voxels dependent upon their intercorrelation3. The determination of FAUPA is objective and automatic with no requirement of a priori knowledge of the activity-induced ideal response signal time course, and this method enables us to identify FAUPAs that are associated with a specific task2. In this study, we investigated using the signal time course of a task-associated FAUPA to map the functional network specific for the task.Methods and Materials
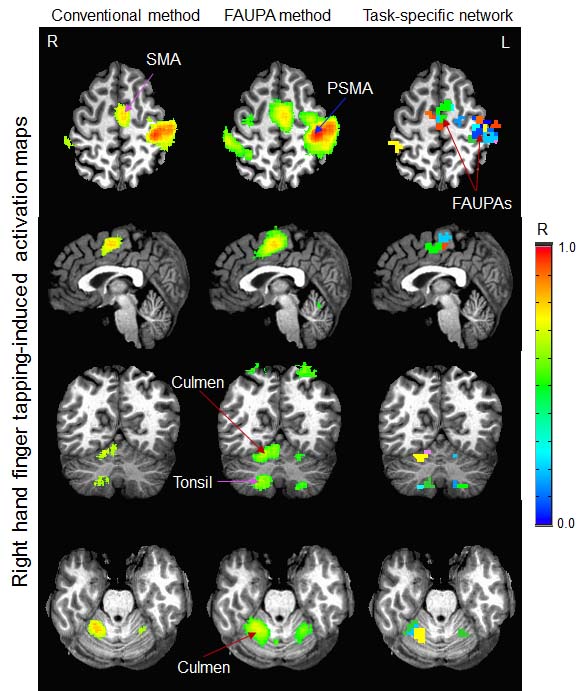
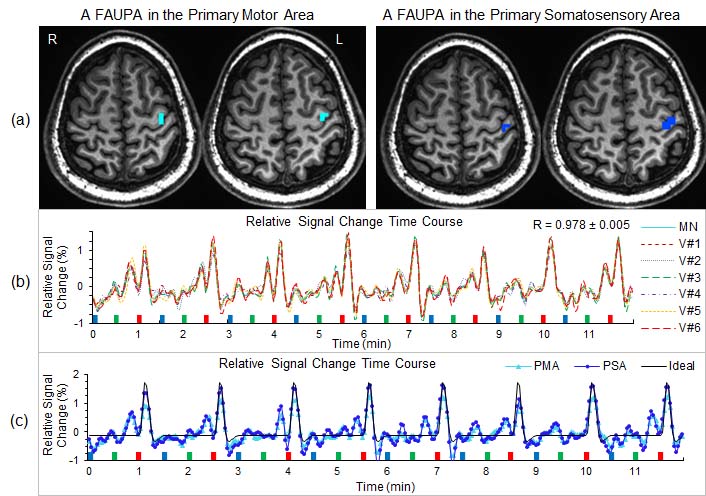
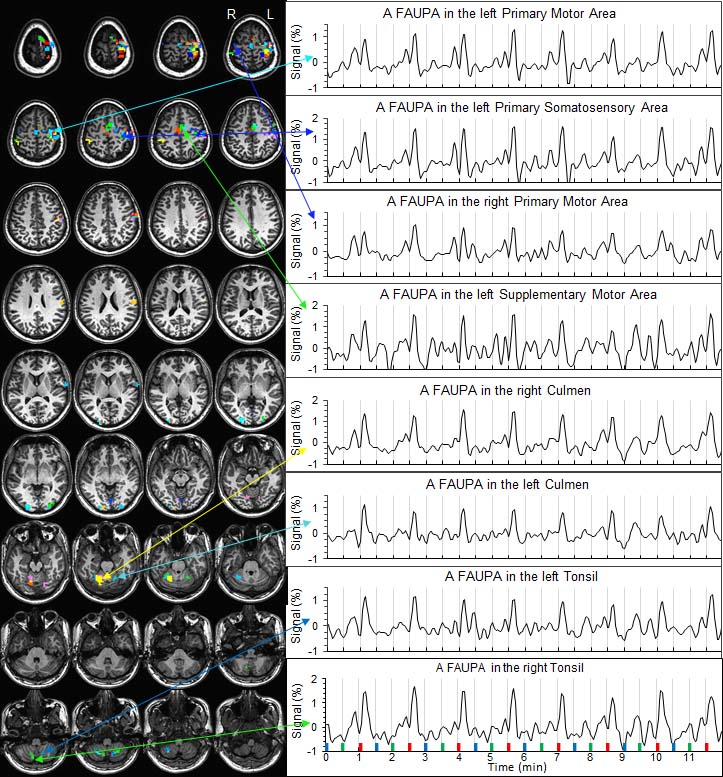
Nine healthy subjects (5 male and 4 female, ages from 21 to 55) participated in the study. Each participant undertook a 12-min task-fMRI scan. The task paradigm consists of a total of 24 task trials with 3 different tasks of word-reading, pattern-viewing and finger-tapping (FT). Each trial is composed of a 6-s task period followed by a 24-s rest period. Functional brain images were acquired on a GE 3T clinical scanner with an 8-channel head coil using a GE-EPI pulse sequence (TR=2500ms, voxel size 3.5×3.5×3.5 mm3). Thirty-eight axial slices to cover the whole brain were scanned. A standard image preprocessing2 including spatial filtering (FWHM 4mm) and bandpassing (0.009-0.08Hz) was performed using AFNI4. A statistical model and Matlab-based software algorithms have been developed and tested to identify FAUPA3. For each participant, a FT-associated FAUPA in the primary motor area was identified, and then its signal time course was used as the reference function to compute Pearson correlation coefficient (R) for each FAUPA. A FAUPA with R>0.8 (N=288, P<5.5×10-42) was identified as a FT-associated FAUPA, and all FT-associated FAUPAs formed a FT-specific network for the participant. For group comparison, we also computed a voxel-by-voxel R map in the original space. To compare the activated areas generated with this FAUPA method with that of the conventional method, an ideal response time course induced by the FT task alone was generated and used as the reference function to yield another R map. Then, all R maps were converted to the Talairach space using AFNI. For each method, the mean R map was thresholded with R>0.45 (N=288, P<2.2×10⁻¹⁴) to yield a FT-evoked activation map, and then we compared this activation map between the two methods.Results and Discussion
The activation map generated with the conventional method clearly shows the areas that are expected to be activated by the FT task, such as the primary sensorimotor area, supplementary motor area, premotor area, cerebellum, etc. (Fig. 1, left column). The FAUPA method generated an activation map similar as that of the conventional method (Fig. 1, middle column), validating the FAUPA method compared to the conventional method. FT-associated FAUPAs in the primary sensorimotor area were identified for each participant, and Fig. 2 shows two FT-associated FAUPAs and their corresponding signal change time courses for one representative participant. A FT-specific network was also identified for each participant, and Fig. 3 illustrates the FT-specific network for the representative participant. As illustrated, FT-induced signal changes are conspicuous for each of the eight FT trials and these signal changes show a remarkable similarity across the network. These results demonstrate that the introduced FAUPA method offers a means to investigate dynamic network activity by analyzing the task-induced signal changes from trial to trial, potentially linking the network activity with the human behaviors. Comparing task-specific networks between healthy controls and those with neurologic diseases may reveal the relationship between task-specific networks and the disease.Acknowledgements
No acknowledgement found.References
1. Friston, K. et al. Statistical parametric maps in functional imaging: A general linear approach. Hum Brain Mapp 2, 189-210 (1995).
2. Huang, J. Human brain functional areas of unitary pooled activity discovered with fMRI. Sci Rep 8, 2388, doi:10.1038/s41598-018-20778-3 (2018).
3. Huang, J. Method and system for determining brain-state dependent functional areas of unitary pooled activity and associated dynamic networks with functional magnetic resonance imaging. United States Patent and Trademark Office, PCT Application (PCT/US2018/019819), filing data: February 27 (2018).
4. Cox, R. W. AFNI: software for analysis and visualization of functional magnetic resonance neuroimages. Comput Biomed Res 29, 162-173 (1996).
Figures