3909
Empirical Mode Decomposition and Energy-Period Characteristics of Brain Networks in Group fMRI Resting-State Data1Cleveland Clinic Lou Ruvo Center for Brain Health, Las Vegas, NV, United States, 2University of Colorado, Boulder, CO, United States, 3University of Management and Technology, Lahore, Pakistan, 4School of Public Health, University of North Texas, Fort Worth, TX, United States
Synopsis
In this project, we have studied resting-state networks using Empirical Mode Decomposition (EMD) to obtain energy-period information and compared results with the Maximal Overlap Discrete Wavelet Transform (MODWT) and the Short-Time Fourier Transform (STFT). We chose the STFT and MODWT for comparison with EMD, because the STFT is based on Fourier basis functions, the MODWT allows more adaptivity but still is model-based by wavelet functions, and EMD is model-free, adaptive and entirely data-driven. EMD showed the strongest relationship to frequency and energy content for different clusters of resting-state networks.
Introduction
Empirical Mode Decomposition (EMD)1,2,3 was used as a data-driven method to study the natural occurring frequency bands and energy relationships of resting-state networks. Energy-period characteristics are compared in relation to Gaussian noise data using three techniques, namely EMD, the Short-Time Fourier Transform (STFT) and the Maximal Overlap Discrete Wavelet Transform (MODWT). We chose the STFT and MODWT for comparison with EMD, because the STFT is based on Fourier basis functions, the MODWT allows more adaptivity but still is model-based by wavelet functions, and EMD is model-free, adaptive and entirely data-driven.Methods
FMRI was performed on 22 healthy subjects in a 3T Siemens MRI scanner using multiband EPI with imaging parameters: MB8, TR 765ms, TE = 30ms, 80 slices in oblique axial orientation, resolution 1.65mm x 1.65mm x 2mm, 2380 timeframes. After the usual preprocessing steps, all voxels were resampled to a 2mm x 2mm x 2mm grid. Group ICA (based on the FastICA algorithm4) was performed by stacking all data in the temporal domain and 30 resting-state networks were computed. The group time series signatures of all ICA networks were obtained and further decomposed by EMD into IMFs. The mean energy per unit time and the mean period were computed for each IMF of all ICA components. Energy and period of all IMFs can be considered as a feature vector of each ICA component. We used k-means clustering on all feature vectors, ran cross- validation using the leave-one-out method and determined the optimal number of clusters. We also carried out a principal component analysis of all feature vectors to determine if there is a linear relationship of the first PCA component with frequency, energy and type of the obtained clusters. All results obtained with EMD were compared with STFT and MODWT using Daubechies db6 wavelets.Results
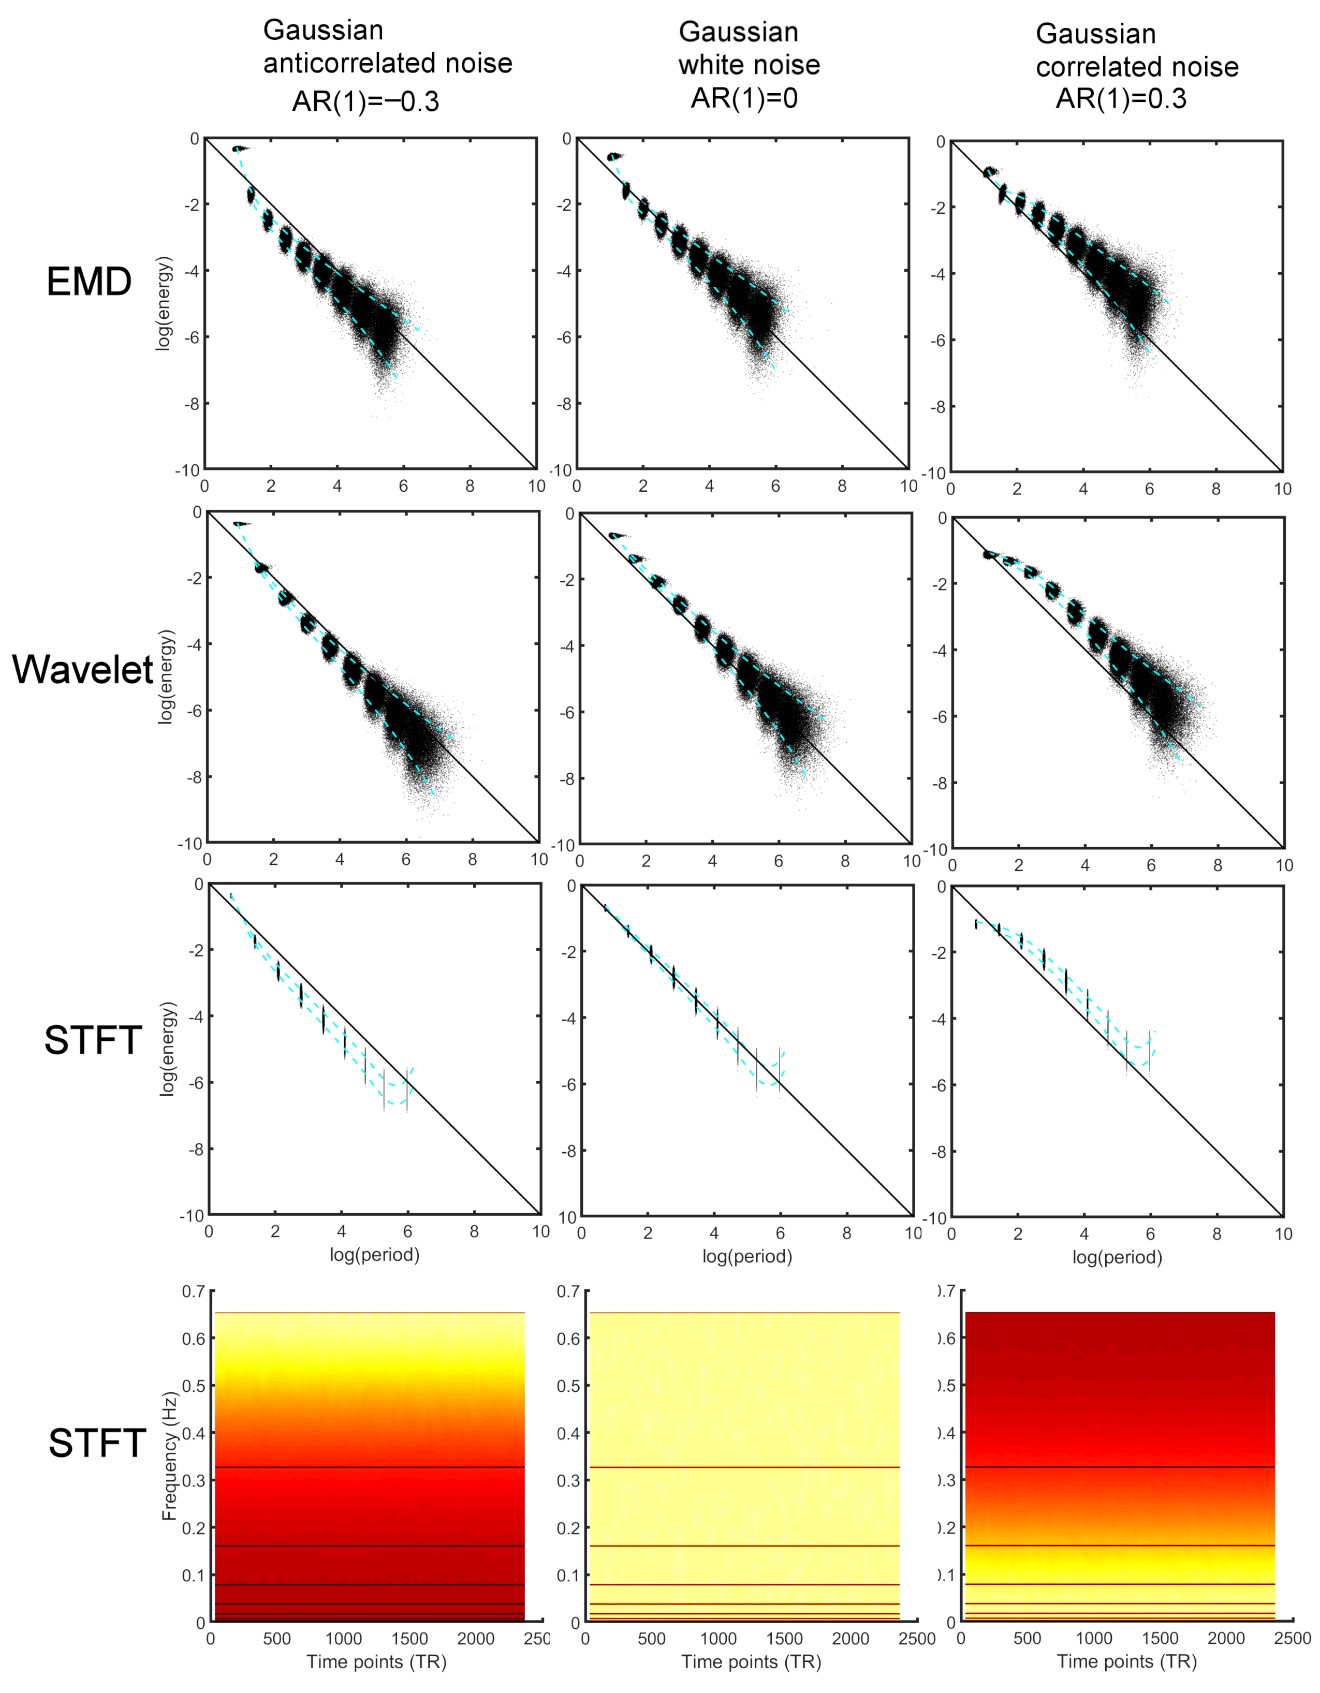
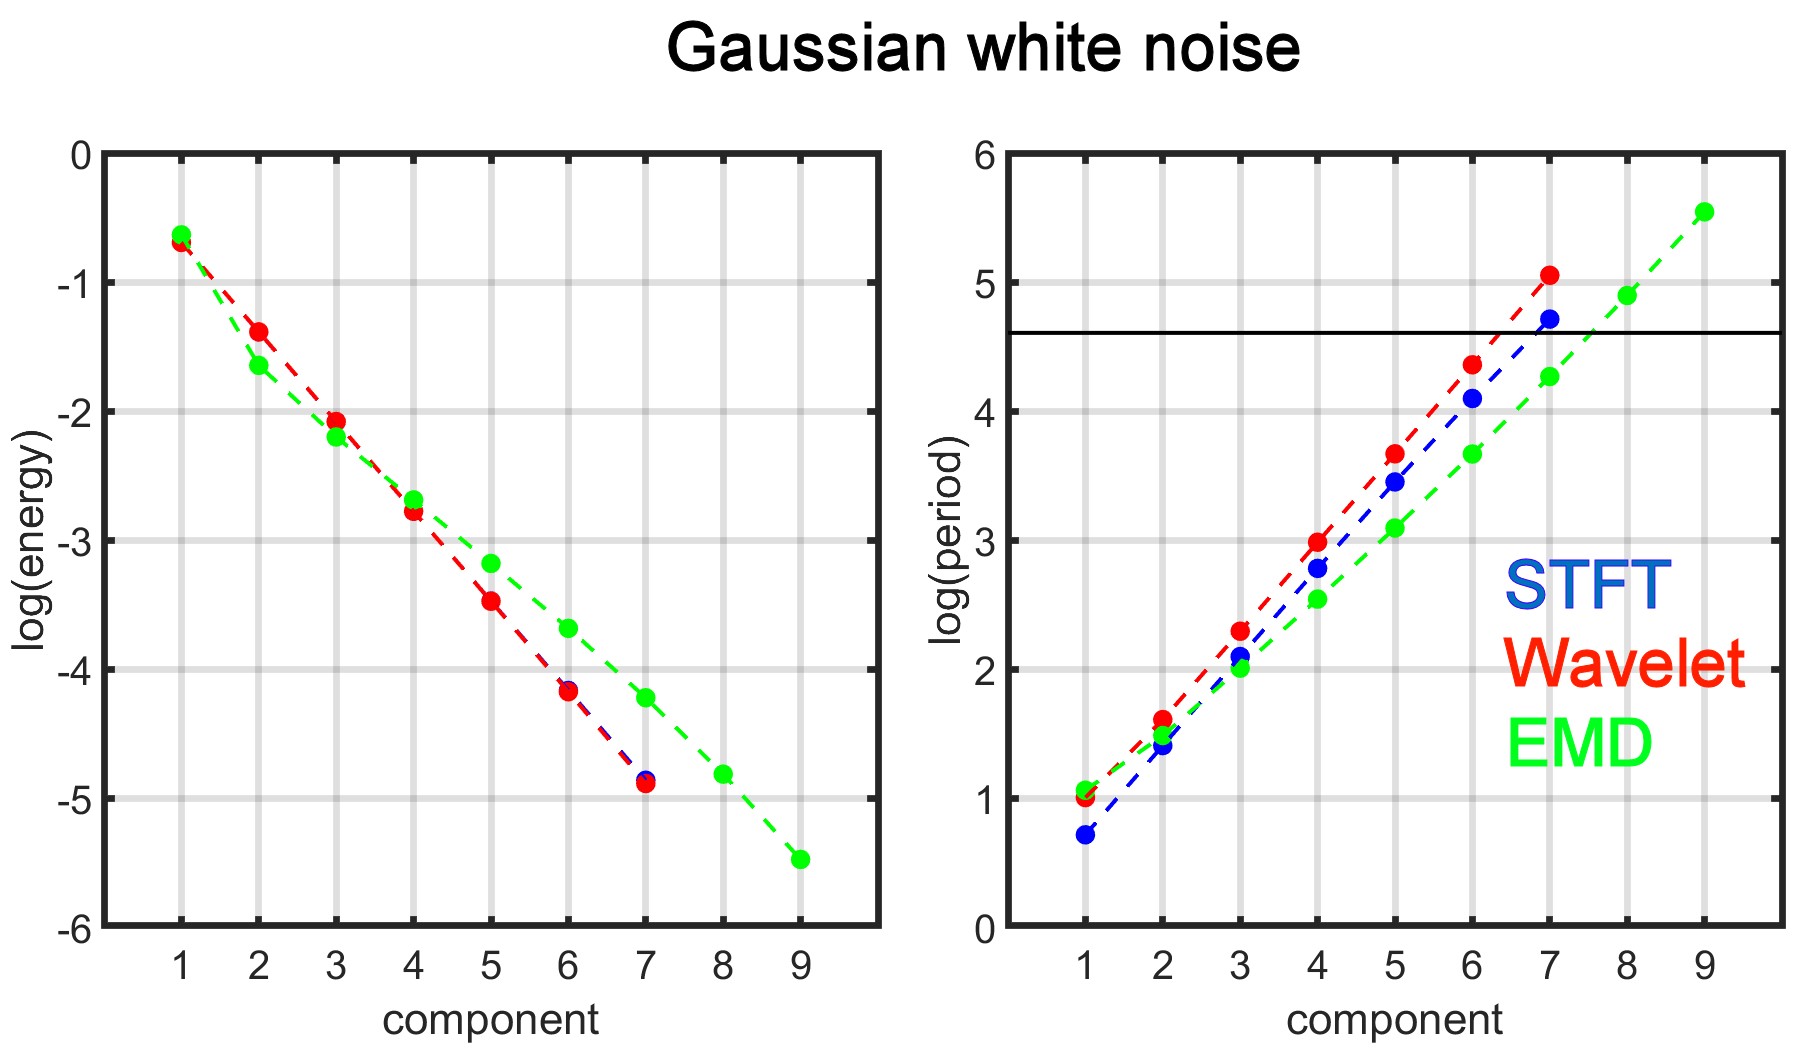
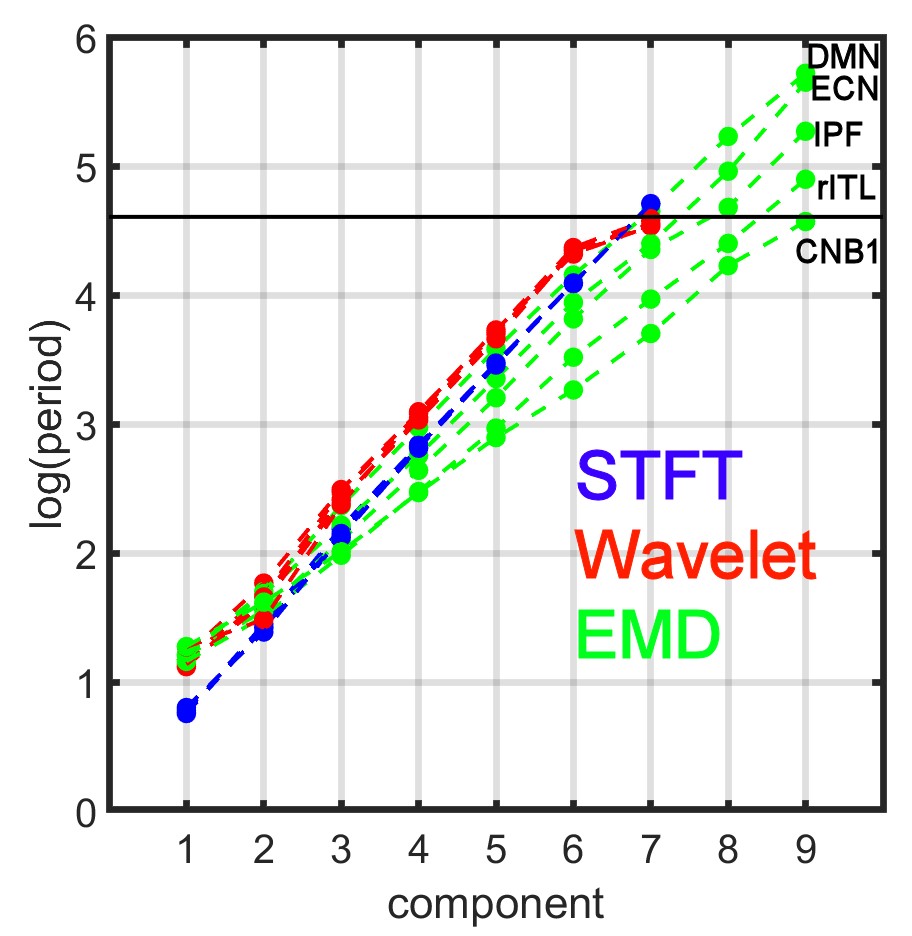
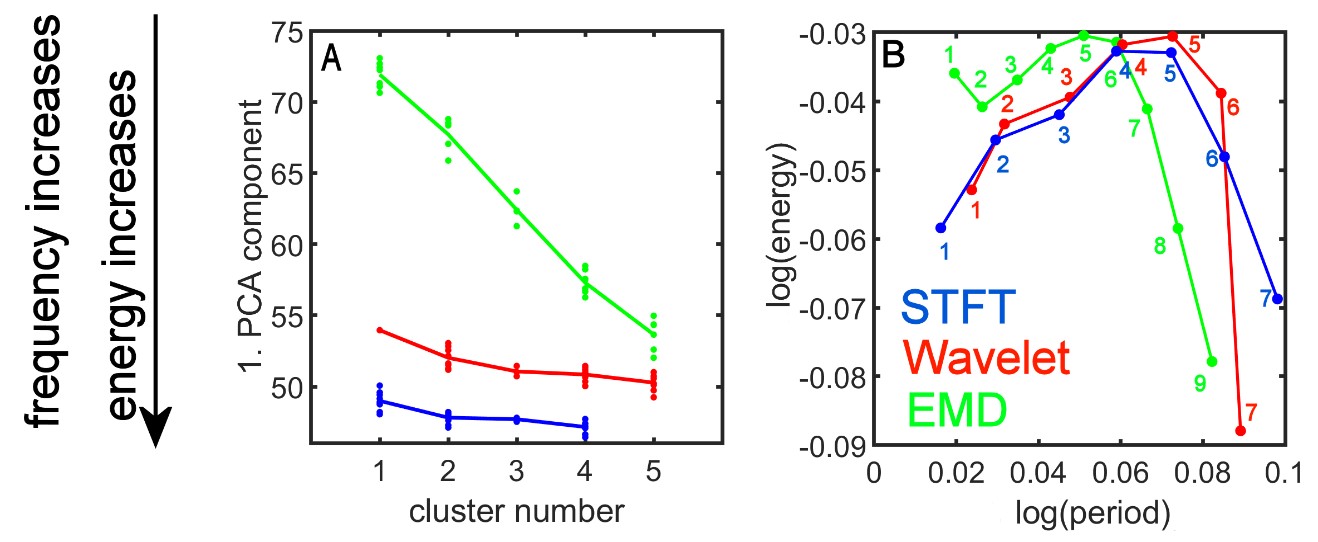
Fig.1 shows a comparison of the energy-period relationship of different noise processes for simulated time series data (TR 0.765s). Energy-period information was calculated using EMD, MODWT and STFT for all dyadic decomposition levels of the frequency range. Fig.2 shows the log(energy) and log(period) as a function of the decomposition level. EMD does not provide an exact dyadic decomposition of the frequency unlike STFT and MODWT. Clustering in feature space of the real resting-state data gave 5 clusters for EMD, 5 clusters for MODWT and 4 clusters for STFT. Fig.3 shows the results for the resting-state data. The decomposition by EMD is adaptive and different for the default mode network (DMN of cluster 1), the executive control network (ECN of cluster 2), the inferior prefrontal network (IPF of cluster 3), the right inferior temporal network (rITL of cluster 4) and the cerebellar network1 (CNB1 of cluster 5), whereas STFT and MODWT provides the same characteristic slope as a function of the decomposition level for all networks. In Fig.4 we show the first PCA component as a function of the cluster number and computed the frequency and energy contribution of this PCA component for the different networks constituting the 5 clusters.Discussion
The period as a function of the decomposition level for all clusters have the same slope for STFT and MODWT, but for EMD this slope is varying for different clusters. Here, IMF frequency content is smallest for traditional networks in cluster 1 (for example the DMN) and decreases as the cluster number increases (for example the cerebellar networks in cluster 5 have the smallest slope indicating high frequency content). A PCA decomposition of the feature vectors is also instructive and shows that only EMD provides a significant linear relationship of the value of the 1st PCA component as a function of the cluster number. Since the clusters also are clearly linearly separable in PCA space for EMD, but not for the STFT and MODWT methods, EMD provides the most compact representation of the different types of resting-state networks. Furthermore, since each eigenvector of the feature matrix is linearly related to the PCA component values, a decrease of the 1st PCA component is associated with a differential increase in energy and a decrease in period. Thus, for the EMD method, larger cluster numbers are associated with networks that operate at higher frequencies and larger energy content, whereas the MODWT and STFT methods lead to weaker relationships due to the smaller slope of 1st PCA component as a function of the cluster number.Conclusion
We have studied resting-state networks using EMD, MODWT and STFT to obtain energy-period information. EMD showed the strongest relationship to frequency and energy content for different clusters of resting-state networks.Acknowledgements
The study is supported by the National Institutes of Health (grant number 1R01EB014284 and P20GM109025) and a private fund from Peter and Angela Dal Pezzo.References
[1] Huang NE et al. The empirical mode decomposition and the Hilbert spectrum for nonlinear and non-stationary time series analysis. Proc. R. Soc. Lond. A 454, 903-995.
[2] P. Flandrin, et al. Empirical mode decomposition as a filter bank, IEEE Sig. Proc. Letters 2004, 11(2), 112-114.
[3] Niazy RK, et al. Spectral characteristics of resting-state networks. Prog. Brain Res. 2011, 193:259-276.
[4] Hyvärinen A. Fast and Robust Fixed-Point Algorithms for Independent Component Analysis. IEEE Transactions on Neural Networks 1999, 10(3):626-634.
Figures