3907
Automatic seed selection for resting state fMRI data analysis by using machine learning1Diagnostic Radiology, Cleveland Clinic, Cleveland, OH, United States
Synopsis
To facilitate seed-based resting state fMRI (rs-fMRI) data analysis, we have been developing a method to automatically compute the seed location by using anatomical and rs-fMRI data. In the method, self-organizing map (SOM) is used to cluster voxels within searching ROI and then the seed locations are derived from the voxel clusters. The methods were tested on ten subjects to find seed in the motor cortex. The computed seeds successfully matched unilateral finger tapping fMRI maps in eight out of ten subjects.
Introduction
When using seed-based methods to analyze resting state fMRI (rs-fMRI) data, the selection of the seed has large influence on the results. In case that the seed cannot be identified by task-based fMRI, anatomical and resting state functional data are combined together to determine the seed for each individual subject. We have been developing a method to automatically compute the seed location by using anatomical and rs-fMRI data. In the method, self-organizing map (SOM) is used to cluster voxels within searching ROI and then the seed locations are derived from the voxel clusters. The methods were tested on ten subjects to find seed in the motor cortex. The computed seeds successfully matched unilateral finger tapping fMRI maps in eight out of ten subjects.Methods
Data acquisition: Ten subjects consisting five healthy controls and five patients were scanned in an IRB-approved protocol at 3T Siemens scanner (Erlangen, Germany) using a bitebar to reduce head motion, in a 12-ch receive head coil. Scans included T1-MPRAGE (voxel size=1x1x1.2mm, matrix size=256x256x120, TE/TR/TI=1.75/1900/900ms), unilateral finger tapping fMRI( voxel size=2x2x4mm, matrix size=128x128x31, TR/TE/FA=2800/29/80, 160 volumes), and rs-fMRI(voxel size=2x2x4mm, matrix size=128x128x31, TR/TE/FA=2800/29/80, 132volumes).
Data
processing: Each fMRI and rs-fMRI dataset was motion-corrected, low-pass
filtered and spatially filtered. T1
image was parcellated into ROIs by using FreeSurfer[1]. The ROIs were
registered to rs-fMRI image space by using AFNI[2]. The two ROIs covering the motor
cortex were used as searching region. From rs-fMRI data, the global
connectivity between each voxel in the searching region and all other brain cortex
voxels were computed[3] and then the connectivity distribution was fitted
into a Gaussian distribution. The feature vectors were formed by counting the number
of voxels whose connectivity value was outside three standard deviation, in the
parcellated cortex ROIs. The feature
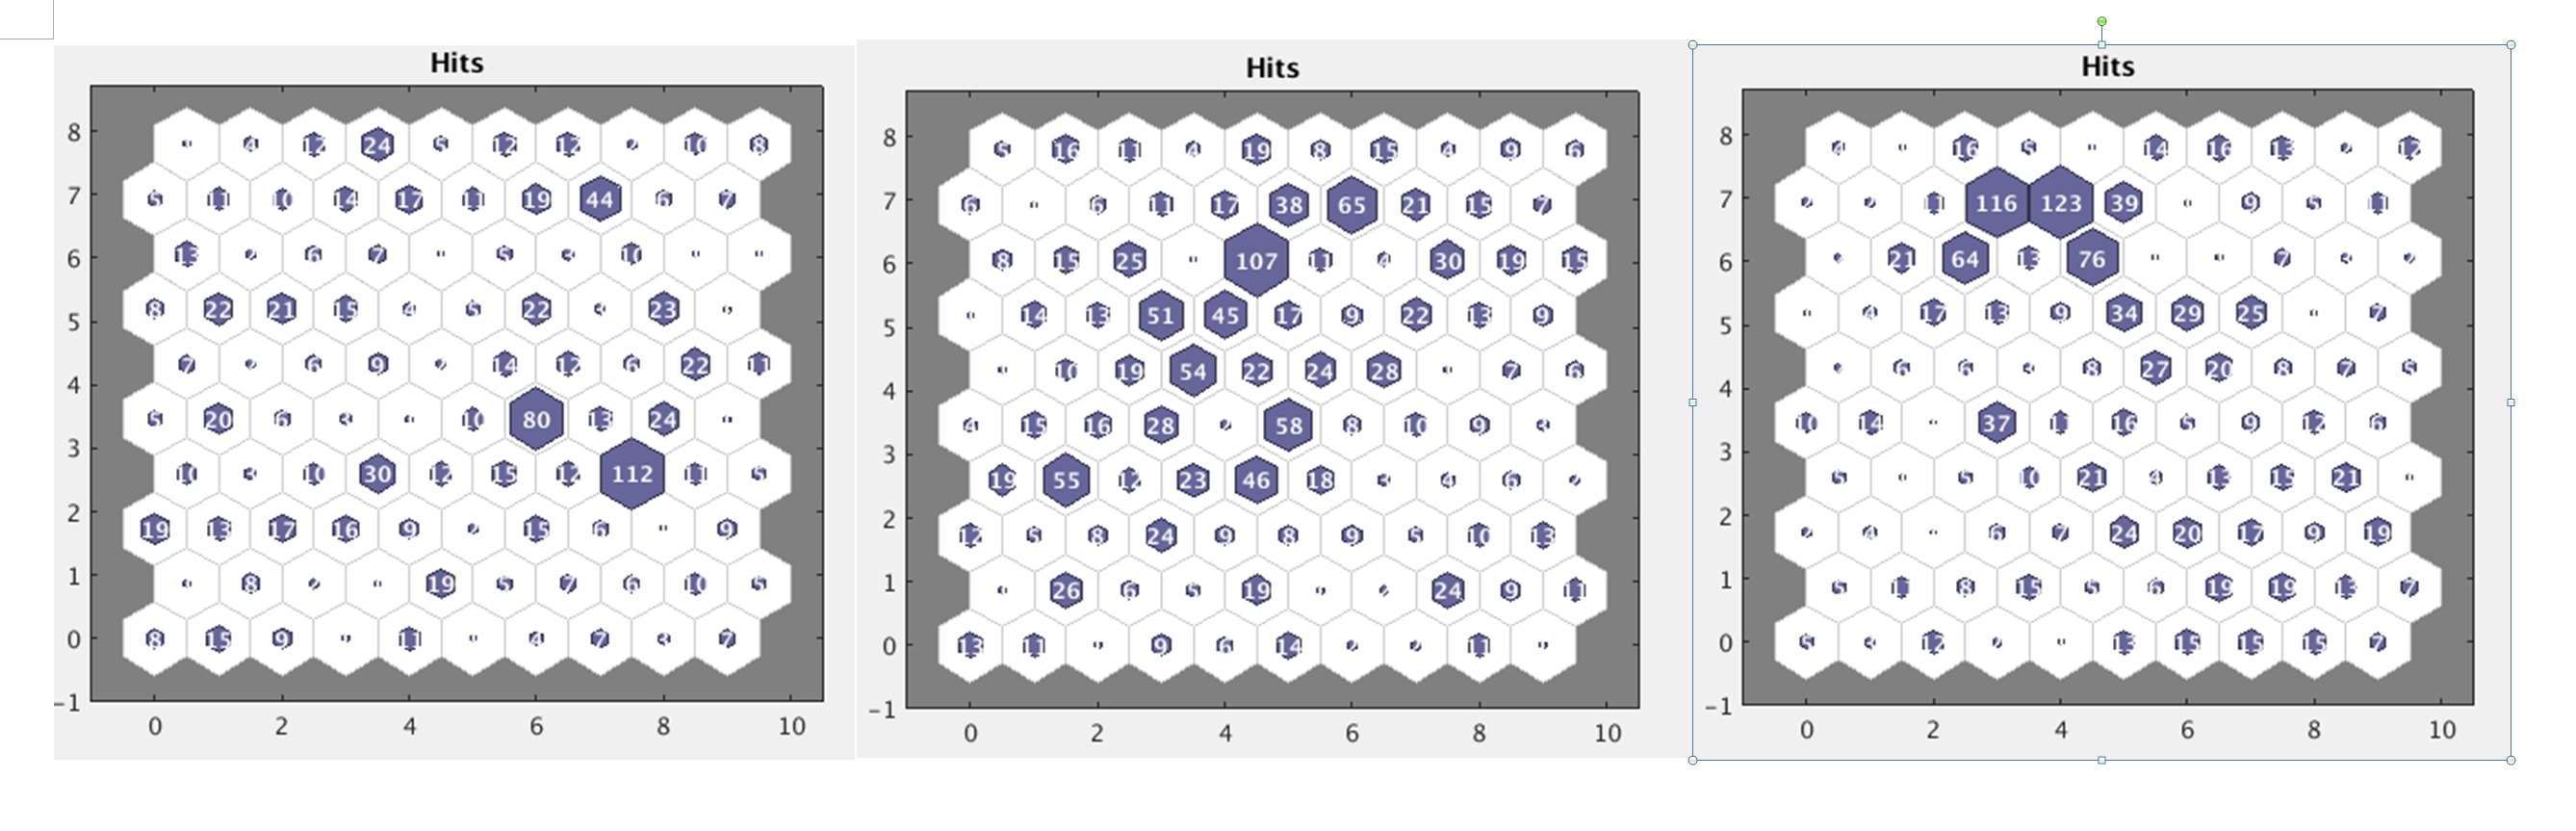
vectors of all the voxels in the searching region was feed into a size 10x10 SOM
classifier in Matlab. The seed locations were computed from the top fifteen clusters with
the largest number of voxels.
Student-t maps were calculated from fMRI data and then registered to rs-fMRI space by using AFNI. The most activated motor cortex region on the fMRI map was specified as fMRI ROI which indicated the correct seed location.
Method validation: The seeds generated by the method were tested against the fMRI ROIs in the ten subjects.
Results
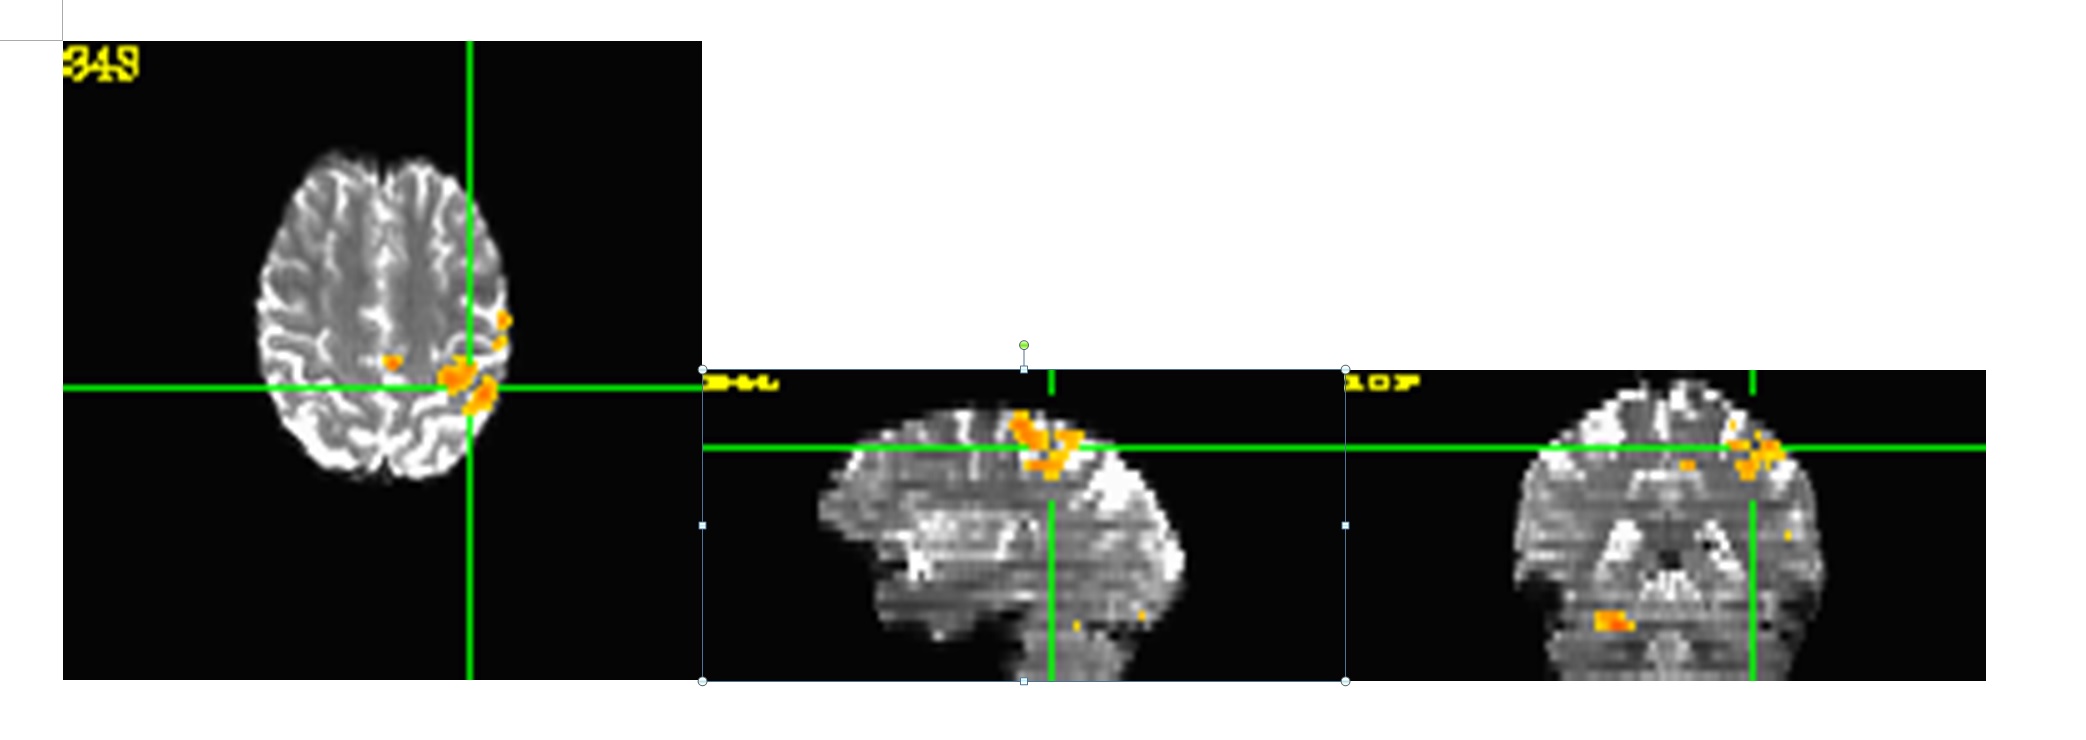
In eight out of ten subjects, the method was able to generate seeds that fell into fMRI ROI. The method failed on two subjects because the whole seed search region generated by FreeSurfer was outside fMRI ROI. The fMRI ROI from one subject is shown in Figure 1. The seed generated from one cluster matched the fMRI ROI. The seed generated from another cluster matched the most activated region in the somatosensory cortex. The seeds derived from largest clusters did not match the fMRI ROI. The matched seeds were from one of the medium size clusters. Figure 2 demonstrates the SOM clustering results from three subjects.Conclusions and Discussions
The method was proved to effectively generate seeds which matched fMRI results in the motor cortex. The FreeSurfer parcellation results have decisive influence on seed searching region. The parcellation results also influence the generation of feature vectors. We are still in the development of a way to determine which generated seed or which SOM generated voxel cluster is the valid oneAcknowledgements
This work was supported by the Imaging Institute, Cleveland Clinic.
Authors acknowledge technical support by Siemens Medical Solutions.
References
[1] Jenkinson M, et al. (2012), NeuroImage. 62(2):782-790.
[2] Cox RW.(2012), NeuroImage. 62(2):743-747.
[3] Lowe MJ, et al. (1998), NeuroImage. 7(1):119-132.
Figures