3906
Impact of small parcellation changes on global and local brain connectivity metrics: a study of resting state fMRI1Medical Physics Department, IRCCS Bambino Gesù Children’s Hospital, Rome, Italy, 2Imaging Department, IRCCS Bambino Gesù Children’s Hospital, Rome, Italy, 3NESMOS, Department of Neuroradiology, S. Andrea Hospital, Sapienza University, Rome, Italy
Synopsis
This work studied the impact of small parcellation changes on functional brain connectivity metrics. The study made use of Rs-fMRI dataset formed of 73 healthy controls and 73 schizophrenic patients. Brain parcellation was performed with standard atlasDKT40. Starting from this parcellation, fifty new parcellations were created by randomly modifying it. Weighted and unweighted adjacency matrices were constructed. 38 local and global network measures were derived. Brain connectivity measure variation factor was computed for each analysed measure. This study identified measures that are more robust with respect to spatial error in parcellation.
INTRODUCTION
There is a growing interest in studying human brain connectivity and in modelling brain functional structure as a network1,2,3,4. In general, creation of brain network requires parcellation of cerebral cortex and inner structures so that the network nodes can be defined. Along with anatomical and functional brain study, brain parcellation has been an important topic in neuroscience. fMRI brain connectivity has actually inherited the topic by implementing different methods of parcellations5. However, parcellations might be affected by inter subject variability deriving from anatomic and physiological characteristics, age and pathological conditions. This study used resting state functional MRI (Rs-fMRI) to investigate how parcellation changes due to spatial variation can influence functional connectivity network measures. The aim of this study was then to identify graph measures that are more robust to spatial error when brain is parcelled.METHOD
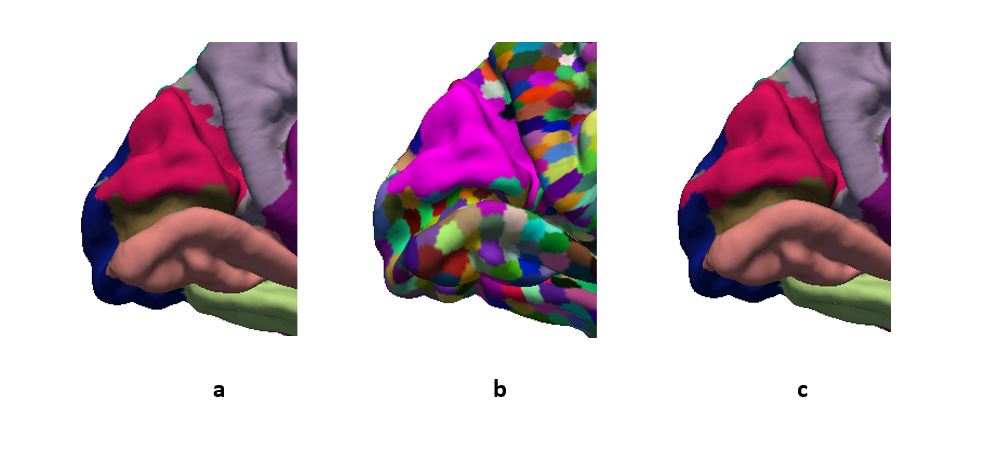
The study made use of COBRE dataset (http://fcon_1000.projects.nitrc.org/indi/retro/cobre.html). It consists of functional and anatomical data samples from 73 healthy controls (HC) and 73 patients with schizophrenia (SH) and includes a multi-echo MPRAGE sequence and data for Rs-fMRI. Brain parcellation was carried out using Freesurfer with standard atlasDKT40 (64 Standard Macro Parcels: SMaP). Starting from this parcellation, fifty new parcellations (each of them consisting in new 64 Modified Macro Parcels: MMaP) were created by randomly modifying it (Fig.1). Each of these new parcellations were obtained by using freesurfer icosahedric4 parcellation (5124 Icosahedric Micro Parcels: IMiP) . In particular, each IMiP was first mapped to determine which of the 64 SMaP was belonging to. After that, IMiP were randomly moved from one SMaP to the one nearby (Fig. 2). Since changes in SMaP’s areas must be kept below 1.3% and MMaP topology must be similar to corresponding SMaP, only IMiPs at the edges were allowed to be moved. Each of the 50 random iterations consisted in modifying 10 SMaP and each SMaP modification was performed by moving 6 IMiP from neighbourhood. All parcellations were mapped onto Freesurfer common template and then were registered on each subject space. All fMRI data were filtered using Matlab R2017a to reduce the effects of low-frequency drift with linear regression and high-frequency physiological noise with CompCor method6. For each parcellation, mean time series from each parcel were computed. Correlation matrices were calculated using Pearson coefficient as a measure of the functional connectivity between pairs of regions. Weighted and unweighted adjacency matrices were constructed from correlation matrix with 0.2 thresholds. 38 local and global network measures were derived using BrainConnectivity Toolbox (https://sites.google.com/site/bctnet/) and Centrality Consistency functions (https://github.com/BMHLab/CentralityConsistency). Brain connectivity measure variation factor was defined as
v =1/N 1/P ∑Pp=1∑Nn=1(xipMMaP-xipSMaP)2/(xipMMap+xipSMaP)/2)2
whereby xipMMaP and xipSMaP were values of measure under investigation in subject i, for macroparcel p, in standard and new parcellation; N and P were the total number of subjects and parcels respectively. The variation factor was computed for each iteration, for each analysed measure in HC, SH and HC+SH groups.
RESULT
Connectivity network measures variations for 1.3% spatial mean variation of parcellation are displayed in Fig.3 Variation factor is lower in both local and global binary efficiency, in weighted global efficiency, in density, in transitivity and in shortcuts, whereas it is higher in both local and global assortativity, in betweenness centrality, in leverage centrality and in community structure. There are no significant difference among groups.DISCUSSION
Several measures can be evaluated in brain connectivity analysis. This study identified measures that are more robust with respect to spatial error in the parcellation. In particular, the analysis revealed that efficiency, density and transitivity are less influenced by small changes in brain parcellation. Conversely, assortativity, betweeness centrality, leverage centrality and community structure appeared to be prone to larger variations. Even though, these metrics are so common, several studies introduced and computed assortativity7-9, betweenness centrality10-12, leverage centrality13,14, community structure15, to assess functional brain connectivity.CONCLUSION
This work studied inter-subjects parcellation variabilityto assess the impact of parcellation changes on global and local metrics.Also, it points out the importance of paying close attention to possible spatial errors in parcellation especially when reliability may be compromised as consequence of disease, broad age range etc.Acknowledgements
No acknowledgement found.References
1. S. Achard, R. Salvador et al. A Resilient, Low-Frequency, Small-World Human Brain Functional Network with Highly Connected Association Cortical Hubs. J. Neuroscience, 2006, 26(1):63–72
2. D. Bassett, E. Bullmore et al. Hierarchical organization of human cortical networks in health and schizophrenia. J. Neuroscience, 2008, 28(37): 9239–9248.
3. E. Bullmore and O. Sporns, Complex brain networks: graph theoretical analysis of structural and functional systems. Nat. Rev. Neuroscience, 2009, 10(3): 186-198.
4. M. P.van den HeuvelHilleke E.Hulshoff Pol et al. Exploring the brain network: A review on resting-state fMRI functional connectivity. European Neuropsychopharmacology, 2010, 20(8): 519-534.
5. Arslan S, Ktena SI, Makropoulos A et al. Human brain mapping: A systematic comparison of parcellation methods for the human cerebral cortex. Neuroimage. 2018, 15;170:5-30.
6. Yashar B, Khaled R, Joy L et al. A component based noise correction method (CompCor) for BOLD and perfusion based fMRI. Neuroimage. 2007. 37(1): 90–101.
7. U. Braun, M.M. Plichta. Test–retest reliability of resting-state connectivity network characteristics using fMRI and graph theoretical measures. NeuroImage, 2012, 59 1404–1412.
8. C. Park, S.Y. Kim et al. Comparison of the small-world topology between anatomical and functional connectivity in the human brain. Physica, 2008, A 387 5958–5962.
9. A. J. Schwarz and J. McGonigle. Negative edges and soft thresholding in complex network analysis of resting state functional connectivity data. NeuroImage 2011, 55 1132–1146.
10. C. J. Honey, R. Kötter et al. Network structure of cerebral cortex shapes functional connectivity on multiple time scales. PNAS, 2007, 104(24) 10240-10245.
11. W. Liao , J. Ding et al. Small-world directed networks in the human brain: Multivariate Granger causality analysis of resting-state fMRI. NeuroImage, 2011, 54 2683–2694.
12. X. Zhanga, F. Tokoglua et al. Social network theory applied to resting-state fMRI connectivity data in the identification of epilepsy networks with iterative feature selection. J. Neuroscience Methods, 2011, 199 129–139.
13. K.E. Joyce, P.J. Laurienti et al. A New Measure of Centrality for Brain Networks. PLoS One., 2010, 16;5(8):e12200.
14. R. Geetha Ramani and K. Sivaselvi. Weighted Leverage Centrality for Region Role Identification in Brain Networks. World Engineering & Applied Sciences Journal, 2018, 9 (1):12-20.
15. A. Lord, D. Horn, Changes in Community Structure of Resting State Functional Connectivity in Unipolar Depression et al. 2012, https://doi.org/10.1371/journal.pone.0041282
Figures