3905
Evaluation of GLM fit dependency on the temporal sampling rate and the applied HRF model in BOLD fMRI1Brain Imaging Centre, Hungarian Academy of Sciences Research Centre for Natural Sciences, Budapest, Hungary, 2Laboratory for Social and Neural Systems Research, University of Zurich, Zurich, Switzerland
Synopsis
Modeling the haemodynamic response in fMRI is still subject of research. Recent developments in accelerated MRI enabled subsecond whole-brain fMRI. In this work we aim to examine the dependency of BOLD signal analysis on the temporal sampling rate and the applied HRF model by numerically undersampling a fast acquisition. Standard GLM fits with different HRF models were performed, followed by group-level statistical analyses and goodness-of-fit computations. The results indicate that variance across HRF models is increased in the undersampled datasets, while the low-pass-filtered undersampling also shows a possibility to enhance the statistical power on the group level.
Introduction
Modeling the haemodynamic response has been an ongoing work since the beginning of fMRI, with numerous HRF models proposed to achieve this.1 Recently, simultaneous multislice (SMS) EPI2 enabled fMRI acquisitions to have a significantly lower, possibly subsecond TR, even with high-resolution full-brain scanning. In addition to other concerns, fast sampling can also change the sensitivity to the HRF model imperfection, since more samples are measured during a BOLD response. In this work we aim to investigate this relationship by numerically undersampling an SMS-fMRI dataset and performing standard analysis and computing goodness-of-fit measures using multiple frequently used HRF models.Methods
Experiments were performed on a 3T Siemens Prisma scanner, involving 18 consenting healthy young adult subjects.
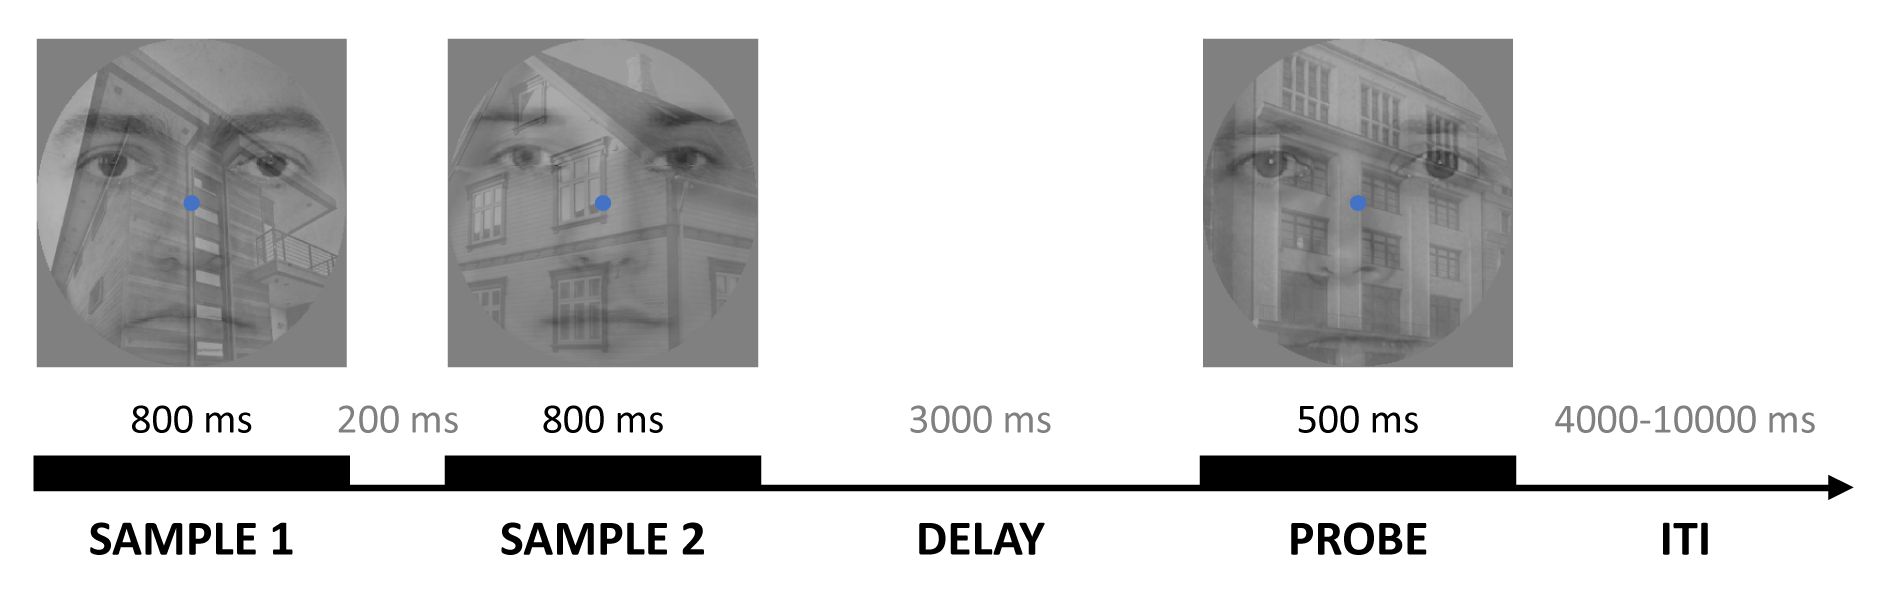
Experimental design of the event-related working memory fMRI study used a modified Sternberg delayed match-to-sample task3 with overlaid face and house stimuli, as visualized in Figure_1. Six-fold slice-accelerated blipped-CAIPI SMS-EPI2,4-6 was used for all functional measurements, using full-brain coverage with 2 mm isotropic resolution and TR=710 ms.
Calculations were performed using SPM12 and Matlab. Images were realigned, normalized to MNI space and smoothed with a 5-mm-FWHM kernel, followed by 128-second high-pass filtering.
To mimic a traditional fMRI acquisiton with TR=2130 ms, an undersampled dataset was created by selecting every third volume in the time-series. An additional dataset was computed by performing a low-pass filter on the time-series with cutoff frequency corresponding to 3 TRs, followed by the above-described undersampling.
First-level statistical analysis used standard General Linear Model (GLM), independently fitting five SPM-built-in models to each dataset: canonical HRF, canonical HRF plus its temporal derivative, canonical HRF plus its temporal and dispersion derivatives, finite impulse response model (FIR) and 3-order gamma functions. The contrast was defined as stimuli vs baseline.
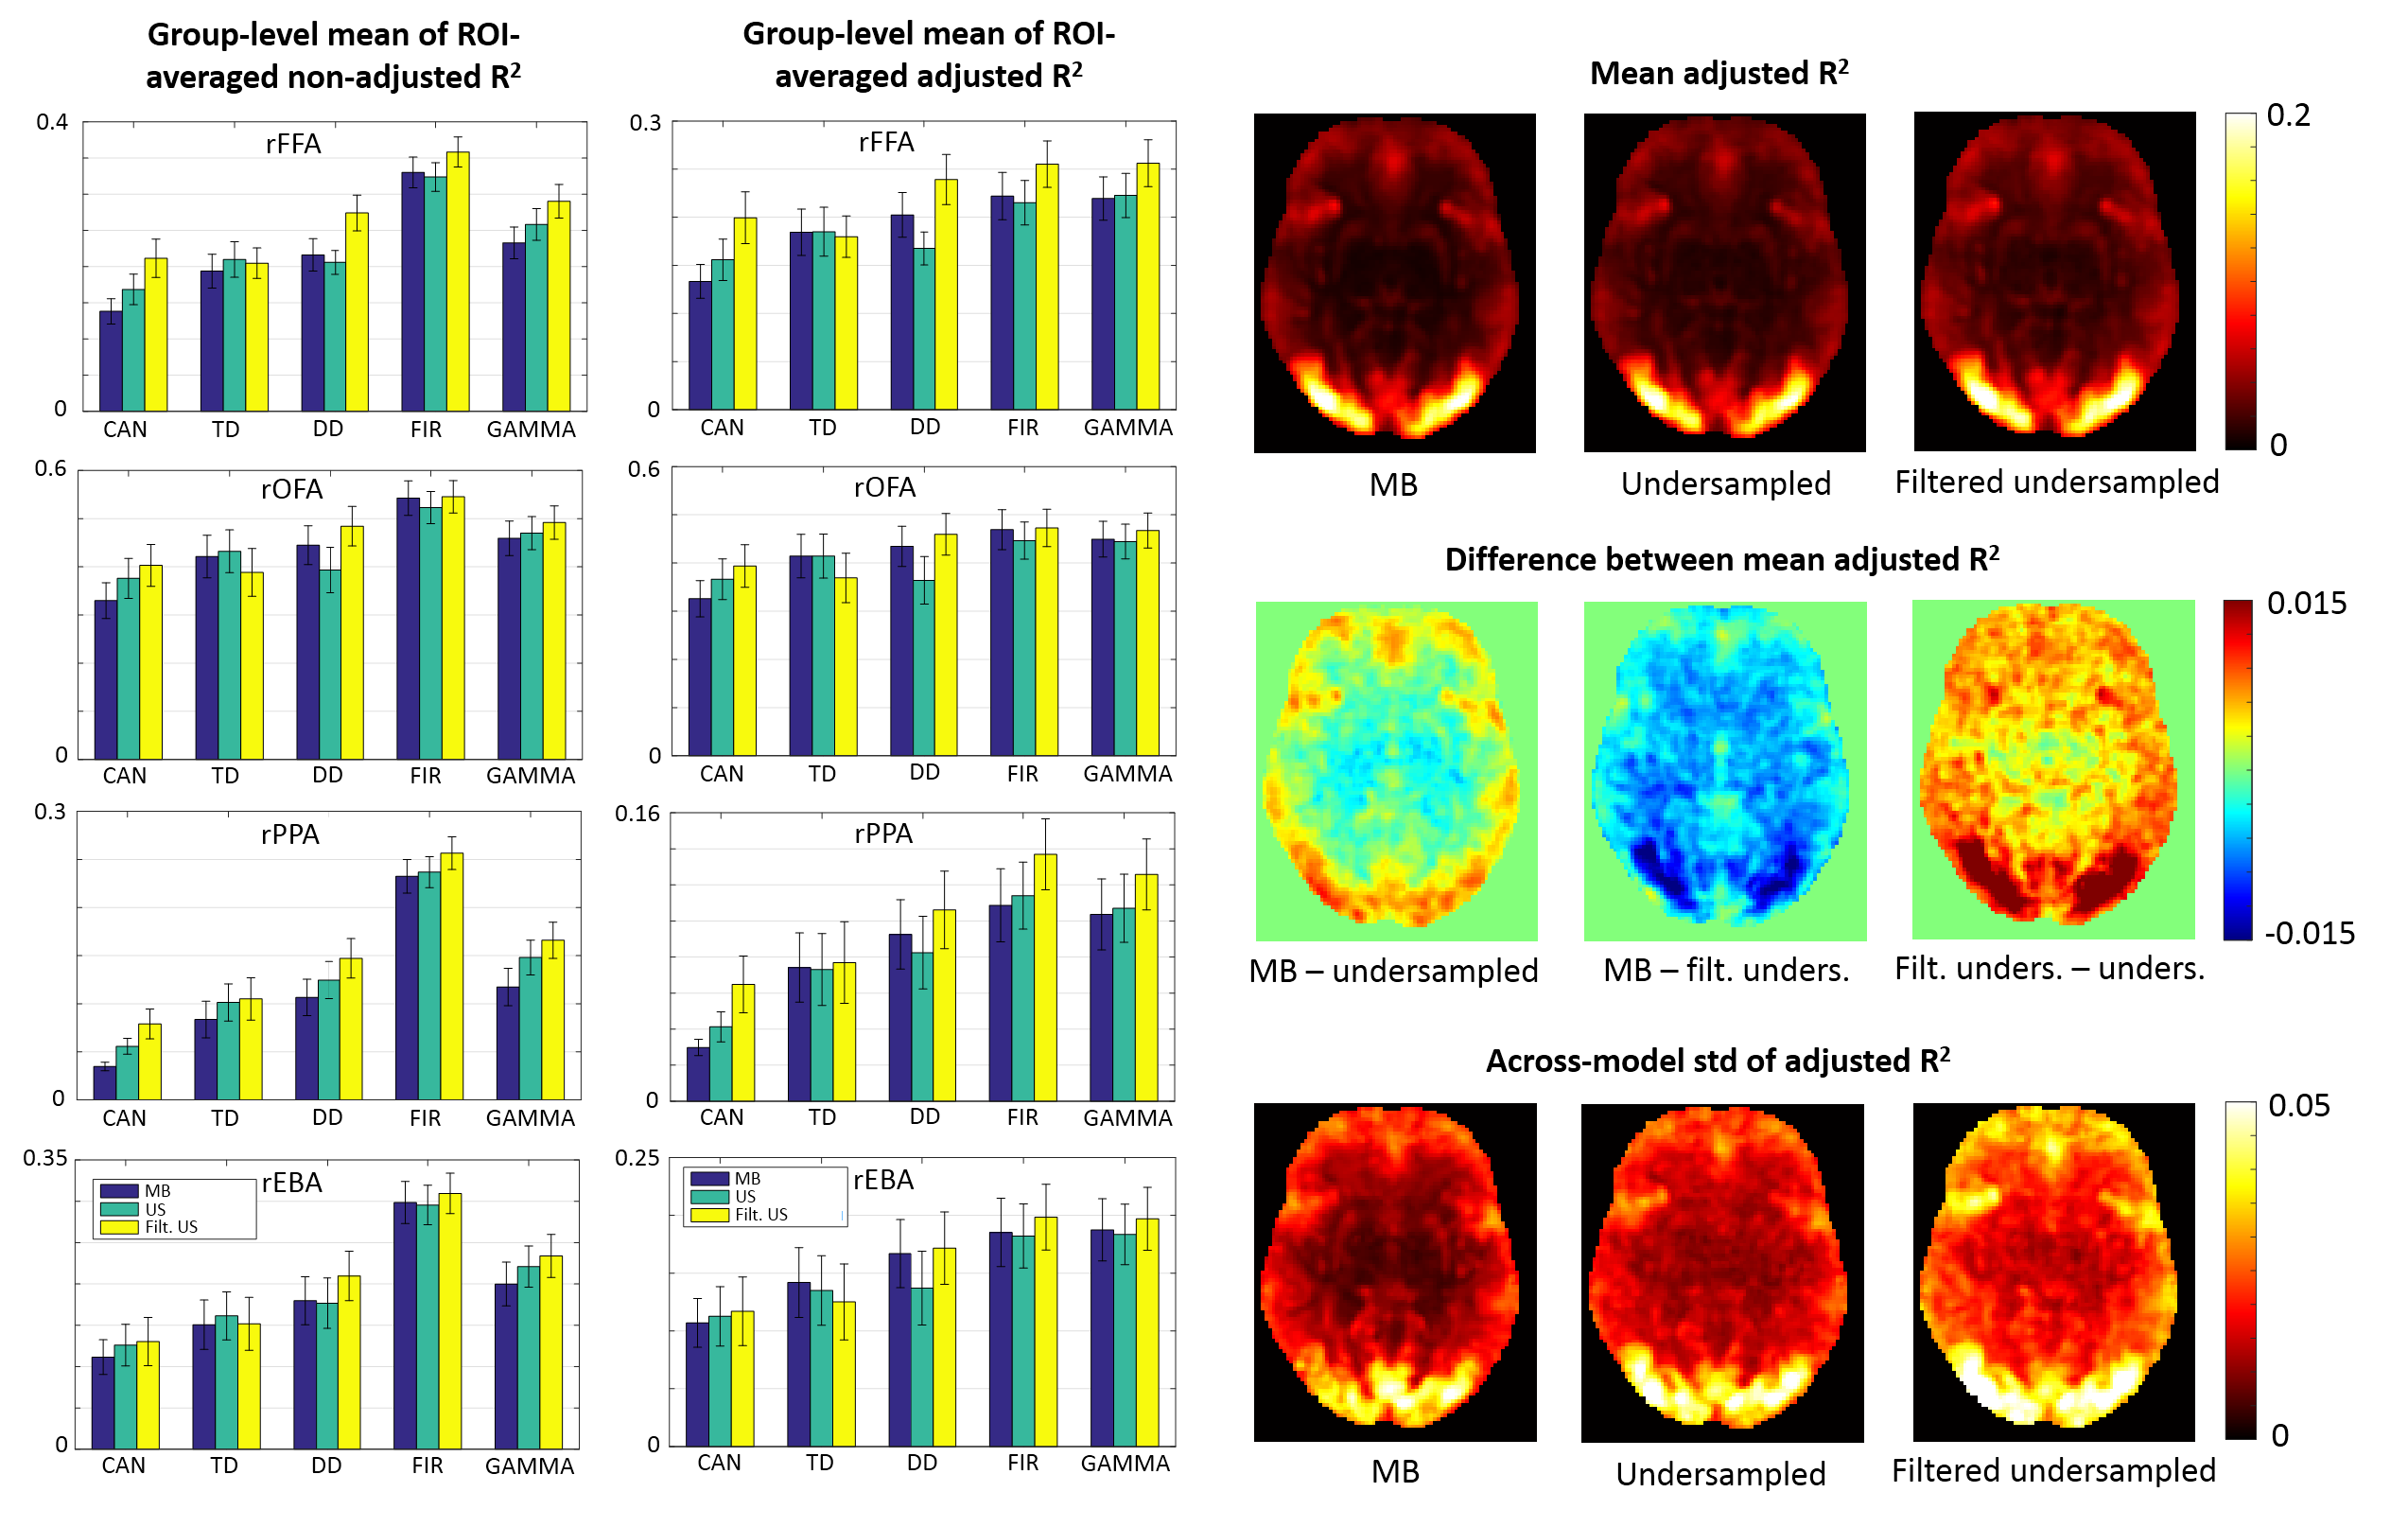
Adjusted and non-adjusted R2 values of the fits were computed as goodness-of-fit measures. Group-level means of ROI-averaged R2 values were calculated, as well as group-level means of the across-model mean and standard deviation (SD) of the adjusted R2.
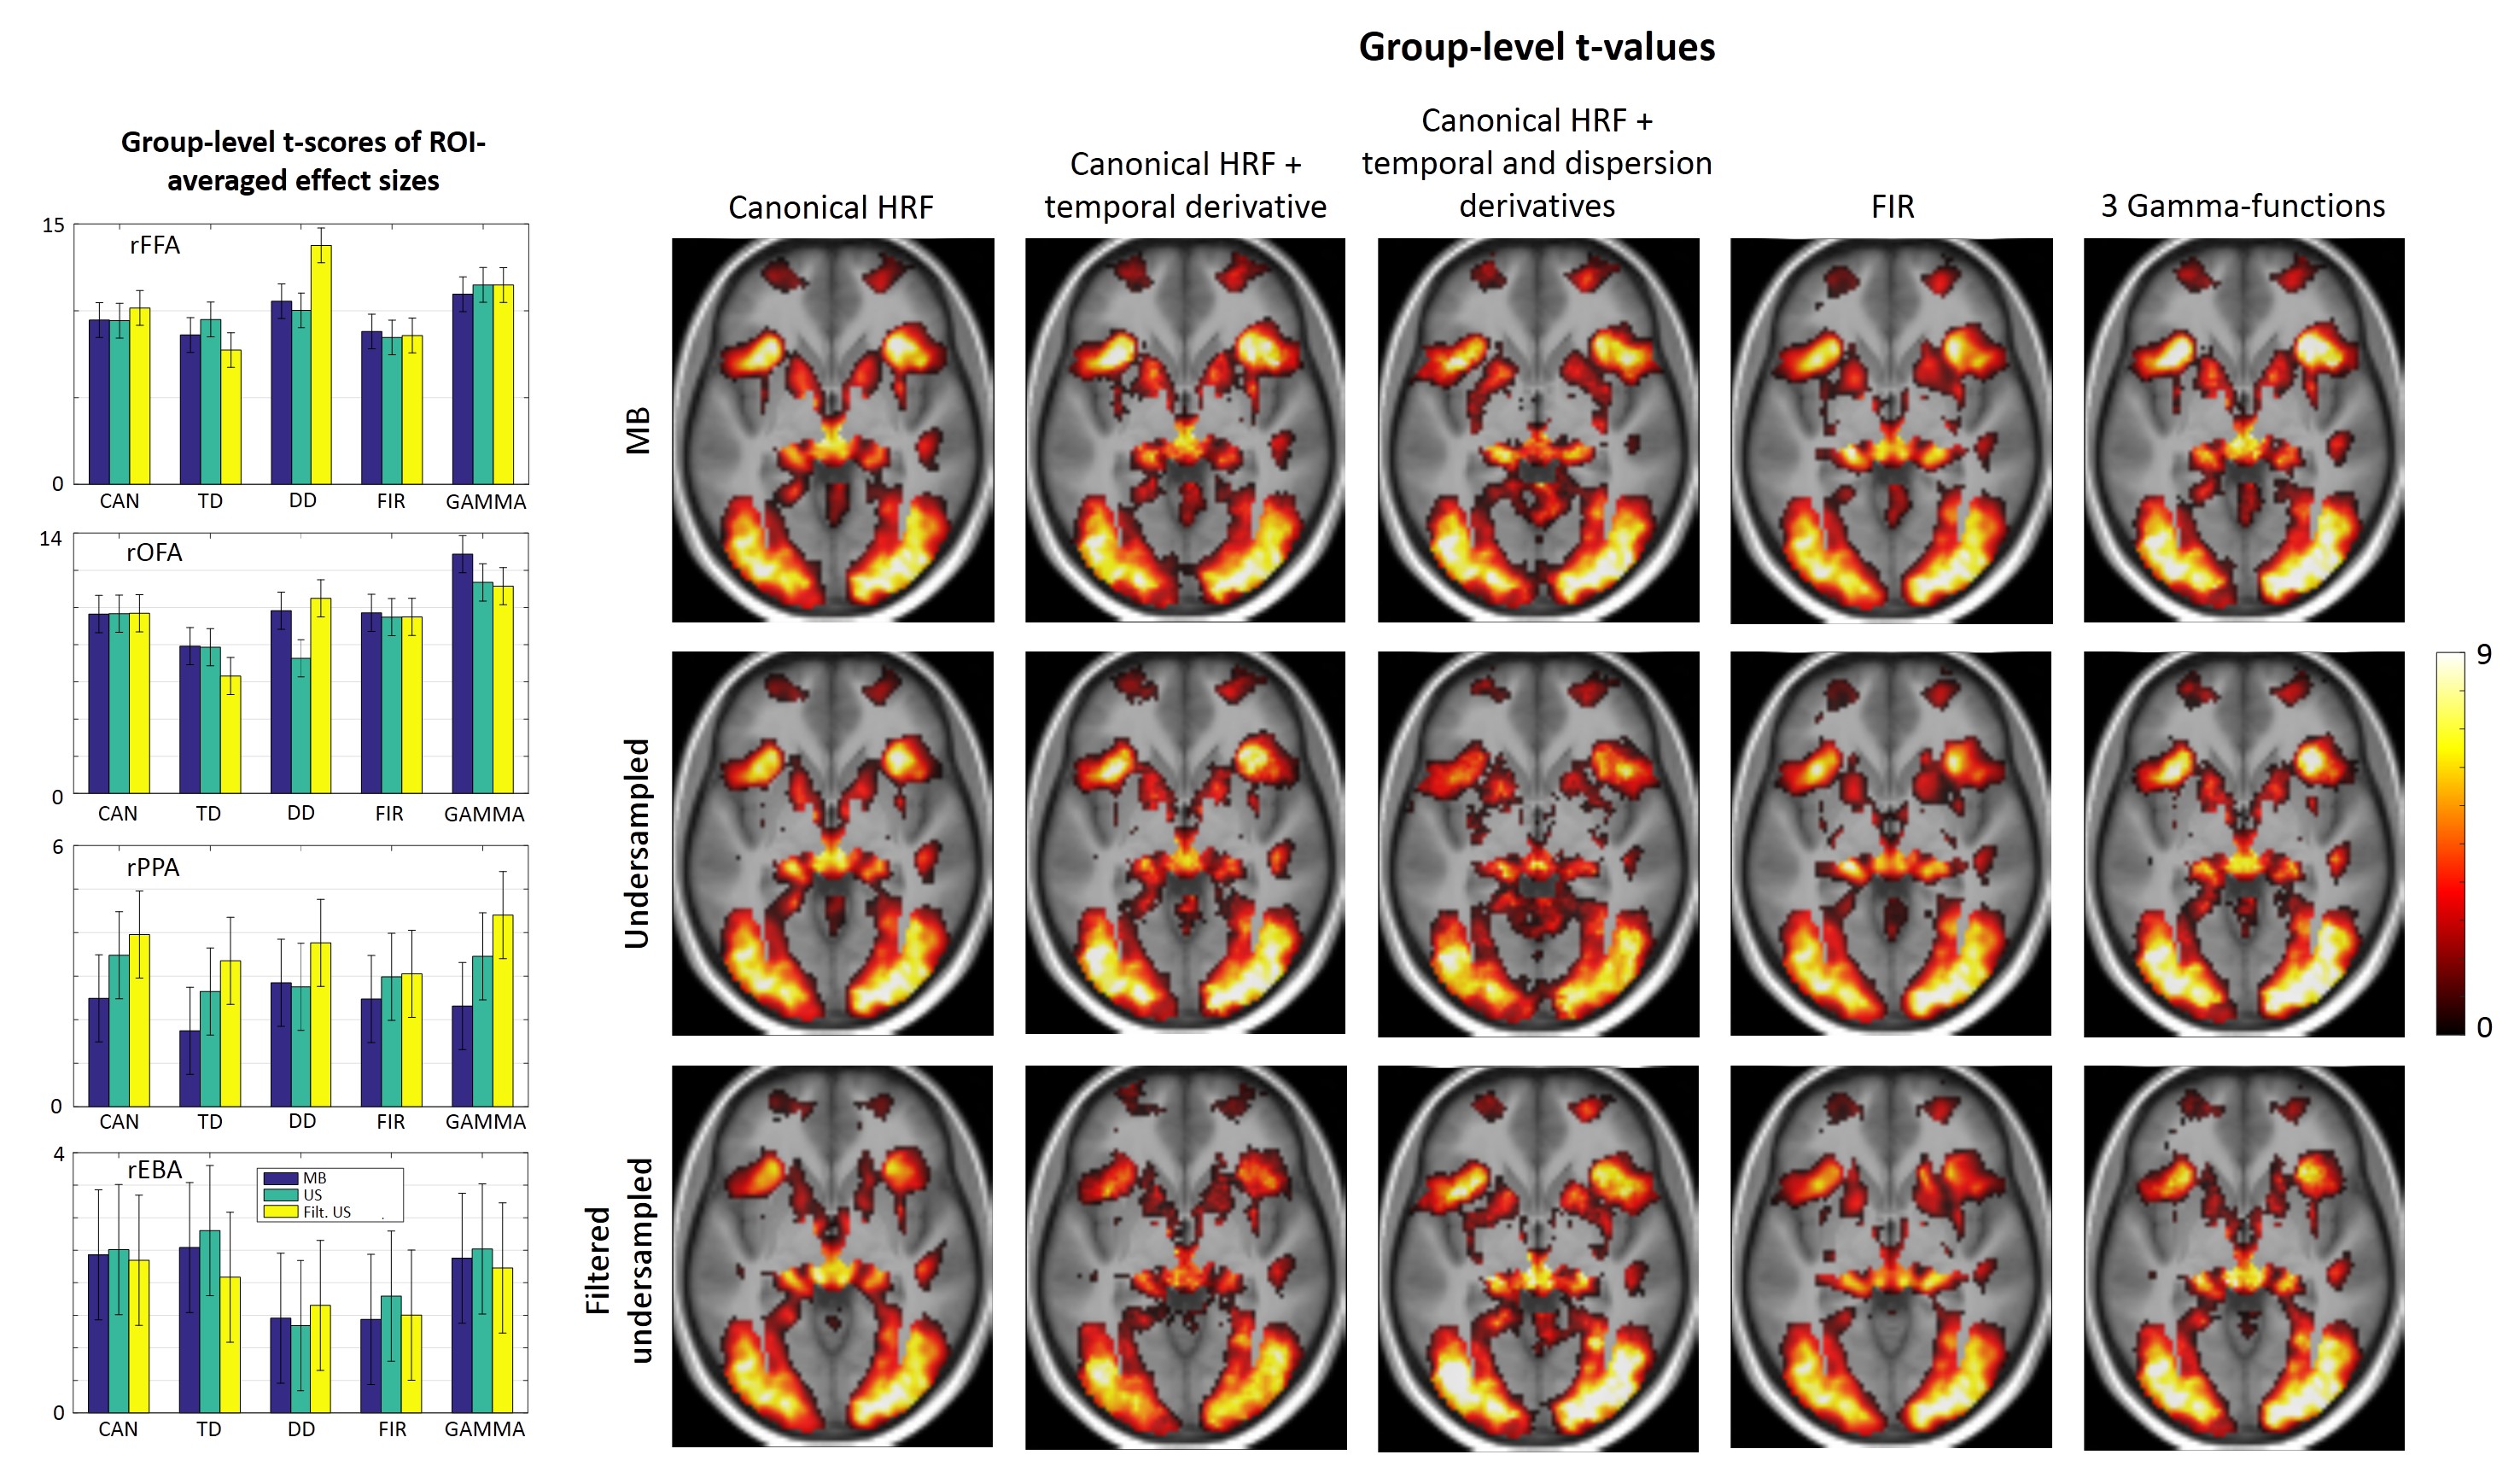
Group-level random-effect analysis was performed on the individual effects, applying a threshold at p<0.001 (uncorrected) on the resulting t-values and extracting the number of grey matter voxels activated beyond this threshold. Group-level analysis was also performed on ROI-averaged effect sizes, using four object-selective regions in the visual cortex determined individually using an independent localizer scan: middle fusiform face area7, occipital face area8, parahippocampal place area9, and extrastriatal body area10.
Results
In most regions the group-level means of ROI-averaged non-adjusted R2 values (Figure_2) show a clear increase for the filtered undersampled dataset, and also a slight increase for the plain undersampling. However, adjusted R2 values, taking into account the degrees-of-freedom, were slightly reduced after undersampling alone. Nevertheless, the SNR improvement provided by a low-pass filter results in increased adjusted R2 values in almost all regions.
This is also supported by the voxel-wise maps, showing that the filtered undersampled dataset outperforms all the others in across-model mean goodness-of-fit. The across-model SD of adjusted R2 shows a similar trend. It is also noteworthy that, regardless of sampling rate, the canonical model and the FIR provide the lowest and the highest goodness-of-fit, respectively. Interestingly, for the canonical HRF model, the undersampled datasets have a better goodness-of-fit in all regions.
Group-level t-values of voxel-wise and ROI-averaged effect sizes (Figure_3) show a region-specific dependency on sampling rate and model type, and an increased across-model variability for the undersampled datasets.
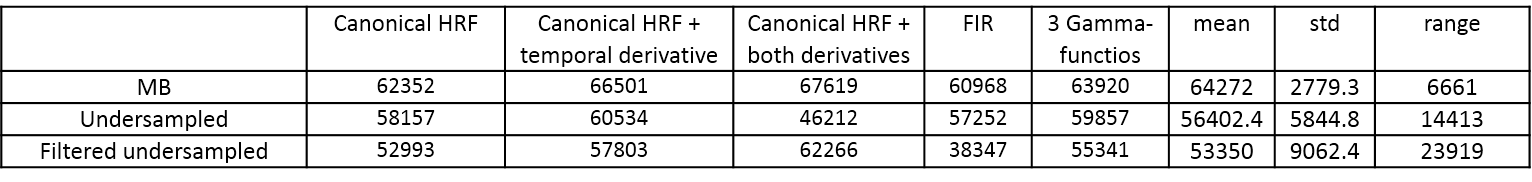
Figure_4 shows that the number of activated voxels is the largest in the high-sampling-rate dataset for all models, and also indicates an increased across-model variability in the undersampled datasets.
Discussion
Here the effect of temporal sampling was tested by numerically undersampling a high-sampling-rate dataset. Because the undersampled time-series has a lower SNR compared to a conventional scan (due to the low TR of the SMS measurement), another dataset was generated with a preceding low-pass filter to approximately compensate this effect.
Non-adjusted R2 values clearly indicate that the larger number of samples of SMS reduces the raw goodness-of-fit, likely due to all HRF models being slightly incorrect; an effect partly overcome by taking into account the degrees-of-freedom. Somewhat counterintuitively, the higher sampling rate decreases the across-model variance compared to both types of undersampling, for both R2 values and group-level t-values.
The increased values of adjusted R2 and group-level t-values in relevant ROIs in the filtered undersampled dataset suggest that such preprocessing of a fast acquisition could increase the sensitivity of the measurement depending on region and model type, and therefore worth being considered in an SMS measurement. We aim to further investigate this by comparing with non-accelerated EPI scans.
Acknowledgements
VD, PH, ZV, and ÁK were supported by the Hungarian Brain Research Program (2017-1.2.1-NKP-2017-00002)References
1. Lindquist MA, Loh JM, Atlas LY, Wager TD. Modeling the Hemodynamic Response Function in fMRI: Efficiency, Bias and Mis-modeling. NeuroImage. 2009;45(1 Suppl):S187–S198.
2. Setsompop K, Gagoski BA, Polimeni JR, Witzel T, Wedeen VJ, Wald LL. Blipped-controlled aliasing in parallel imaging for simultaneous multislice echo planar imaging with reduced g-factor penalty. Magn Reson Med. 2012;67(5):1210–1224.
3. Sternberg S. High-speed scanning in human memory. Science (New York, N.Y.). 1966;153(3736):652–654.
4. Moeller S, Yacoub E, Olman CA, Auerbach E, Strupp J, Harel N, Uğurbil K. Multiband multislice GE-EPI at 7 tesla, with 16-fold acceleration using partial parallel imaging with application to high spatial and temporal whole-brain fMRI. Magn Reson Med. 2010;63(5):1144–1153.
5. Feinberg DA, Moeller S, Smith SM, Auerbach E, Ramanna S, Gunther M, Glasser MF, Miller KL, Ugurbil K, Yacoub E. Multiplexed echo planar imaging for sub-second whole brain FMRI and fast diffusion imaging. PloS One. 2010;5(12):e15710.
6. Xu J, Moeller S, Auerbach EJ, Strupp J, Smith SM, Feinberg DA, Yacoub E, Uğurbil K. Evaluation of slice accelerations using multiband echo planar imaging at 3 T. NeuroImage. 2013;83:991–1001.
7. Kanwisher N, McDermott J, Chun MM. The Fusiform Face Area: A Module in Human Extrastriate Cortex Specialized for Face Perception. Journal of Neuroscience. 1997;17(11):4302–4311.
8. Haxby JV, Hoffman EA, Gobbini MI. The distributed human neural system for face perception. Trends in Cognitive Sciences. 2000;4(6):223–233.
9. Epstein R, Kanwisher N. A cortical representation of the local visual environment. Nature. 1998;392(6676):598–601.
10. Downing PE, Jiang Y, Shuman M, Kanwisher N. A cortical area selective for visual processing of the human body. Science (New York, N.Y.).
Figures