3904
Default mode networks connectivity characterization in young adults with sickle cell disease using 7T resting functional magnetic resonance imaging1Bioengineering, University of Pittsburgh, Pittsburgh, PA, United States, 2Department of Psychiatry, Western Psychiatric Institute and Clinic, University of Pittsburgh, Pittsburgh, PA, United States, 3Pittsburgh Heart, Lung and Blood Vascular Medicine Institute, University of Pittsburgh school of medicine, Pittsburgh, PA, United States, 4Sickle Cell Center of Excellence, University of Pittsburgh school of medicine, Pittsburgh, PA, United States, 5Division of Hematology/Oncology, University of Pittsburgh school of medicine, Pittsburgh, PA, United States, 6Department of Radiology, University of Pittsburgh, Pittsburgh, PA, United States, 7Department of Psychiatry, University of Pittsburgh, Pittsburgh, PA, United States
Synopsis
In this study, we investigated altered resting state default mode network (DMN) connectivity using functional magnetic resonance imaging (rs-fMRI) at 7T in young adults(n=13) with sickle cell disease. The DMN of SCD of young adults had higher connectivity as compared to a healthy controls(n=9 ) gender, age, and racially matched group.
Introduction
Sickle cell disease (SCD) can cause cerebral structure damage and cognitive impairment1,2. The cerebral structural damage can manifest as white matter hyperintensities3 and as microstructural damage4. SCD patients have known cognitive impairment in the absence of structural changes5. This suggests that SCD can alter functional networks, even without overt structural lesions on MRI. In this study, we investigated altered resting state default mode network (DMN) connectivity using functional magnetic resonance imaging (rs-fMRI) at 7T in young adults with SCD.Methods
In this analysis, we included nine healthy controls (HC), (55% females, 26.6 ± 5.3 years) and thirteen patients with SCD (46% females, 26.0 ± 3.0 years). All participants were in steady state SCD and had no previous history of mental illness or drug abuse. This study was approved by the Institutional Review Board of the University of Pittsburgh. We used a 7 T Siemens Magnetom scanner (Erlangen, Germany) with 16TX/32 RX channels (TIC-TAC-TOE)6. Individual T1 (MPRAGE) scans consisted of 256 contiguous axial slices with 0.75 mm isotropic resolution, TR/TE=3 s/2.33 ms, flip angle = 7 °, and TI = 1.2s. We also collected T2-FLAIR to help in excluding patients with WMH which consisted of 80 axial slices, slice spacing of 1.5 mm and slice thickness of 1.5mm, TR/TE = 10.66 s/99ms, flip angle =120°, and TI = 2.9s. Whole-brain rs-fMRI scans with blood-oxygen-level-dependent (BOLD) contrast were acquired using echo planar imaging (EPI) sequence. The echo-planar imaging (EPI) data quality was previously established in terms of its stability and minimal ghosting7,8. Each scan lasted 5.5 min and had the following parameters: 86 interleaved slices with an isotropic resolution of 1.5 mm with 1.5 mm gap; TR/TE = 2.5 s/20 ms; flip angle = 65°, and multiband factor 2. Participants were instructed to keep their eyes open and lie without motion in the scanner. Resting state data were processed using SPM129 (version v7219). Runs were slice-time corrected, realigned to the mean volume, co-registered to the T1 then smoothed with an 8 mm FWHM Gaussian kernel. Then, we applied wavelet despiking10 to filter spike artifacts and regressed out the principal components of white matter and cerebrospinal fluid. We applied temporal second-order Butterworth filter to exclude frequencies outside the 0.008– 0.15 Hz. All participants had an average movement < 0.5 mm in the total acquisition, and no participants had WMH (as determined by visual ratings). DMN connectivity maps were generated using a template-based rotation method (TBR)11. We conducted two-tailed T-tests to compare DMN connectivity between SCD (n=13) and HC (n=9) using SnPM13 ( http://warwick.ac.uk/snpm) and controlled for multiple comparisons using false discovery rate (FDR) of 0.05 and 10000 permutations (minimum cluster size 50 voxels).Results
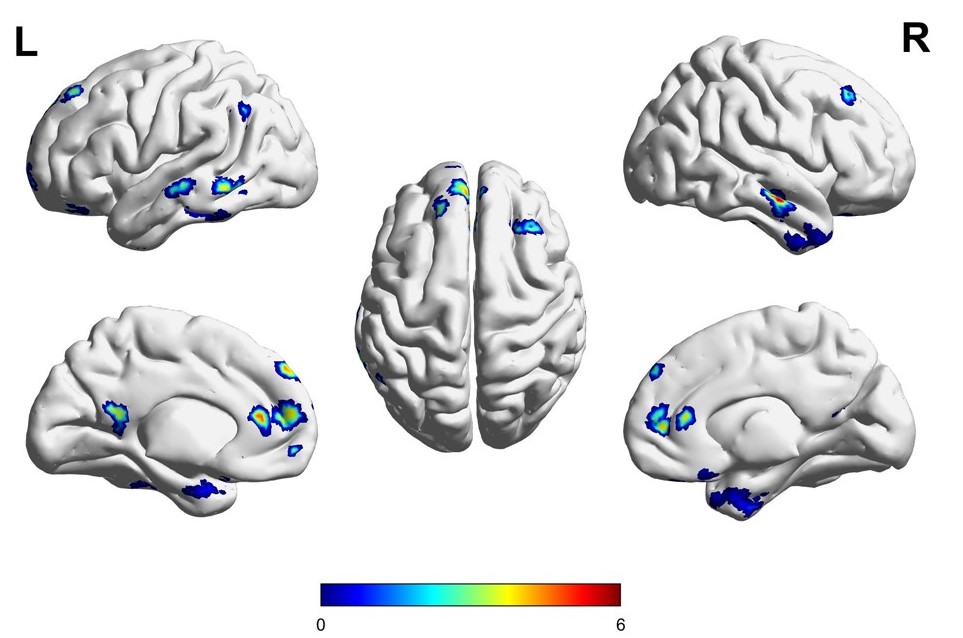
We found that SCD participants had significantly greater DMN connectivity than HC (Figure-1). Figure-1 was generated using Brainnet13. DMN connectivity was significantly higher in SCD group compared to HC in primary areas of the DMN including the medial frontal cortex (MePFC), posterior cingulate (PCC) and the inferior temporal gyrus.Discussion
We have identified altered resting-state connectivity in the absence of significant WMH burden; patients with SCD showed greater DMN connectivity compared to HC. These results replicate a previous study in children with SCD (mean age 8 yrs) that found that youth with SCD and lower cognitive performance had higher DMN connectivity compared to controls12. Altered resting state connectivity is thought to be compensatory and may be a result of altered development or impaired physiological mechanisms. There are several limitations of this work that we are planning to address: the sample size is small and we did not adjust for SCD type, cognitive data are not available, and additional resting state networks need to be investigated.Conclusion
This work showed that there is a difference in the DMN resting state connectivity between HC and SCD in young adults. This difference may explain the impact of SCD on cognitive function.Acknowledgements
We would like to acknowledge the following funding
RO1 HL127107 Neurovascular Determinants of Cognitive Function in Adults with Sickle Cell Disease
R01 MH111265 High Performance Imaging for Assessment of Small Vessel Disease in Older Adults with Depression
References
[1] C. T. Hijmans et al., “Neurocognitive deficits in children with sickle cell disease: A comprehensive profile,” Pediatr. Blood Cancer, 2011.
[2] E. M. Novelli et al., “Brain venular pattern by 7T MRI correlates with memory and haemoglobin in sickle cell anaemia,” Psychiatry Res. - Neuroimaging, vol. 233, no. 1, pp. 18–22, 2015.
[3] T. Baldeweg et al., “Detecting white matter injury in sickle cell disease using voxel-based morphometry,” Ann. Neurol., 2006.
[4] H. Stotesbury et al., “White matter integrity and processing speed in sickle cell anemia,” Neurology, 2018.
[5] B. Sun, R. C. Brown, T. G. Burns, D. Murdaugh, S. Palasis, and R. A. Jones, “Differences in activation and deactivation in children with sickle cell disease compared with demographically matched controls,” Am. J. Neuroradiol., 2017.
[6] T. Ibrahim, Y. Hue, R. Gilbert, and F. Boada, “Tic Tac Toe: Highly-Coupled, Load Insensitive Tx/Rx Array and a Quadrature Coil Without Lumped Capacitors,” Proc. 16th Sci. Meet. Int. Soc. Magn. Reson. Med., vol. Toronto, no. January 2008, p. 438, 2008.
[7] S. Wood et al., “Design and fabrication of a realistic anthropomorphic heterogeneous head phantom for MR purposes,” PLoS One, 2017.
[8] Y. Zhao et al., “Dual optimization method of radiofrequency and quasistatic field simulations for reduction of eddy currents generated on 7T radiofrequency coil shielding,” Magn. Reson. Med., vol. 74, no. 5, pp. 1461–1469, 2015.
[9] K. Friston, “Statistical Parametric Mapping,” in Statistical Parametric Mapping: The Analysis of Functional Brain Images, 2007.
[10] A. X. Patel et al., “A wavelet method for modeling and despiking motion artifacts from resting-state fMRI time series,” Neuroimage, vol. 95, pp. 287–304, 2014.
[11] A. P. Schultz et al., “Template-based rotation: A method for functional connectivity analysis with a priori templates,” Neuroimage, vol. 102, no. P2, pp. 620–636, 2014.
[12] R. Colombatti et al., “Cognition and the default mode network in children with sickle cell disease: A resting-state functional MRI study,” PLoS One, 2016.
[13] Xia, M., Wang, J. & He, Y. BrainNet Viewer: A Network Visualization Tool for Human Brain Connectomics. PLoS One (2013). doi:10.1371/journal.pone.0068910
Figures