3895
The association between functional brain network and functional outcome after acute ischemic stroke1The University of Hong Kong, Hong Kong, Hong Kong, 2Tung Wah Hospital, Hong Kong, Hong Kong, 3Philips Healthcare, HKSAR, China, Hong Kong, Hong Kong
Synopsis
The relation between the functional brain networks and the recovery of acute stroke patients have been investigated. The choice of frequency scale may have major impact on the results of functional connectivity and network analysis. In our study, we acquired resting state data from 11 patients with ischemic stroke and explored longitudinal changes in functional connectivity and brain network measures for various frequency. We also investigated the association between these longitudinal changes and brain functional recovery.
Introduction
Resting-state functional magnetic resonance imaging (rsfMRI) has previously been used to investigate the relation between temporal changes in functional brain networks and motor recovery after stroke1, 2. However, considering that the common frequency range of fMRI signal has a large frequency range (0.008 – 0.15 Hz), it may potentially be insightful to investigate the functional brain network at different frequency scales within this range using wavelet methods. We therefore aimed to investigate the relation between the longitudinal changes of functional brain network at different frequency scales and functional brain recovery after stroke.Methods
Experiments: Resting-state fMRI data of patients with acute ischemic stroke (n=8) were acquired at 1, 3, 6 months after onset using a 3T MRI scanner (Achieva TX, Philips Healthcare, Best, The Netherlands) and the following imaging parameters: GE-EPI, TR/TE/flip angle = 3000/30 ms/90o, FOV = 222 mm, 3.75 mm isotropic (no gap), number of dynamics = 100. The infarct masks manually drawn from the average diffusion-weighted images were used to exclude the corresponding fMRI signals in the subsequent brain connectivity analysis. Motor recovery was assessed using upper extremity Fugl-Meyer (UE-FM) and Barthel Index (BI) at each time point.
Image pre and post-processing: Functional MRI data were preprocessed using the Data Processing Assistant for Resting-State fMRI (DPARSF, http://rfmri.org/DPARSF)3, and were subsequently parcellated into 90 anatomical regions using the Automated Anatomical Labelling (AAL) templates4. The maximal overlap discrete wavelet transform (MODWT) was applied to decompose each individual regional mean fMRI time series into four frequency scales: 1) 0.125 - 0.25Hz, 2) 0.06 - 0.125Hz, 3) 0.03 - 0.06Hz, and 4) 0.01 - 0.03Hz. Brain connectivity analysis was only performed on the functional brain network obtained from scale 2 to 4, consistent with the frequency band (0.01Hz<f<0.08Hz) commonly used in prior studies2.
Brain connectivity analysis: Functional connectomes were estimated using pairwise Pearson correlations of wavelet coefficients from each frequency scale. Connectivity strength, diversity and global integration were measured. Connectivity strength and diversity are the average regional strength and the average of regional diversity across 90 brain regions respectively5. Binary undirected network was subsequently constructed using a proportional threshold6. The following network measures were measured: global brain network - global efficiency, average clustering coefficient, degree distribution (variance, power exponent, degree cut-off), robustness to random or targeted attack and small-worldness; local brain network - degree, clustering coefficient, betweenness centrality and nodal efficiency. All network measures reported in this study are the average of all that obtained from the network over a range of cost 37-50% with 1% increment5.
Statistical analysis: One-way repeated measures ANOVA followed by post hoc comparison, and partial correlation with change in UE-FM and BI were performed using IBM SPSS 20.0 (SPSS Inc., Chicago, IL).
Results
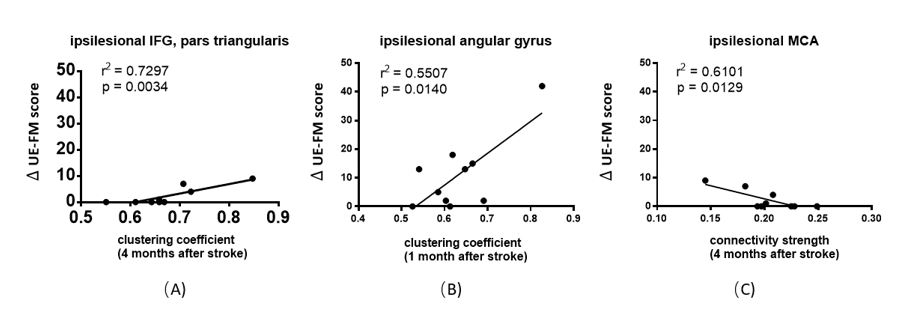
There was no significant difference in the connectivity strength of the global network across different phase after onset (Figure 1). The significant differences of connectivity strength were found in specific cortical nodes and varied across different scales (Figure 2). The key properties in specific cortical nodes showed significant association with the increases of UE-FM (Figure3) and BI scores (Figure 4).Disscussion
Our results showed that the longitudinal changes in functional connectivity and network measures depends on frequency scale (Figure 1 and Figure 2). It is also worth noting that the local brain networks that exhibited significant change in time after stroke differ across different frequency scales (Figure 2). That some of the local brain networks that are associated with brain functional recovery are functional hubs, such as posterior cingulate gyrus, fusiform gyrus, superior parietal gyrus, precuneus, insula, superior frontal gyrus and medial superior frontal7 suggests that the network measures of these hubs may be potential biomarkers for predicting stroke outcome.conclusion
Our study demonstrated that the associations between functional brain network and stroke recovery varies across different frequency scales. More importantly, the network measures of the local brain network of various brain hubs may be potential prognosticator of stroke outcome.Acknowledgements
No acknowledgement found.References
1. Park, C.-h., W.H. Chang, S.H. Ohn, et al. Longitudinal changes of resting-state functional connectivity during motor recovery after stroke. Stroke. 2011; 42(5): 1357-1362.
2. Puig, J., G. Blasco, A. Alberich-Bayarri, et al. Resting-State Functional Connectivity Magnetic Resonance Imaging and Outcome After Acute Stroke. Stroke. 2018: STROKEAHA. 118.021319.
3. Yan, C. and Y. Zang. DPARSF: a MATLAB toolbox for" pipeline" data analysis of resting-state fMRI. Frontiers in systems neuroscience. 2010; 4: 13.
4. Tzourio-Mazoyer, N., B. Landeau, D. Papathanassiou, et al. Automated anatomical labeling of activations in SPM using a macroscopic anatomical parcellation of the MNI MRI single-subject brain. Neuroimage. 2002; 15(1): 273-289.
5. Lynall, M.-E., D.S. Bassett, R. Kerwin, et al. Functional connectivity and brain networks in schizophrenia. Journal of Neuroscience. 2010; 30(28): 9477-9487.
6. van den Heuvel, M.P., S.C. de Lange, A. Zalesky, et al. Proportional thresholding in resting-state fMRI functional connectivity networks and consequences for patient-control connectome studies: Issues and recommendations. Neuroimage. 2017; 152: 437-449.
7. van den Heuvel, M.P. and O. Sporns. Network hubs in the human brain. Trends in cognitive sciences. 2013; 17(12): 683-696.
Figures