3891
Aberrant Functional Connectivity and Network Topology in Parkinson’s Disease Patients with Mild Cognitive Impairment.1Cleveland Clinic Lou Ruvo Center for Brain Health, Las Vegas, NV, United States, 2University of California, San Diego, San Diego, CA, United States, 3Stanford University, Stanford, CA, United States
Synopsis
Studies have shown that cognitive impairment is a frequent non-motor manifestation of Parkinson’s disease (PD), and can already be detected in 15 to 40% of newly-diagnosed PD patients with up to 80% of patients eventually developing dementia. Our results show decreased functional connectivity between regions known to be implicated in high level cognitive functioning in Parkinson’s disease patients with mild cognitive impairment (PD-MCI) , when compared to the cognitively normal PD patients(PD-nMCI). Furthermore, we found altered network topology in PD-MCI compared to the PD-nMCI group that was differentially correlated with neuropsychological measures.
Introduction
In addition to the trademark motor symptoms, cognitive deficits in Parkinson’s disease (PD) patients are common and can be recognized in the early stages in 15%-40% of patients. Additionally, this is a high risk factor for the development of dementia in PD (PD-D)1. In the long term, up to 80% of the patients develop dementia2. Furthermore, the presence of cognitive impairment is also related to a reduction in quality of life and functional disability in PD 3,4. The underlying cause of these cognitive deficits is not well understood. Diagnosis of PD with mild cognitive impairment (PD-MCI), in which the symptoms of cognitive impairment are not sufficient to produce functional impairment, is made based on a clinical assessment. While PD-MCI has been shown to be a risk factor for the development of dementia, not all patients with PD-MCI progress to develop dementia. Therefore, it is important to better understand the neuroanatomical correlates of PD-MCI to further the development of biomarkers that may inform more reliable diagnostic criteria. In the current study we use resting-state functional connectivity and graph theory to determine how the topology of the network is altered in PD –MCI when compared to cognitively normal PD (PD-nMCI) patients.Methods
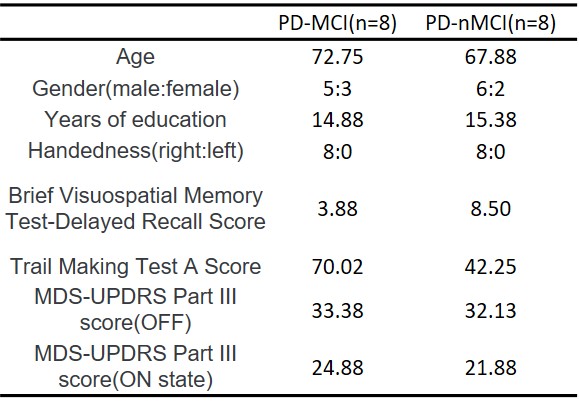
We recruited 32 PD participants at our Center for Neurodegeneration and Translational Neuroscience, Cleveland Clinic Lou Ruvo Center for Brain Health. Based on clinical assessment, 16 participants were identified as PD-MCI. Since the cognitive profile in PD-MCI is heterogeneous, in this study, we only focused on cognitive impairment in PD-MCI with features of cortical and frontal-striatal impairments. Therefore among the 16 PD-MCI participants only those who had deficit in both Trail Making Test A (TMT-A) and Brief Visual Memory Test-Delayed Recall (BVMT) were included in the current study. Both PD groups were matched by age, education, gender, disease duration, and handedness. This criteria yielded 8 PD-MCI and 8 PD-nMCI subjects (see Table 1 for demographics). All participants underwent resting-state functional magnetic resonance imaging (fMRI) and 850 volumes were acquired at a TR of 700 ms on a 3T MRI scanner. All participant data used in this study were obtained in the clinically defined ON state. After standard preprocessing, mean time series were obtained from 102 different ROIs were identified based on the AAL5 and ATAG6 atlases. Average time series were extracted from these regions for all participants. The connectivity between two ROIs was estimated using Pearson’s correlation between their averaged time-series, and subsequently a connectivity matrix (102 x 102) was obtained for each subject. Various graph-theoretical properties were computed using GRETNA or in-house MATLAB scripts. Network-based statistic (NBS)7 was used to perform nonparametric statistical tests to identify whether there was a difference in functional connectivity between PD-nMCI and PD-MCI. NBS performs permutation testing using unpaired t-tests with 5000 permutations. A test statistic was then computed for each connection, and a threshold of t=3.1 7 was applied to identify a set of suprathreshold connections which showed significant differences in functional connectivity between the groups. Nonparametric statistical analyses of group differences between global and local network properties and their association with neuropsychological measures were then conducted using the permutation analysis of linear models (PALM) toolbox in FSL 8. All statistical measures were considered significant either at family-wise error corrected p<0.05 or at uncorrected p<0.001.Results
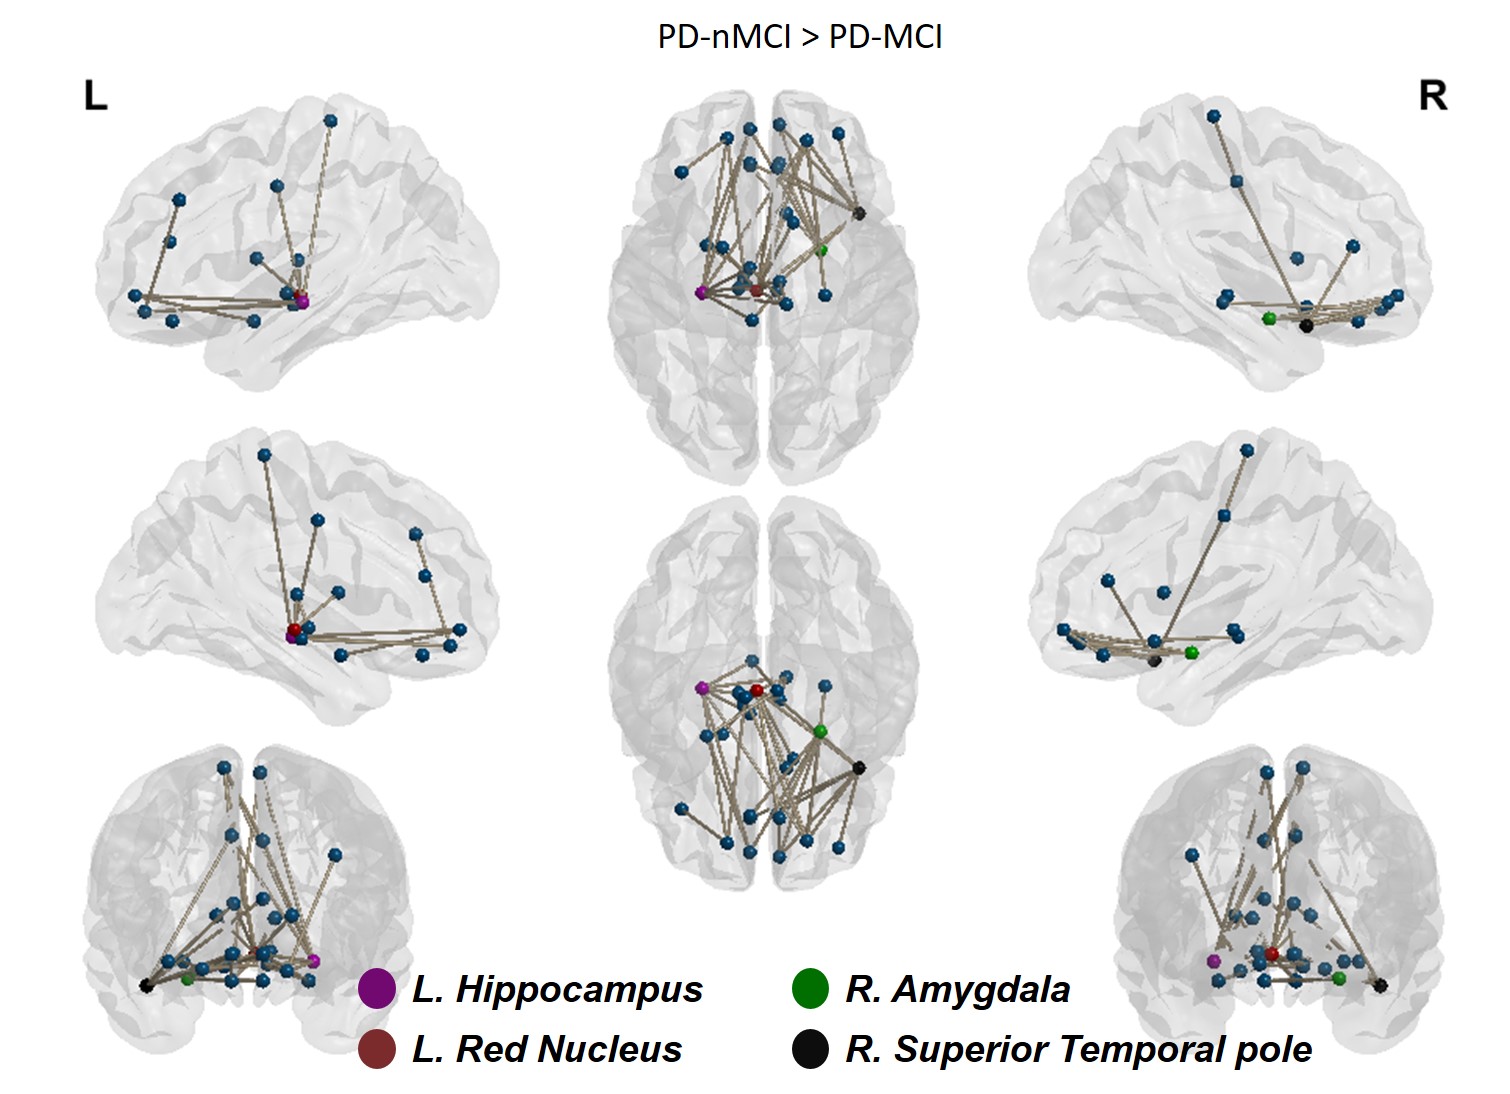
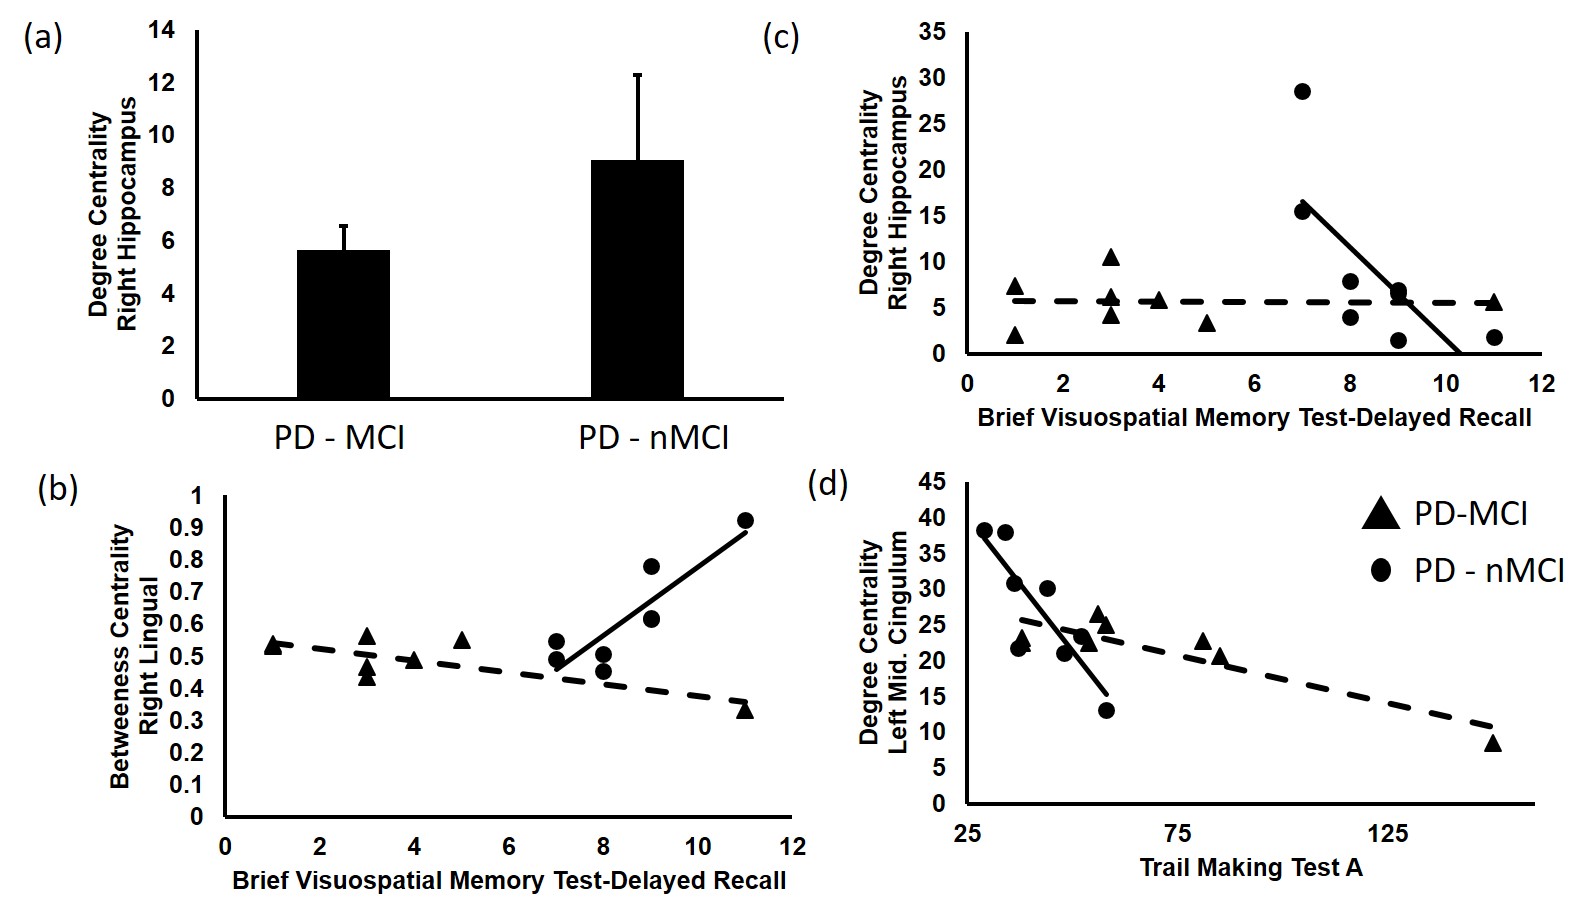
Fig.1 shows a set of connections in PD-nMCI group comparing with PD-MCI, primarily comprising the amygdala, hippocampus, superior temporal pole, red nucleus and few other regions. Results were visualized with the BrainNet Viewer (http://www.nitrc.org/projects/bnv/)9. No paths were significantly greater in the PD-MCI. The evaluation of the local network properties revealed significantly lower degree centrality of the right hippocampus (Fig. 2a) in the PD-MCI group when compared to controls. Nodal properties for the PD group was associated with different behavioral scores. In the PD-nMCI the betweeness-centrality of the right lingual gyrus and the degree centrality of right hippocampus was positively associated and negatively associated with the BVMT score, respectively (Fig. 2b and 2c). The degree centrality of the middle cingulum in the PD-nMCI was negatively associated with the Trail making A score (Fig. 2d).Discussion and Conclusion
The current study revealed altered functional connectivity and topological properties of networks in PD-MCI compared to PD-nMCI. Our results show decreased functional connectivity in the PD-MCI group between regions involved in higher level cognitive functioning. Furthermore, the PD-MCI group showed altered topological properties when compared to the PD group. These observations point to altered network topology that correlated with neuropsychological measures in PD-MCI and PD-nMCI groups.Acknowledgements
This work was supported by an Institutional Development Award (IDeA) from the National Institute of General Medical Sciences of the National Institutes of Health under grant number 5P20GM109025, and private grant funds from Peter and Angela Dal Pezzo.References
1) Yarnall AJ, Breen DP, Duncan GWet. Al. (2014):Characterizing mild cognitive impairment in incident Parkin-son disease: The ICICLE-PD study. Neurology 82:308–316.
2) Hely MA, Reid WG, Adena MA, Halliday GM, Morris JG (2008):The Sydney multicenter study of Parkinson’s disease: Theinevitability of dementia at 20 years. Mov Disord 23:837–844.
3) Lawson RA, Yarnall AJ, Duncan GW, et. al. (2014): Severity of mildcognitive impairment in early Parkinson’s disease contributesto poorer quality of life. Parkinsonism Relat Disord 20:1071–1075.
4) Yarnall AJ, Rochester L, Burn DJ (2013): Mild cognitive impair-ment in Parkinson’s disease. Age Ageing 42:567–576.
5) Tzourio-Mazoyer N, Landeau B, Papathanassiou D, Crivello F, Etard O, Delcroix N, et al. Automated anatomical labeling of activations in SPM using a macroscopic anatomical parcellation of the MNI MRI single-subject brain. Neuroimage 2002; 15: 273–289.
6) Keuken MC, Bazin P-L, Crown L, Hootsmans J, Laufer A, Muller-Axt C, et al. Quantifying inter-individual anatomical variability in the subcortex using 7 T structural MRI. Neuroimage 2014; 94: 40–46.
7) Zalesky A, Fornito A, Bullmore ET. Network-based statistic: identifying differences in brain networks. Neuroimage 2010; 53: 1197–1207.
8) Winkler AM, Ridgway GR, Webster MA, Smith SM, Nichols TE. Permutation inference for the general linear model. Neuroimage 2014; 92: 381–397.
9) Xia M, Wang J, He Y (2013) BrainNet Viewer: A Network Visualization Tool for Human Brain Connectomics. PLoS ONE 8(7): e68910. doi:10.1371/journal.pone.0068910.
Figures