3889
Olfactory Network Functional Connectivity with the Hippocampus in Alzheimer’s Disease1Radiology, Penn State University, Hershey, PA, United States, 2Neurology, Penn State University, Hershey, PA, United States
Synopsis
The rhinencephalic brain regions are specifically vulnerable to AD pathology. This suggests that olfactory assessment may be able to serve as a measure of AD progression. In this research, we investigated the functional connectivity (FC) between the olfactory network (ON) and the hippocampus as a sensitive marker to detect progressive AD pathophysiology. The results show that the ON FC is able to differentiate between early mild cognitive impairment (MCI) and late MCI subjects. As such, ON FC may provide critical insights into relationships between olfactory, memory and, other cognitive deficits in AD.
Introduction
The olfactory and memory-related brain regions are selectively vulnerable in Alzheimer’s disease (AD). Longitudinal studies of AD patients have indicated that olfactory deficits are related to the severity of dementia [1-4]. Thus, the connectivity between the olfactory network (ON) and the hippocampus may play an important role in AD pathophysiology. Currently, very few studies have been conducted to investigate AD-related olfactory deficits from a network perspective. This is important because AD is a neural network-based degeneration where neuropathology spreads and disrupts across networks. Here, we explored the resting state functional connectivity (FC) of the ON in subjects who were aged-matched cognitively normal (CN), early mild cognitive impairment (EMCI), late MCI (LMCI) and AD to systematically investigate its potential as an indicator of AD neurodegeneration. Given that most task-related brain networks are recapitulated during resting state, characterizing resting-state ON FC could plausibly provide an early imaging biomarker for AD [5].
Methods
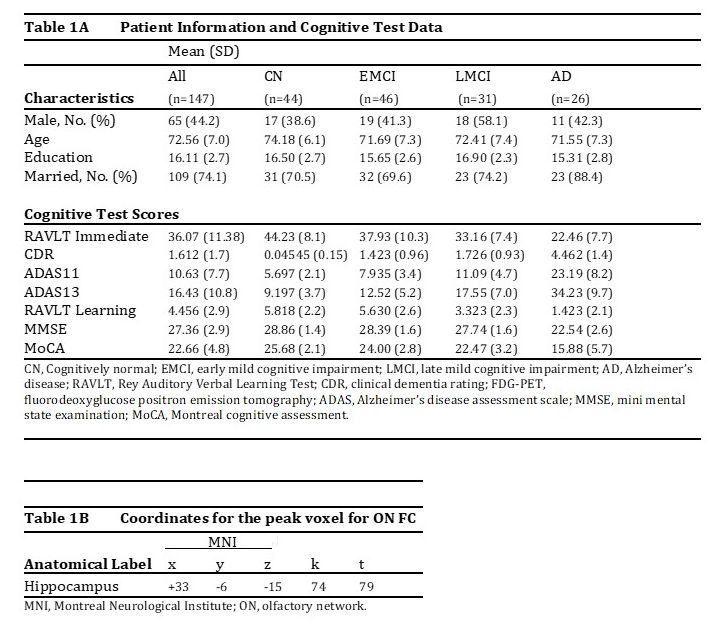
We analyzed resting state data from one hundred forty seven (147) subjects from the Alzheimer's disease neuroimaging initiative (ADNI: at http://www.adni-info.org/). The rs-fMRI data was processed using the toolbox for Data Processing & Analysis of Brain Imaging (DPABI, http://rfmri.org/DPABI) [6]. Slice timing correction, head motion correction, and spatial normalization to the standard Montreal Neurological Institute (MNI) EPI template, with a resolution of 3 × 3 × 3 mm3, were performed. We only included subjects whose head movement was less than 3 mm translation (in any direction) or 3° angular rotation (in any axis) during fMRI scanning. Data was also detrended and band-pass filtered (0.01–0.08 Hz). We used a seed based functional connectivity (FC) analysis, described in Tobia et al., 2016, to identify differences in ON FC [7]. Briefly, seed time courses were extracted from rs-fMRI data as the average time course within an ROI (five-voxel radius) centered on coordinates obtained from a meta-analysis that identified six regions most likely to be activated by olfactory stimulation [8] ( piriform cortex [(−22 0 −14) (22 2 −12)], OFC [(− 24 30 − 10) (28 34 − 12)] and the Insula [(-30 18 6), (28 16 8)]). Functional connectivity maps were calculated that survived a threshold of p < 0.01 with a minimum cluster size (k) of 60 voxels. Exploratory correlation analysis between ON FC and cognitive test scores (RAVLT Immediate & Learning, ADAS11, ADAS13, CDR, MMSE, and MoCA) were also conducted.
Results
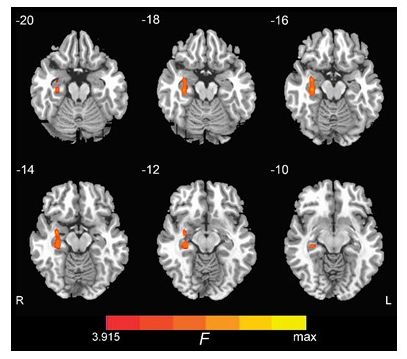
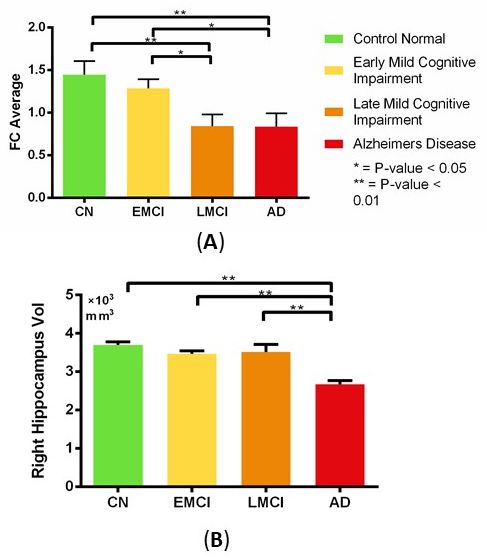
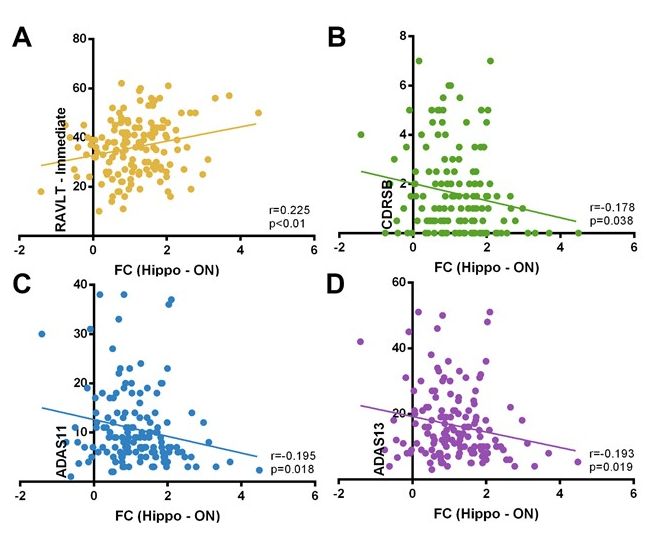
Figure 1 shows differences in ON FC among the CN, EMCI, LMCI and AD groups in the right hippocampus. An ROI analysis of hippocampal FC is shown in Figure 2A. Of note, the ON FC is significantly different between EMCI and LMCI groups. No significant differences in hippocampal volume were observed between the EMCI and LMCI (Figure 2B). Lastly, ON hippocampal FC values are significantly correlated with cognitive test scores likely reflecting the progression of AD (Figure 3).
Discussion
AD pathology in the ON offers a unique opportunity to investigate direct and specific effects of local neurodegeneration to network disruption and to functional deficits in AD. The research provides a basis to answer two fundamental questions about AD neurodegeneration: 1) how are prominent olfactory deficits in AD related to neurodegeneration in the ON and hippocampus?, and 2) do olfactory deficits signal progressive disruptions to the ON and its connectivity to the hippocampus. Since ON FC is correlated with several cognitive scores, changes in FC could indicate disruption of normal cognition that may lead to memory decline in AD. Unlike volumetric measurements, FC changes were able to differentiate EMCI from LMCI indicating that ON FC may be associated with a series of neuronal impairments in AD. As such, resting state ON FC should be further investigated to evaluate its usefulness as a possible diagnostic tool or biomarker capable of identifying AD patients who are at risk for developing dementia. Future studies aimed at validating the current findings and longitudinal investigation of the functional integrity of the ON FC will provide further insights into the relationship between olfactory and cognitive deficits in AD.
Acknowledgements
The study was supported by the Leader Family Foundation,a grant from the U.S. National Institute of Aging (R01-AG027771) and the Department of Radiology, Penn State College of Medicine. The authors report no conflict of interest.References
[1]. Waldton S., (1974). Clinical observations of impaired cranial nerve function in senile dementia. JAPS;50(5):539-547.
[2]. Ferreyra-Moyano, H., et al., (1989). The olfactory system and Alzheimer's disease. Int J Neurosci.;49(3-4):157-197.
[3]. Knupfer, L., et al., (1986). Differences in olfactory test performance between normal aged, Alzheimer and vascular type dementia individuals. IJoGP;1(1):3-14.
[4]. Murphy, C., et al., (1990). Olfactory thresholds are associated with degree of dementia in Alzheimer's disease. Neurobiol Aging;11(4):465-469.
[5]. Deco, G., et al., (2011). The dynamical balance of the brain at rest. Neuroscientist, vol 1, pp 107-23, doi: 10.1177/1073858409354384.
[6]. Yan, C.G., et al., (2016). DPABI: Data Processing & Analysis for (Resting-State) Brain Imaging. Neuroinformatics;14(3):339-51.
[7]. Tobia, M.J., et al., (2016). Intrinsic intranasal chemosensory brain networks shown by resting-state functional MRI. NeuroReport, 27(7), 527-531.
[8]. Seubert, J., et al., (2013). Statistical localization of human olfactory cortex. Neuroimage; 66:333–342.
Figures