3886
Altered functional connectivity manifested by disrupted network modularity in chronic stroke patients1Florey Institute of Neuroscience and Mental Health, Heidelberg, Australia, 2Florey Department of Neuroscience and Mental Health, The University of Melbourne, Heidelberg, Australia, 3College of Science, Health and Engineering, La Trobe University, Melbourne, Australia
Synopsis
Recent studies have shown that brain connectivity analyses offer valuable information in quantifying network alterations after stroke , which could further enhance our understanding the mechanism of stroke recovery. Given the issue of heterogeneous lesion locations, a recent approach, GMGLASS, is employed to alleviate this issue due to its capability in conducting group comparison studies despite large inter-subject variability. Furthermore, while previous studies have shown that homotopic connections are disrupted due to stroke lesions, how lesion laterality disrupts brain networks, especially at modular level, is not known yet. In this study, we quantified the whole-brain functional connectivity differences using network analysis methods; furthermore, we investigated disruption of homotopic connections at network modular level.
Introduction
Recent studies have shown that functional connectivity analyses offer new insights in quantifying alterations in brain networks after stroke 1, further enhancing our understanding the mechanism of stroke recovery. However, due to heterogeneous lesion locations there are few studies focusing on group-level differences of whole-brain functional connectivity. A recent group-fused sparse correlation approach, GMGLASS 2, was shown to be able to conduct group comparison studies despite large inter-subject variability. Furthermore, while previous studies have shown that homotopic connections are disrupted due to stroke lesions 3, it is not yet known how side of lesion disrupts brain networks, especially at a modular level. In this study, GMGLASS enables us to compare groups of heterogeneous stroke patients and healthy controls. Specifically, we aim to: (1) quantify the whole-brain functional connectivity differences following stroke using network analysis methods; (2) investigate disruption of homotopic connections at network modular level.Methods
MRI data acquisition: MRI data were acquired using a 3T Siemens Trio scanner as follows (n=57; chronic stroke patients with either left hemisphere lesions [LHL=19] or right hemisphere lesions [RHL=19], as well as 19 healthy controls [HC]): (1) T1 anatomical image; (2) Resting-state fMRI data: TR/TE=3000/30ms, 3mm isotropic, 72×72 matrix, 44 slices, 140 volumes; (3) T2 FLAIR.
Post-stroke lesions: For each stroke patient, a lesion mask was manually delineated on axial FLAIR images. Further statistical analysis of lesion lateralization was conducted.
Data analysis: Standard fMRI pre-processing steps were taken for both patients and HC, except that stroke data were normalized using clinical-toolbox (http://www.mricro.com/clinical-toolbox). Independent component analysis was applied to the pre-processed fMRI data to remove artefact-related components using FSL’s MELODIC toolbox.
Estimating networks using GMGLASS: Ninety-region anatomical automatic labelling (AAL) template was employed to calculate region-wise time-series. Time-series were divided into 10-timepoint consecutive and non-overlapping blocks to account for autocorrelation effects 2. A random subsampling was applied to obtain data with half number of time points (140/2=70). GMGLASS was applied to 2 group comparisons: stroke patients with either LHL or RHL vs. HC, with which network edges with sufficiently high probability are chosen at individual-level 2.
Network analysis and statistical tests: Network analysis was conducted with the Brain Connectivity Toolbox. The following analyses were conducted:
(1) Network disruption on global network metrics: Firstly, four key network metrics were computed: local efficiency (LE), global efficiency (GE), network density (DEN), and clustering coefficient (CC). Secondly, two-sample t-tests were applied to these network metrics for calculating statistical significance (α=0.05 with Bonferroni correction).
(2) Network disruption on homotopic regions: Firstly, two network centrality metrics, degree- and eigenvector-centrality, were computed region-wise for each subject. Secondly, two-sample t-tests were applied to test the significance of all 45 homotopic pairs (α=0.05). Subsequently, network disruptions were evaluated across subnetworks (or modules) in terms of homotopic disruptions, where the network modules were extracted from 133 HCP normal subjects 4. A network module is considered as disrupted only when all regions within a module are significantly disrupted.
Results
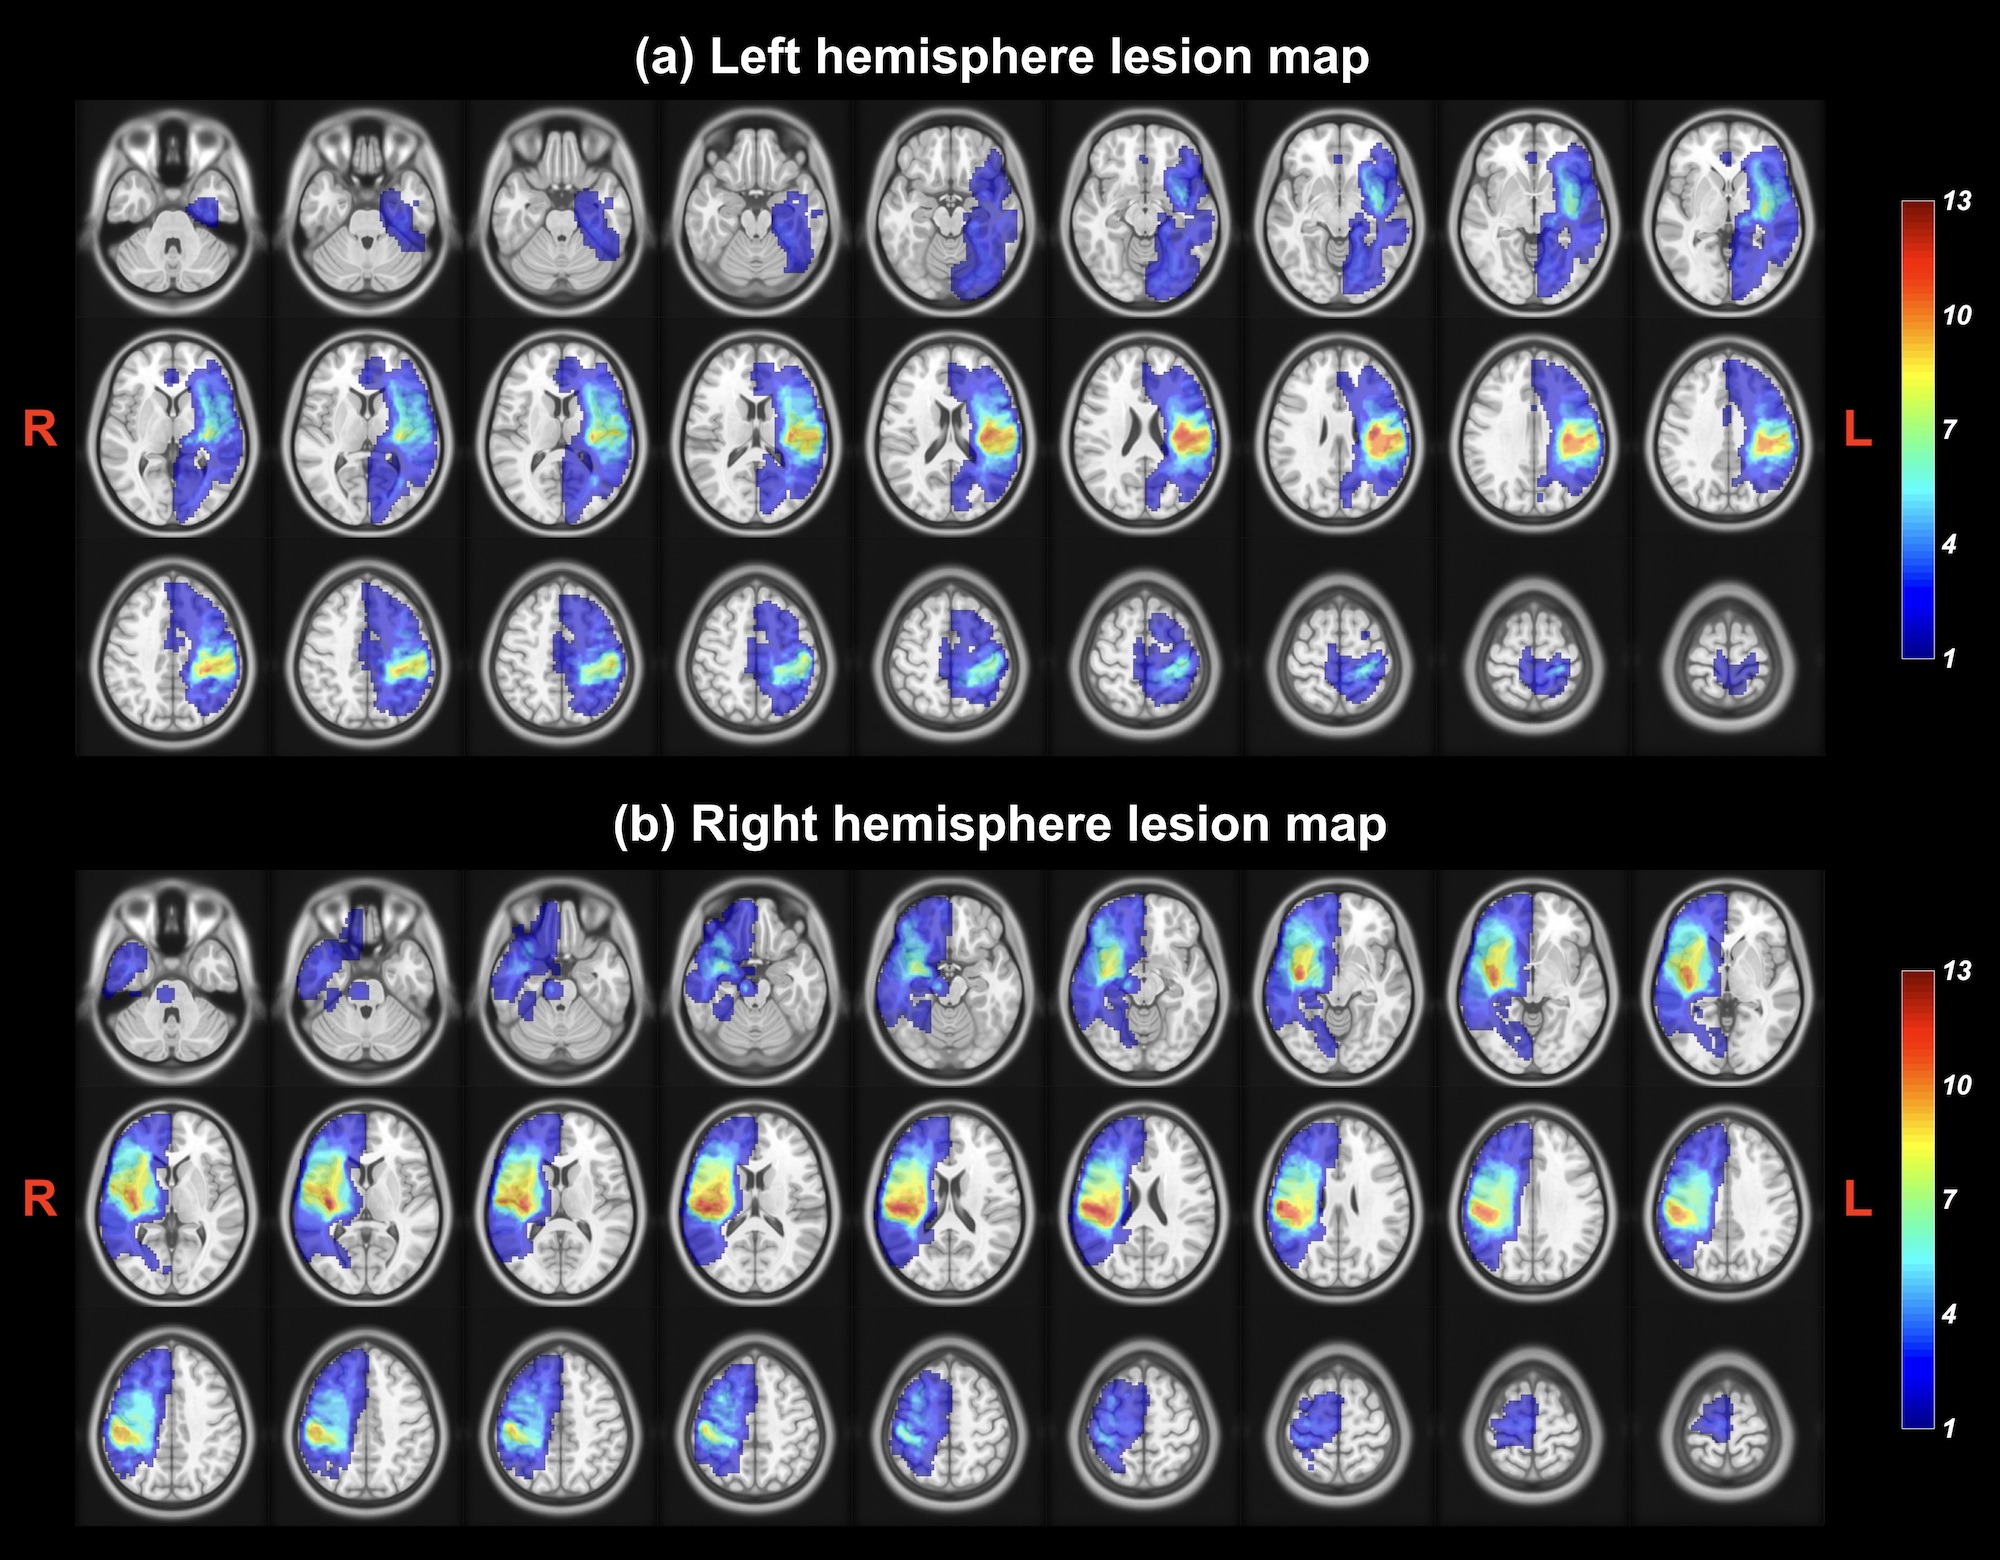
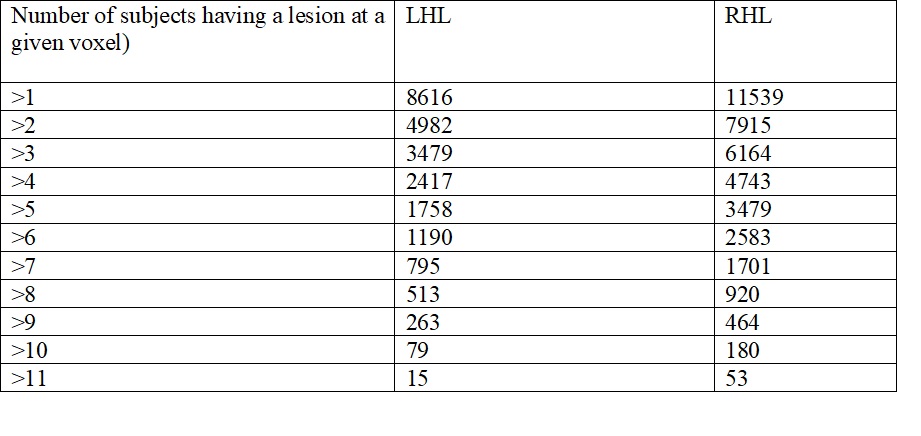
Figure 1 shows overlap of stroke lesions in LHL- and RHL-cohorts. Lesion volumes were calculated with a range of thresholds for LHL- and RHL-cohorts (Table 1). Subsequent paired t-tests reveal that significantly larger lesions in RHL- than that in LH-cohort.
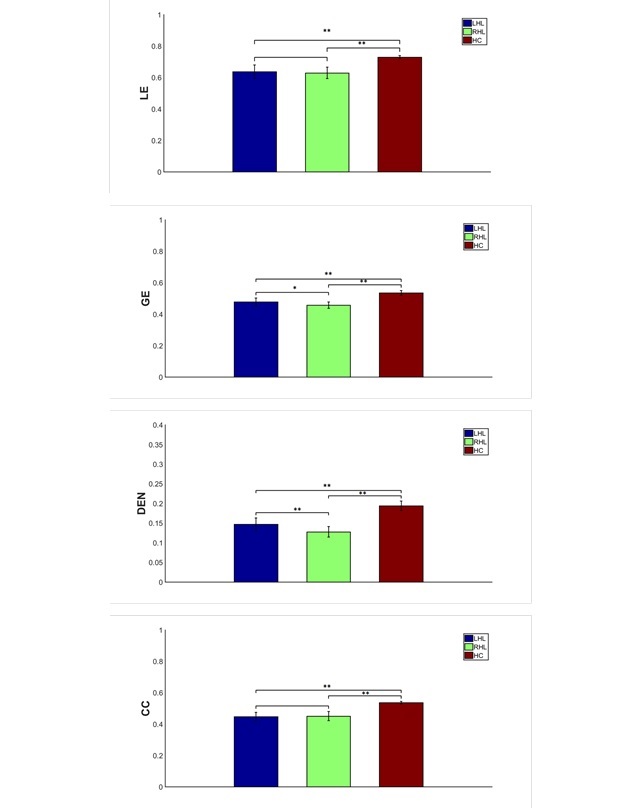
Figure 2 shows that significantly reduced values of all those network metrics, i.e. LE, GE, DEN, CC, were detected from both LHL- and RHL- vs. HC-cohorts. Furthermore, RHL-cohort shows significantly reduced values of GE and DEN compared to LHL-cohort.
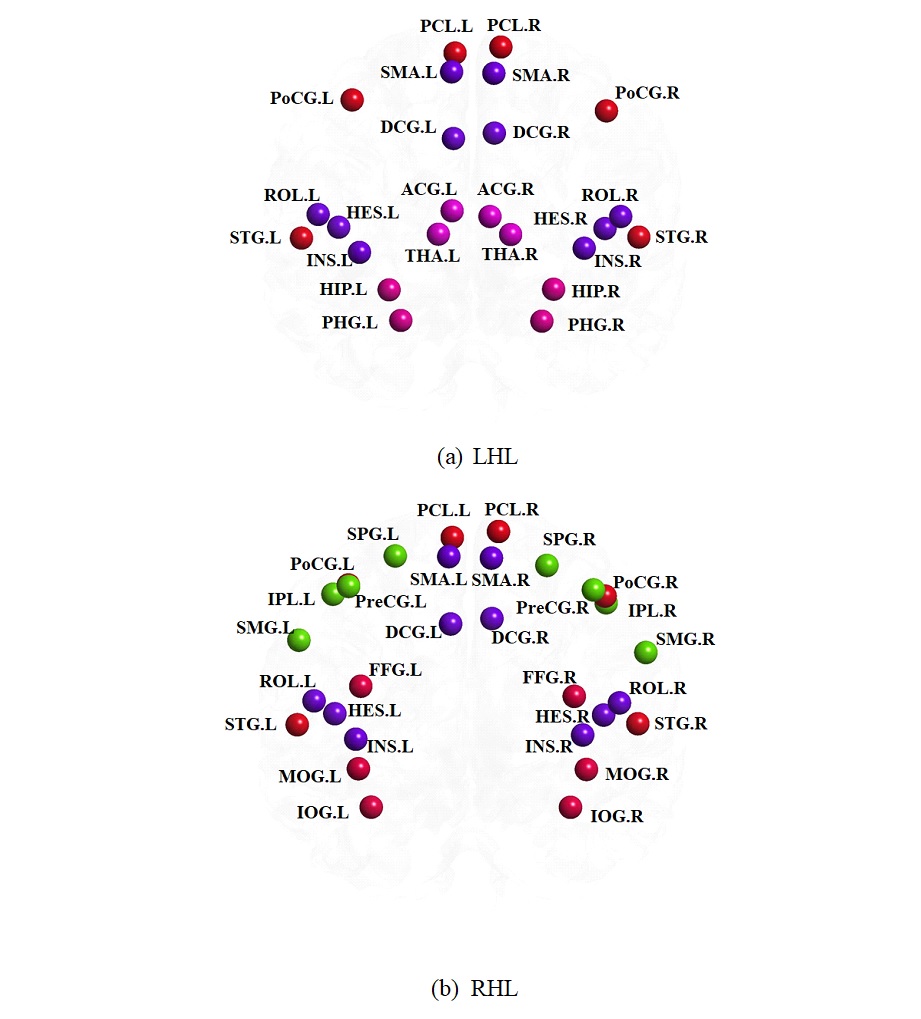
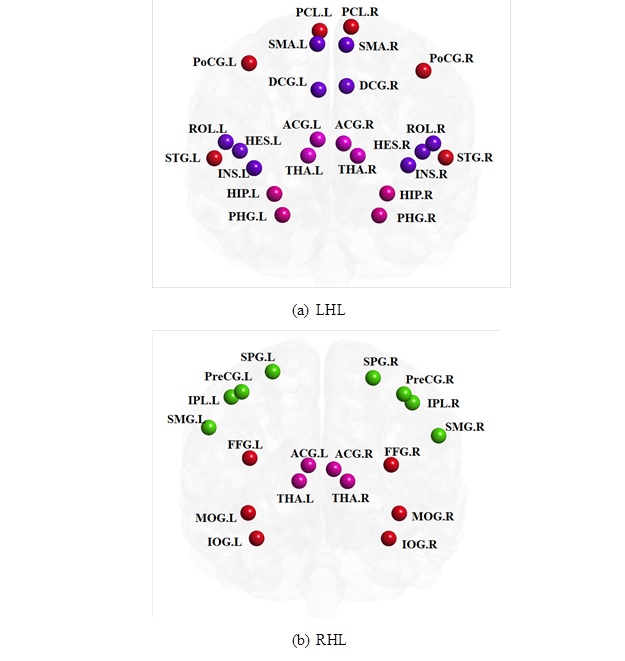
Network disruptions were detected across a variety of network modules for both LHL- and RHL-cohorts in terms of eigenvector- (Figure 3) and degree-centrality (Figure 4).
Discussion
This study is among the first to investigate network differences between heterogeneous stroke patients and healthy controls. Despite heterogeneity in stroke lesions, significant reductions of network metrics (i.e. LE, GE, DEN and CC) were observed from stroke patients, likely affected by lesion volumes. Significant reduction of GE and DEN for RHL compared to LHL-cohorts could be attributed to significantly greater lesion sizes of RHL-cohort.
As expected, SMN-related modules are consistently identified as disrupted subnetworks at modular-level; network disruptions are also identified within ATN-, DMN-, and VSN-related modules (see Figure3), suggesting that focal lesions have remote effects on the function of remote brain regions.
Interestingly, network disruption was only observed from RHL- but not from LHL-cohort in the VSN-related module, either using the eigenvector- or degree-centrality metric; this is consistent with a previous finding showing that RHL-cohort are more likely to show neglect than LHL-cohort 5.
These network specific findings should provide insights into brain network disruption in chronic stroke patients, therefore improving rehabilitation outcomes.
Acknowledgements
No acknowledgement found.References
1. Grefkes, C., Fink, R. G. Connectivity-based approaches in stroke and recovery of function. Lancet Neurol. 2014; 13:206-16.
2. Liang, X., Vaugh, D.N., Connelly, A., Calamante F. A novel Group-Fused Sparse Partial Correlation Method for Simultaneous Estimation of Functional Networks in Group Comparison Studies. Brain Topogr. 2018; 31(3): 364-79.
3. Siegel, J.S., Ramsey, L.E., Snyder, A.Z., Metcalf, N.V. Disruptions of network connectivity predict impairment in multiple behavioural domains after stroke. Proc Natl Acad Sci USA. 2016; 113(30): E4367-76.
4. Liang, X., Yeh, C., Connelly, A., Calamante F. A novel method for extracting hierarchical subnetworks based on multi-subject spectral clustering approach. PISMRM. 2017; 25: 0960.
5. Baldassarre, A., Ramsey, L., Rengachary, J., Zinn, K., et al. Dissociated functional connectivity profiles for motor and attention deficits in acute right-hemisphere stroke. Brain. 2016; 139(7): 2024-38.
Figures