3885
Investigating the feasibility of predicting somatosensory function of stroke patients from resting-state functional connectivity1Florey Institute of Neuroscience and Mental Health, Heidelberg, Australia, 2Florey Department of Neuroscience and Mental Health, The University of Melbourne, Heidelberg, Australia, 3College of Science, Health and Engineering, La Trobe University, Melbourne, Australia
Synopsis
Accumulating evidence from human imaging data supports association between connectivity and outcome after stroke. However, whole-brain functional-connectivity (FC) involves high-dimensional data, which essentially calls for multivariate analysis. Regardless, univariate analysis has been dominantly employed for such studies. More insights into stroke recovery by employing machine learning techniques can be offered due to their multivariate capabilities. In this study, we investigated if residual sensory function (Tactile discrimination threshold, TDT score) of stroke patients can be predicted from resting-state FC. Our results show that TDT scores can be predicted more accurately by combining both low-order and high-order FC than low-order functional connectivity alone.
Introduction
The recovery of motor and sensory function after stroke is crucial for the patient to achieve independence and quality of life. However, prediction of patient’s recovery and outcome has rarely been successful while using clinical assessment alone 1. Accumulating evidence has demonstrated that brain functional deficits can extend to remote connected brain areas 2. Thus far, human imaging data support strong association between connectivity and outcome after stroke 3,4,5. Whole brain functional connectivity involves high-dimensional data, which essentially calls for multivariate analysis. However, univariate analysis has been predominantly employed for such investigations. New insights into stroke recovery can be offered by employing machine learning techniques due to their multivariate capabilities. In this study, we aim to investigate if residual sensory function (Tactile Discrimination Test, TDT score) of stroke patients can be predicted from resting-state functional networks.Methods
MRI data acquisition: MRI data were acquired at 3T Siemens Tim Trio scanner (n=40): (1) T1 anatomical image: TR /TE=1900/2.55ms, 256×256 matrix, 160 slices; (2) Resting-state fMRI data: TR/TE=3000/30ms, 3 mm isotropic, 72×72 matrix, 44 slices, 140 volumes; (3) T2 FLAIR: TR/TE=6000/388ms, 1 mm isotropic.
Lesion mask creation: Lesion Masks were drawn in Axial FLAIR images using mricron by a trained neuroimaging researcher, quality checked and modified as necessary by an experienced neurologist to ensure they accurately represented the infarct.
Data analysis: fMRI data were pre-processed as follows: (1) realigning BOLD data; (2) coregistering BOLD (1) to T2 FLAIR space; (3) coregistering lesion mask to T1 anatomical space; (4) applying segmentation-normalization to T1 and lesion mask (3); (4) coregistering BOLD (2) to T1 space; (5) normalizing BOLD (4) to MNI template; (6) smoothing BOLD (5) (FWHM=[6 6 6]). Artifacts removal: Independent component analysis was applied to pre-processed fMRI data (fsl’s Melodic). Artifact-related independent components were identified and removed by applying fsl’s regfilt.
Construction of functional connectivity: Ninety-region anatomical automatic labelling (AAL, excluding cerebellum) template was employed to calculate region-wise time series. Functional connectomes were constructed using Pearson correlation between regions, hereafter called low-order functional connectivity (LO-FC). In addition, a high-order FC (HO-FC) 6 was also computed to capture second-level relationship using inter-regional similarity of the FC topographical profiles.
Predictive modeling: Regression predictive modeling was conducted to predict tactile sensory function of stroke patients with two regression models: linear regression (LR) and support vector regression (SVR) with linear kernels.
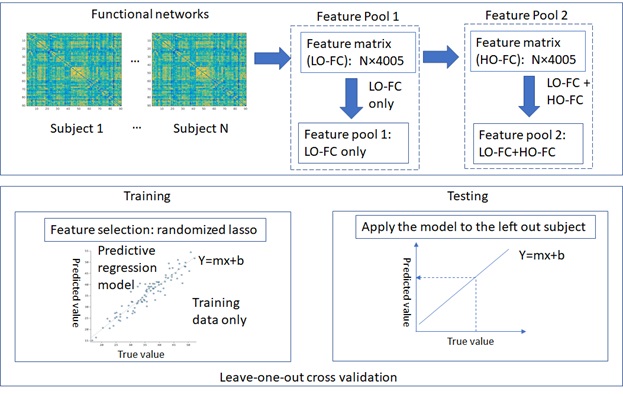
Feature engineering: Functional connectivity strengths were employed as potential features. Two different lists of features were used for comparisons: (1) LO-FC; and (2) LO-FC + HO-FC. Stability selection was used for feature selection, which is implemented in the randomized lasso in sklearn (scikit-learn.org).
Leave-one-out cross-validation: Given that limited number of patients (N=40) were available for training predictive models, a nested leave-one-out cross-validation approach was employed. In each outer loop iteration, one patient is retained as test set, and the remaining N-1 patients were considered as training set; feature selection was applied to the training set only ensuring blind test condition; hyperparameters tuning was conducted in the inner loop iteration. The trained predictive model on each training set was then applied to the retained patient, predicting the quantitative, norm-referenced Tactile Discrimination Test, TDT, score 7.
Model comparisons and final model selection: Two regression models, LR and SVR, were employed to compare the prediction performance between LR and SVR regression model, either using LO-FC or LO-FC+HO-FC as the feature for both models. A flowchart of the proposed predictive modeling approach is shown in Figure 1.
Results
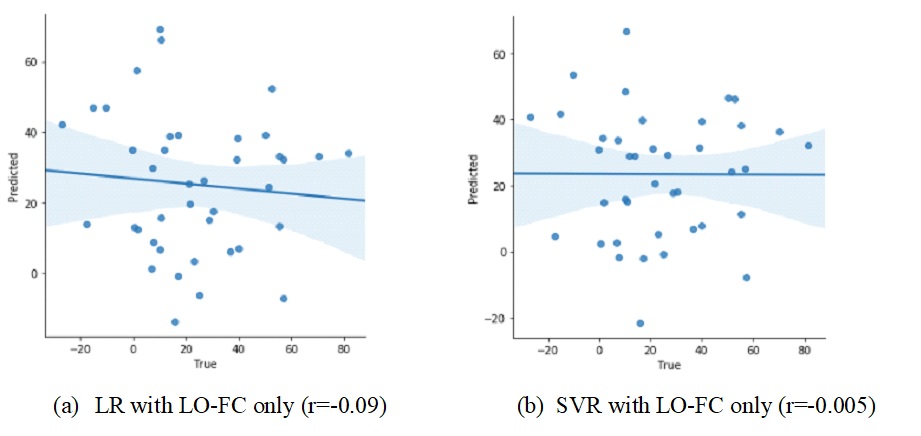
Figure 2 shows that TDT scores cannot be predicted from the feature pool 1 (i.e. LO-FC only) by employing either LR (r=-0.09) or SVR (r=-0.005).
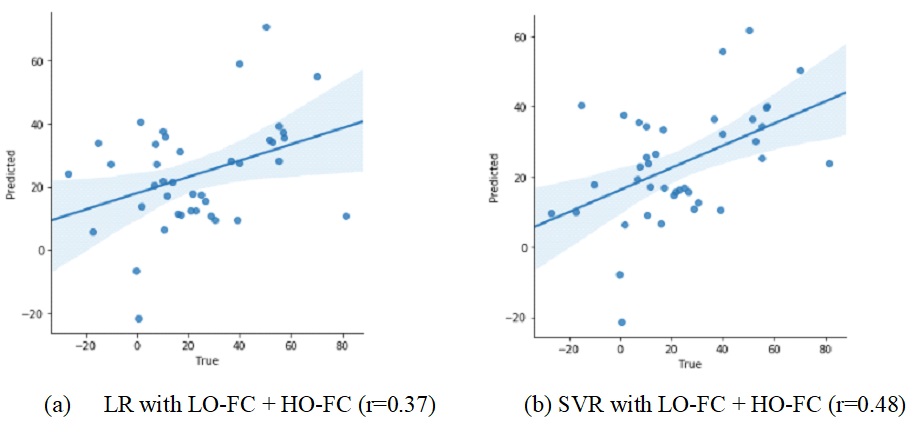
Figure 3 shows that TDT scores can be predicted from the feature pool 2 (i.e. LO-FC + HO-FC) by employing LR (r=0.37) and SVR (r= 0.48).
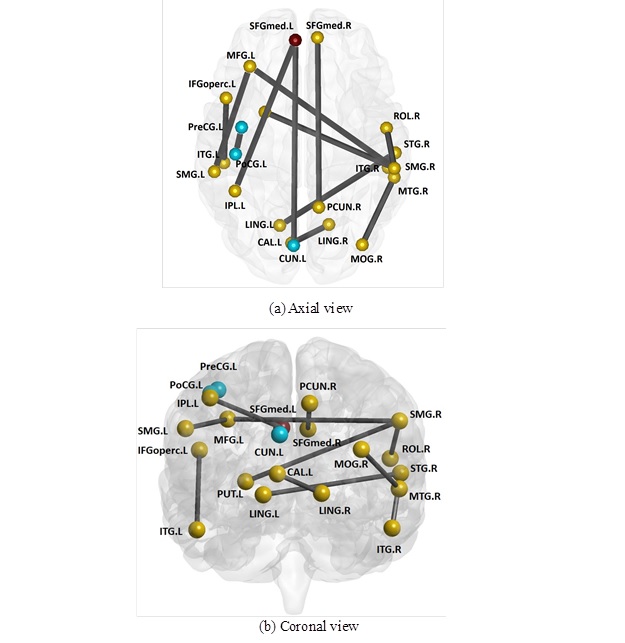
Functional network edges (i.e. features) that are important in predicting TDT scores are mapped onto the AAL-atlas in axial (Figure 4 (a)) and coronal views (Figure 4(b)).
Discussion
We proposed machine learning approaches to predict outcome in one of the behavioural domains of recovery, i.e. sensory impairment (TDT scores). While prediction of TDT with LO-FC as a feature pool alone was not successful, further inclusion of HO-FC greatly improved the prediction outcomes. As expected, SVR with linear kernel outperforms LR (i.e. r=0.48 vs 0.37). Interestingly, selected features (i.e., 13) involved twenty-one brain regions, which are closely related with somatosensory function.
Therefore, these findings could facilitate the extraction of neuroimaging biomarkers, providing clinically useful information when planning the personalised rehabilitation of a patient.
Acknowledgements
No acknowledgement found.References
1. Coupar F, Pollock A, Rowe P, et al. Predictors of upper limb after stroke: a systematic review and meta-analysis. Clinical Rehabilitation. 2012; 26(4), 291-313.
2. Boyd LA, Hayward KS, Ward NS, et al. Biomarkers of stroke recovery: Consensus-based core recommendations from the Stroke Recovery and Rehabilitation Roundtable. Int J Stroke. 2017; 12, 480–493.
3. Carter AR, Astafiev SV, Lang CE, et al. Resting-state interhemispheric functional magnetic resonance imaging connectivity predicts performance after stroke. Ann Neurol. 2010; 67, 365-75.
4. Carter AR, Shulman GL, Corbetta M. Why use a connectivity-based approach to study stroke and recovery of function? NeuroImage. 2012; 62(4):2271-80.
5. Urbin MA, Hong X, Lang CE, et al. Resting-state functional connectivity and its association with multiple domains of upper extremity function in chronic stroke. Neurorehabil. Neural Repair. 2014; 28, 761-769.
6. Zhang H, Chen X, Shi F, et al. Topographical information-based high-order functional connectivity and its application in abnormality detection for mild cognitive impairment. J Alzheimers Dis. 2016; 54(3): 1095-1112.
7. Carey LM, Oke LE, Matyas TA. Impaired touch discrimination after stroke: a quantitative test. Neurorehabilitation and Neural Repair. 1997; 11: 219-32.
Figures