3881
Changes in resting state networks in major depression following ketamine administration1ETPB, NIH, Bethesda, MD, United States
Synopsis
Recently, it has been shown that individual classification of subjects across scans is possible using correlation matrices derived from their resting state data. In the current study, a cohort of patient with major depression and healthy controls each had five resting state fMRI scans over the course of a double blind randomized placebo controlled cross-over ketamine infusion study We apply this classification scheme to our data to see if we can link individual functional connectivity profiles to behavioral improvements after ketamine.
Introduction
Major Depressive Disorder (MDD) is associated with a heavy burden of disability and can also lead to suicidal thoughts, attempts and deaths. The heterogeneity of symptoms associated with MDD has been an obstacle to identifying specific neural correlates of the presence of depression as well as response to treatment. Isolating specific depressive symptom clusters may be useful in identifying associations with biologic markers that could facilitate understanding the neurobiological underpinnings of depression.1-3 Recently, it has been shown that individual classification of subjects across scans is possible using correlation matrices derived from their resting state data4. In the current study, a cohort of MDD patients and healthy controls (HC) each had five resting state fMRI scans over the course of a double blind randomized placebo controlled cross-over ketamine infusion study. Here, we apply this classification scheme to our data to see if we can link individual functional connectivity profiles to behavioral improvements after ketamine.
Methods
29 MDD (ages 20-65, 17 female) and 25 healthy (ages 24-56, 12 female) subjects are included in this analysis. Resting state fMRI scans were 8 minutes long with the subject’s eyes closed (fMRI parameters: 3T, TR:2.5s, TE: 25 ms, FA: 90, res: 3.75x3.75x3.5 mm, matrix 64x64) along with a high resolution MPRAGE anatomical scan (1mm isotropic). Cardiac and respiration data were also recorded. The data was preprocessed using AFNI5, motion and physiological noise corrected, blurred to 6 mm, filtered: bandpassed between 0.01 and 0.1 Hz, and aligned to the MNI 152 standard template. Connectivity matrices were calculated from the 33 Raichle (2011)6 seeds and 238 region Power (2012)7 parcellation (that survived within a group mask). Individual identification, edge strength and prediction of behavioral variable prediction were calculated following Finn (2017)6 Only subjects with scans in the ’database’ and the ‘target’ set of scans were kept for each comparison.
Results and Discussion
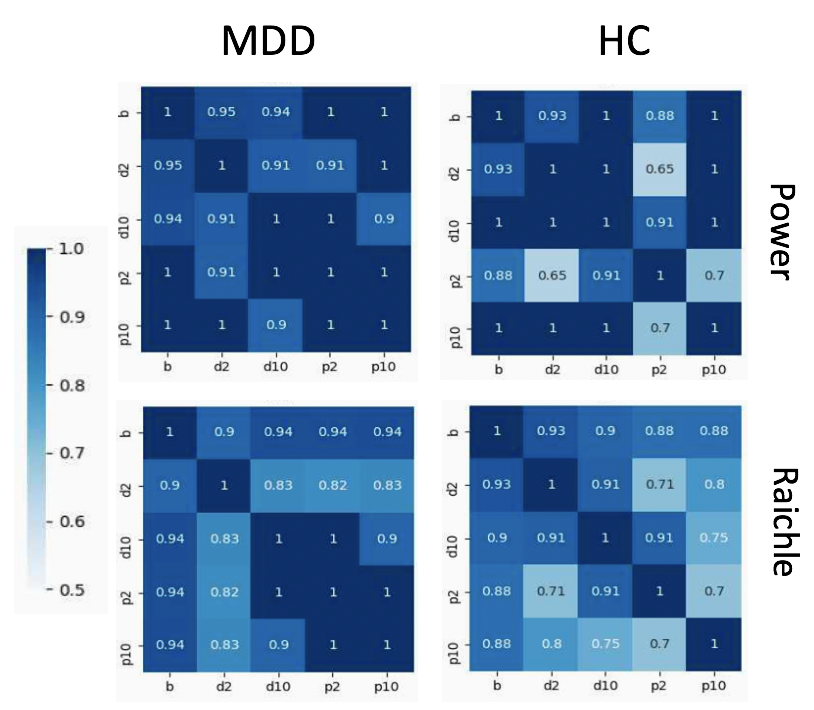
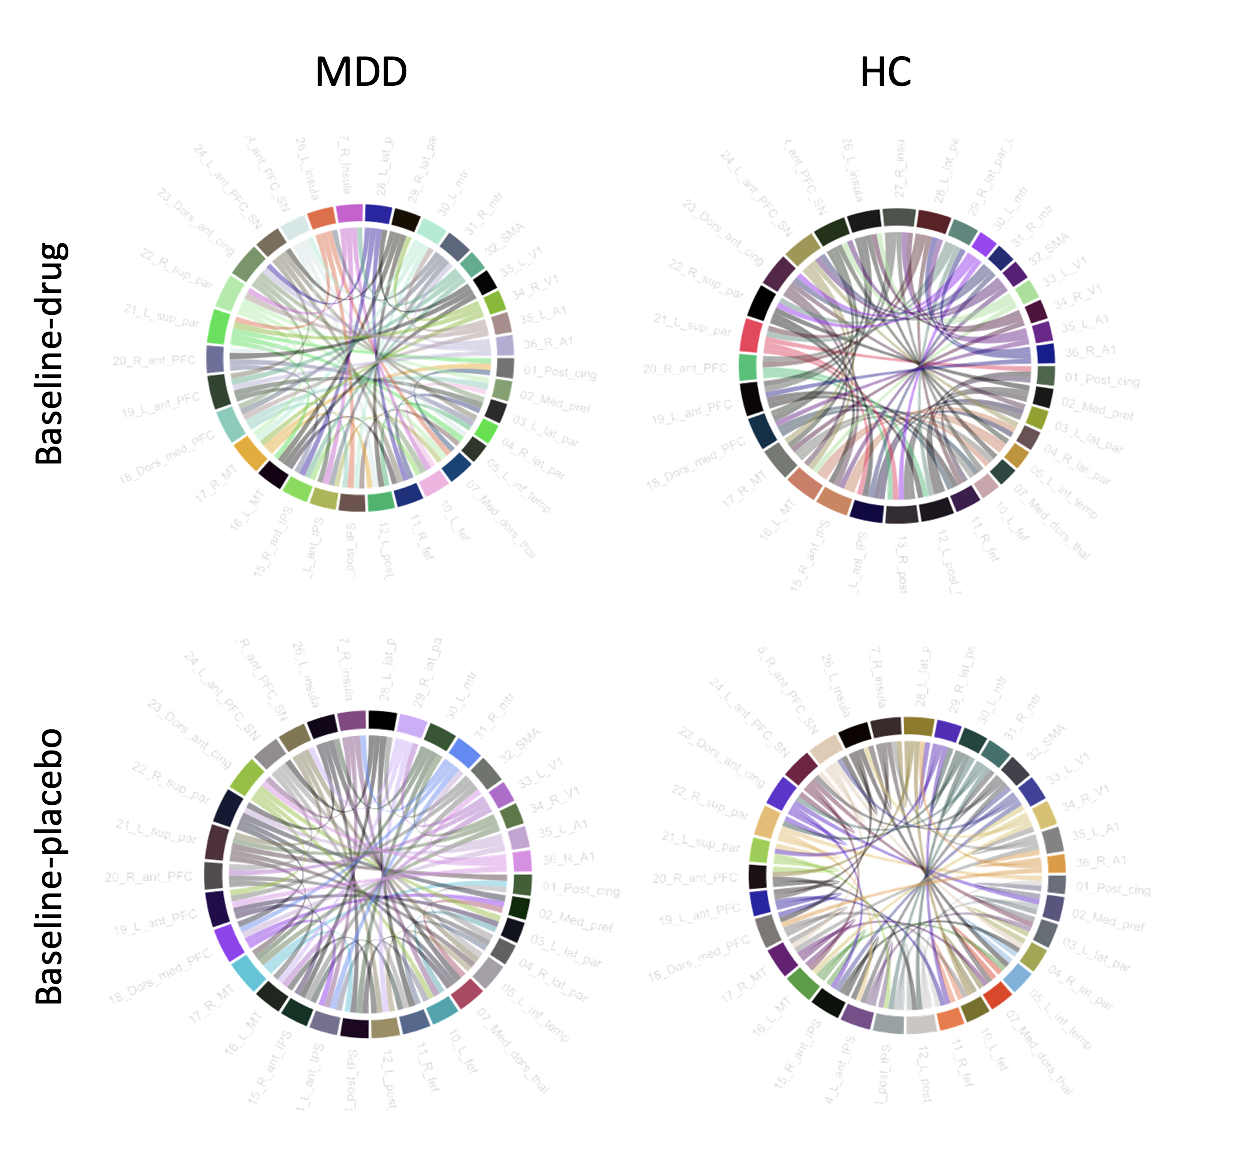
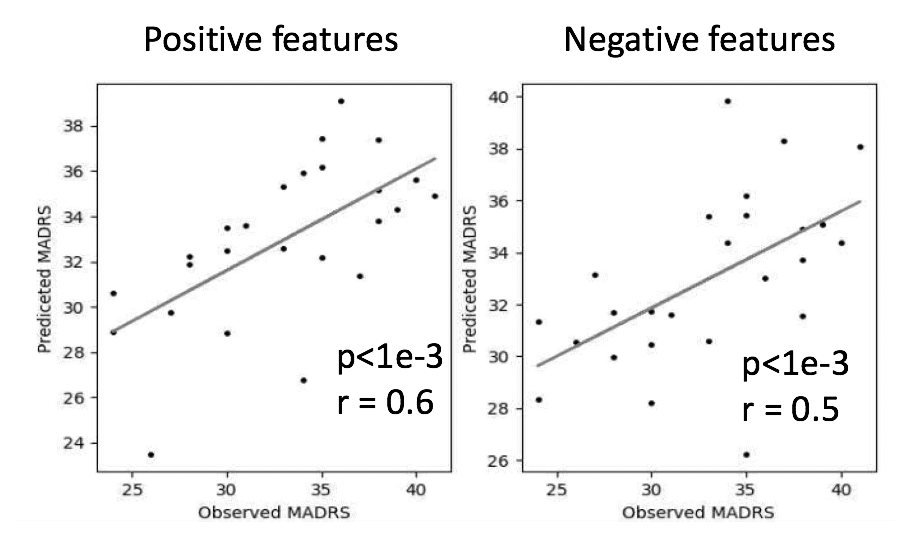
Individual classification between the ‘database’ (row) and ‘target’ (column) scans was performed by calculating the maximum correlation between the database and targets correlation matrices and is shown in Figure 1. Overall, high subject identification rates are achieved, improvements are seen with a larger number of nodes or a finer parcellation. Reduced classification is seen in drug and the first placebo scan. Edges with a high DP tend to have similar values within an individual across conditions, but different values across individuals regardless of condition, as shown in Figure 2. The edges contributing to the classification of the MDD and HC subjects appear to be different and are affected by scan condition. Prediction of the behavioral variable at baseline for the MDD from the positive and negative features is shown in Figure 3. In both cases, highly significant correlations are obtained with reasonable prediction of the observed MADRS value from the correlation matrix.Conclusion
Excellent individual classification using the correlation matrices for both HC and MDD subjects which is slightly decreased in the presence of ketamine or placebo. Further investigations into the edges that drive the classifications and MADRS prediction may help reveal the neural patterns underlying response to ketamine.Acknowledgements
No acknowledgement found.References
1.Zarate, CA et al. (2013). Biological Psychiatry 2.Leuchter AF, et al.(2010) Current Psych Reports. 3.Williams LM.(2017) Depress Anxiety. 2017 4.Finn ES et al. (2017) Nature Neuroscience 5.Cox, RW et al. (1995) Comput Biomed Res 6.Raichle M et al (2011) Brain Connectivity 7. Power J (2012) NeuronFigures