3880
Identifying motif patterns of directed brain functional networks in schizophrenia1The First Affiliated Hospital of Zhengzhou University, Zhengzhou, China, 2Southern Medical University, Guangzhou, China
Synopsis
In this study, we aimed to investigate the motif patterns of the directed brain functional networks in schizophrenia. We employed the convergent cross mapping approach to measure the directed connections, and calculated the frequency spectrum and the statistical significance of 13 three-node motif classes. Our results showed that the count of all motif classes was significantly reduced, the significance of chain-like motifs was decreased and the significance of loop-like motifs was increased at both whole brain and modular scales in schizophrenia. The motif analyses have potential to provide new insights of the abnormal information flow patterns in schizophrenia.
Introduction
Schizophrenia is a chronic mental disease whose symptoms are considered to have a strong neurobiological basis. The previous studies proposed that disturbances in functional connectivity were the major neuropathological mechanism in schizophrenia 1, 2. Investigation of the underlying information flow patterns of the connections would benefit our comprehension for schizophrenia. Most previous studies concentrated on the undirected functional connectome in brain. However, the directed brain functional network, which could essentially characterize the basic information flow of intrinsic brain activities, has not been investigated. Moreover, the information driven and driving architecture in basic building blocks has yet to be elucidated. In this work, we aimed to explore the changes of information flow patterns of the directed brain functional networks in schizophrenia.Materials and Methods
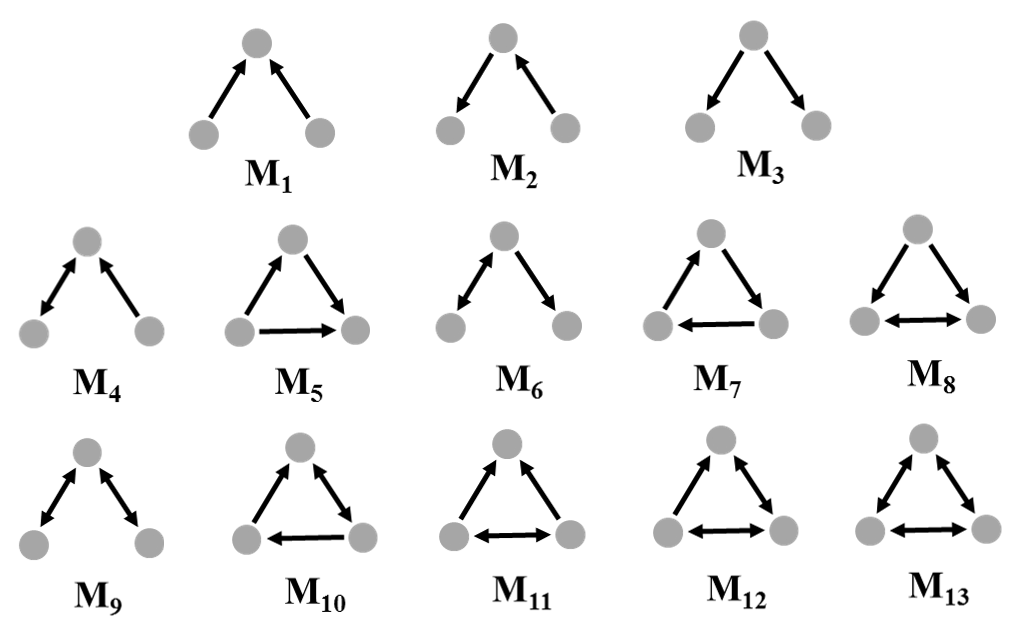
After obtaining written informed consent, 40 patients with schizophrenia and 42 age-matched healthy controls were enrolled in this study. All exams were performed under protocols approved by the institutional review board and were HIPAA compliant. Resting-state functional images (R-fMRI) were acquired using a single-shot GRE-EPI sequence on a 3T GE MR750 system. The R-fMRI data were preprocessed with the DPARSF software package 3. The whole brain was then segmented into 160 regions and further classified into six modules according to the functional template 4 . The causality between the mean time series of regions was calculated by using the convergent cross mapping (CCM) algorithm 5. We further employed small topological subgraphs that called “motifs” 6, 7 to unravel the underlying information flow patterns. A motif is a connected subgraph consisting of vertices and a set of edges. Figure 1 shows an illustration of 13 three-node motif classes 7. The motif frequency spectrum was calculated by detecting the count of occurrences for each corresponding motif 8. And the probability spectrum of each motif was obtained by dividing the count of each motif by the total count of all 13 motifs. In order to measure the significance for each motif class, motif spectra of 100 random networks was generated, and the Z score of each motif was calculated. The statistical significance for each motif was defined as the Z > 1.96 (P < 0.01). The motif frequency spectrum calculations were performed at the whole brain scale as well as the modular scale including within- and between-module. The inter-group statistical comparison between healthy controls and schizophrenia was performed by using nonparametric permutation test. A significance level of P < 0.01 was used.Results
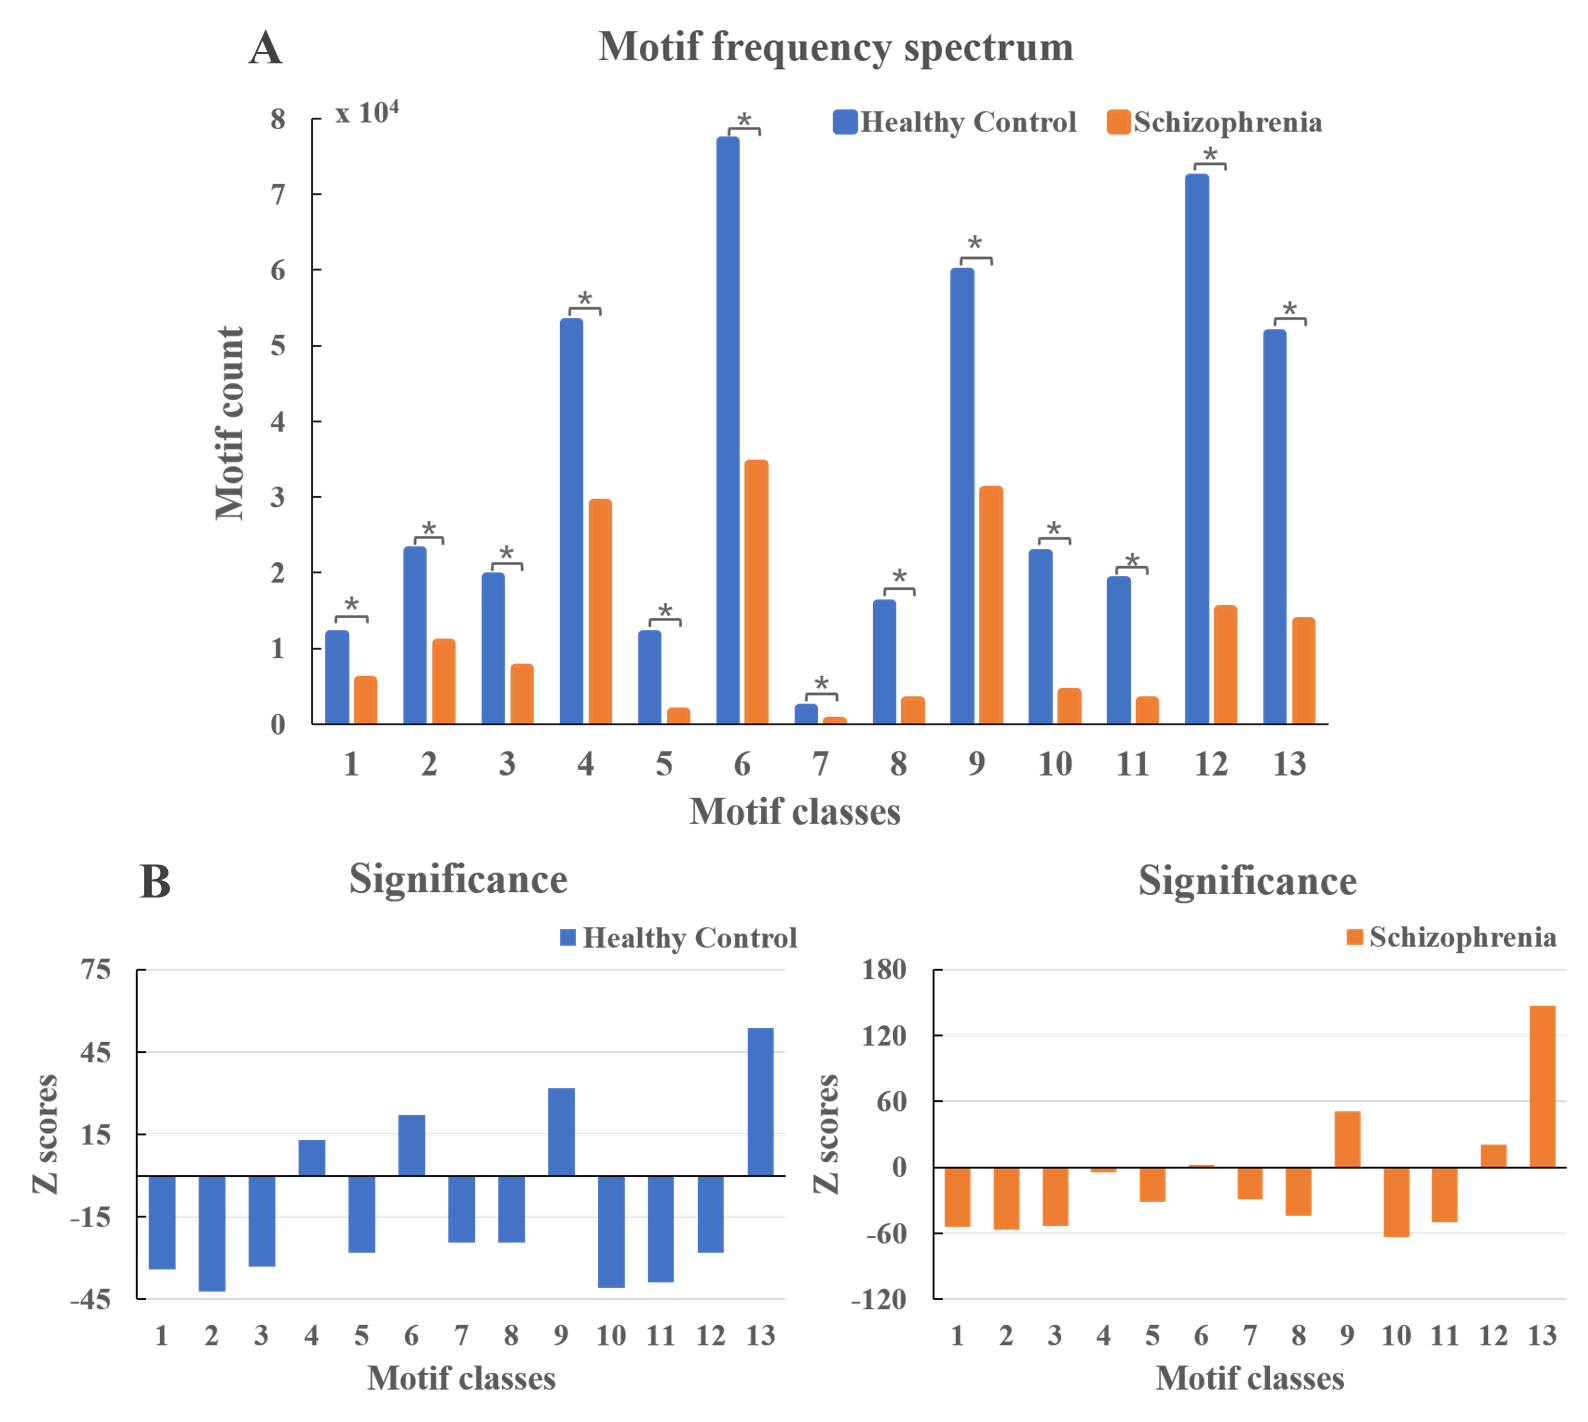
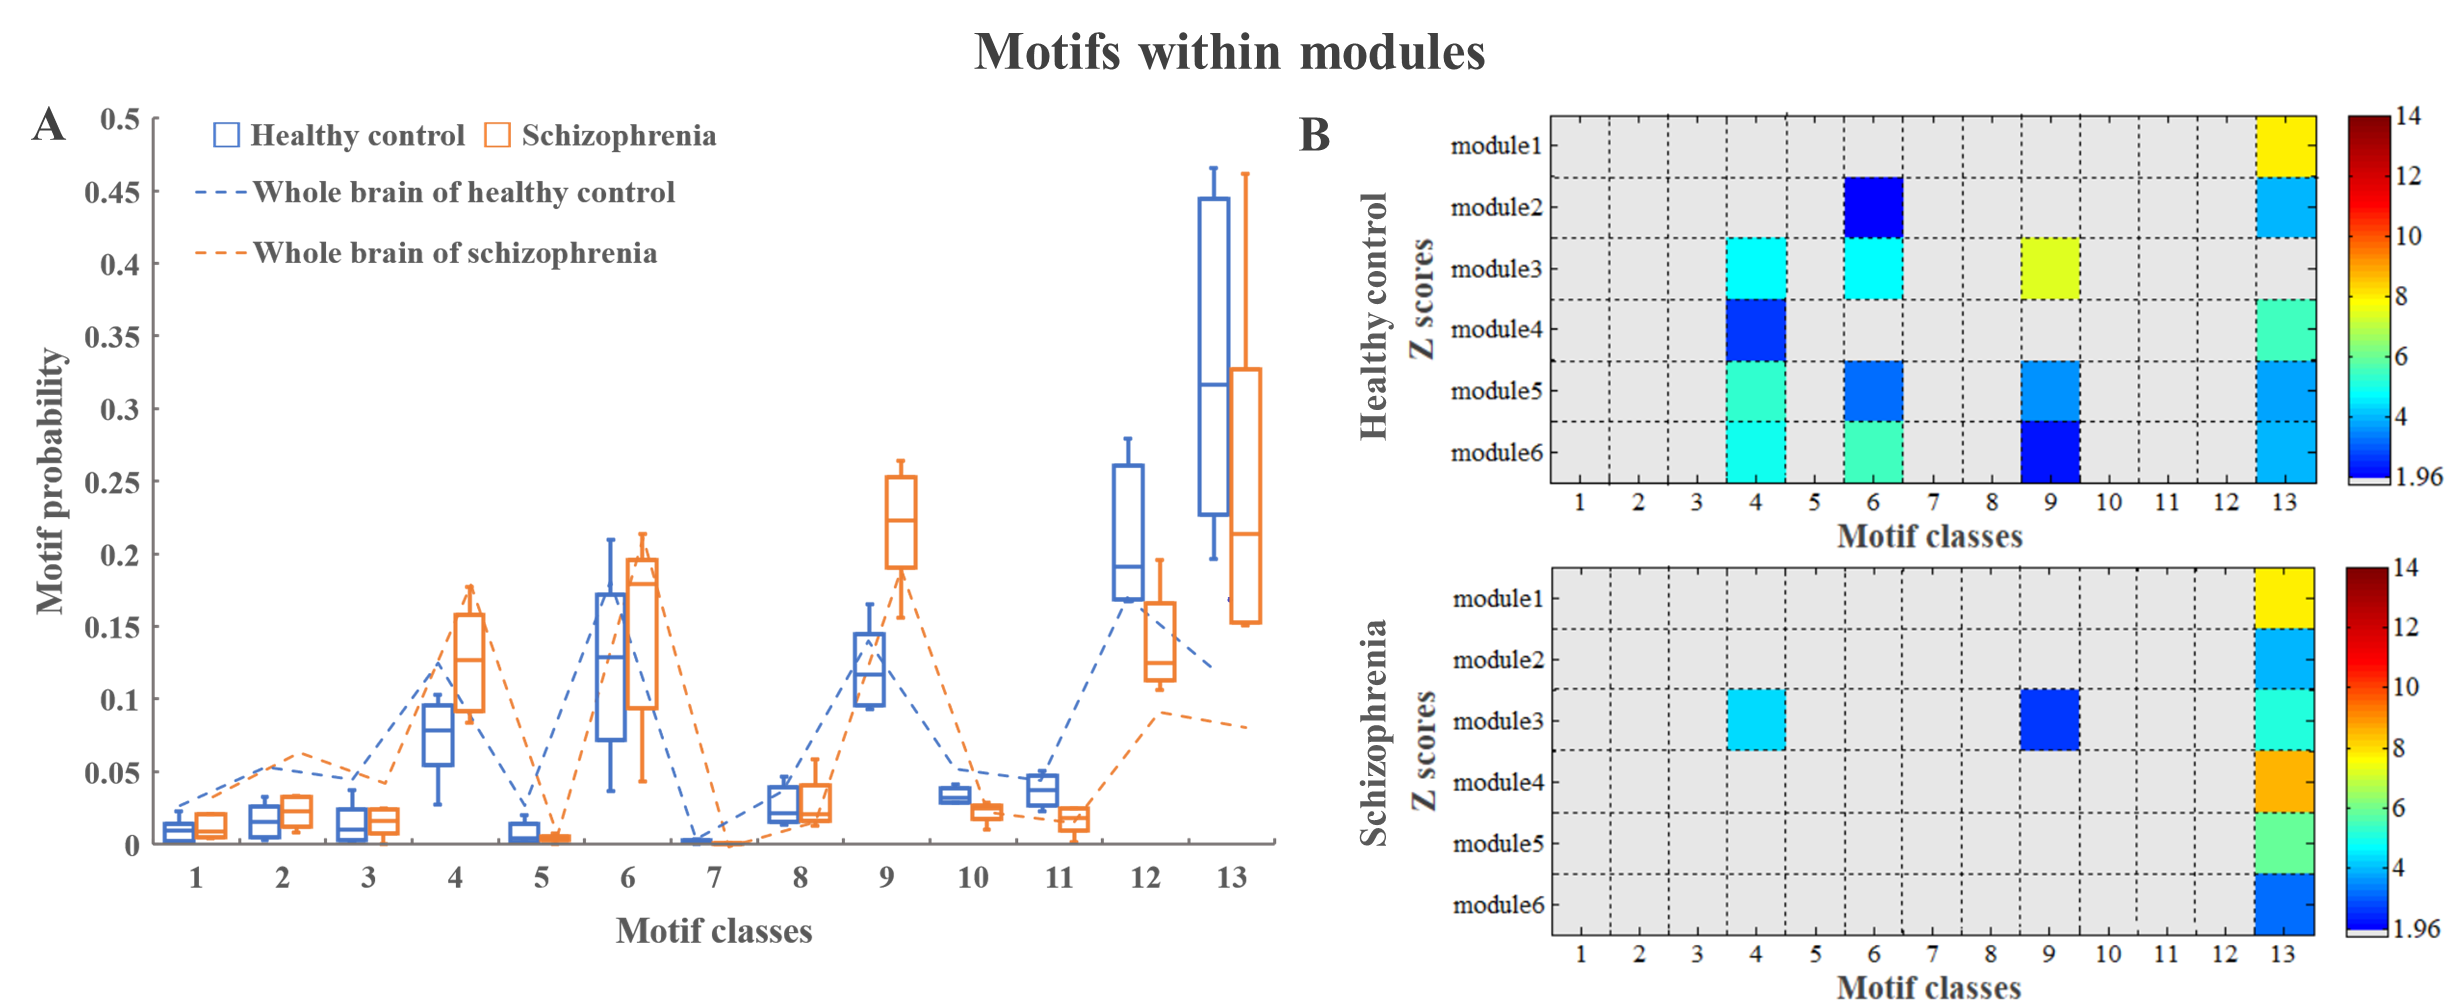
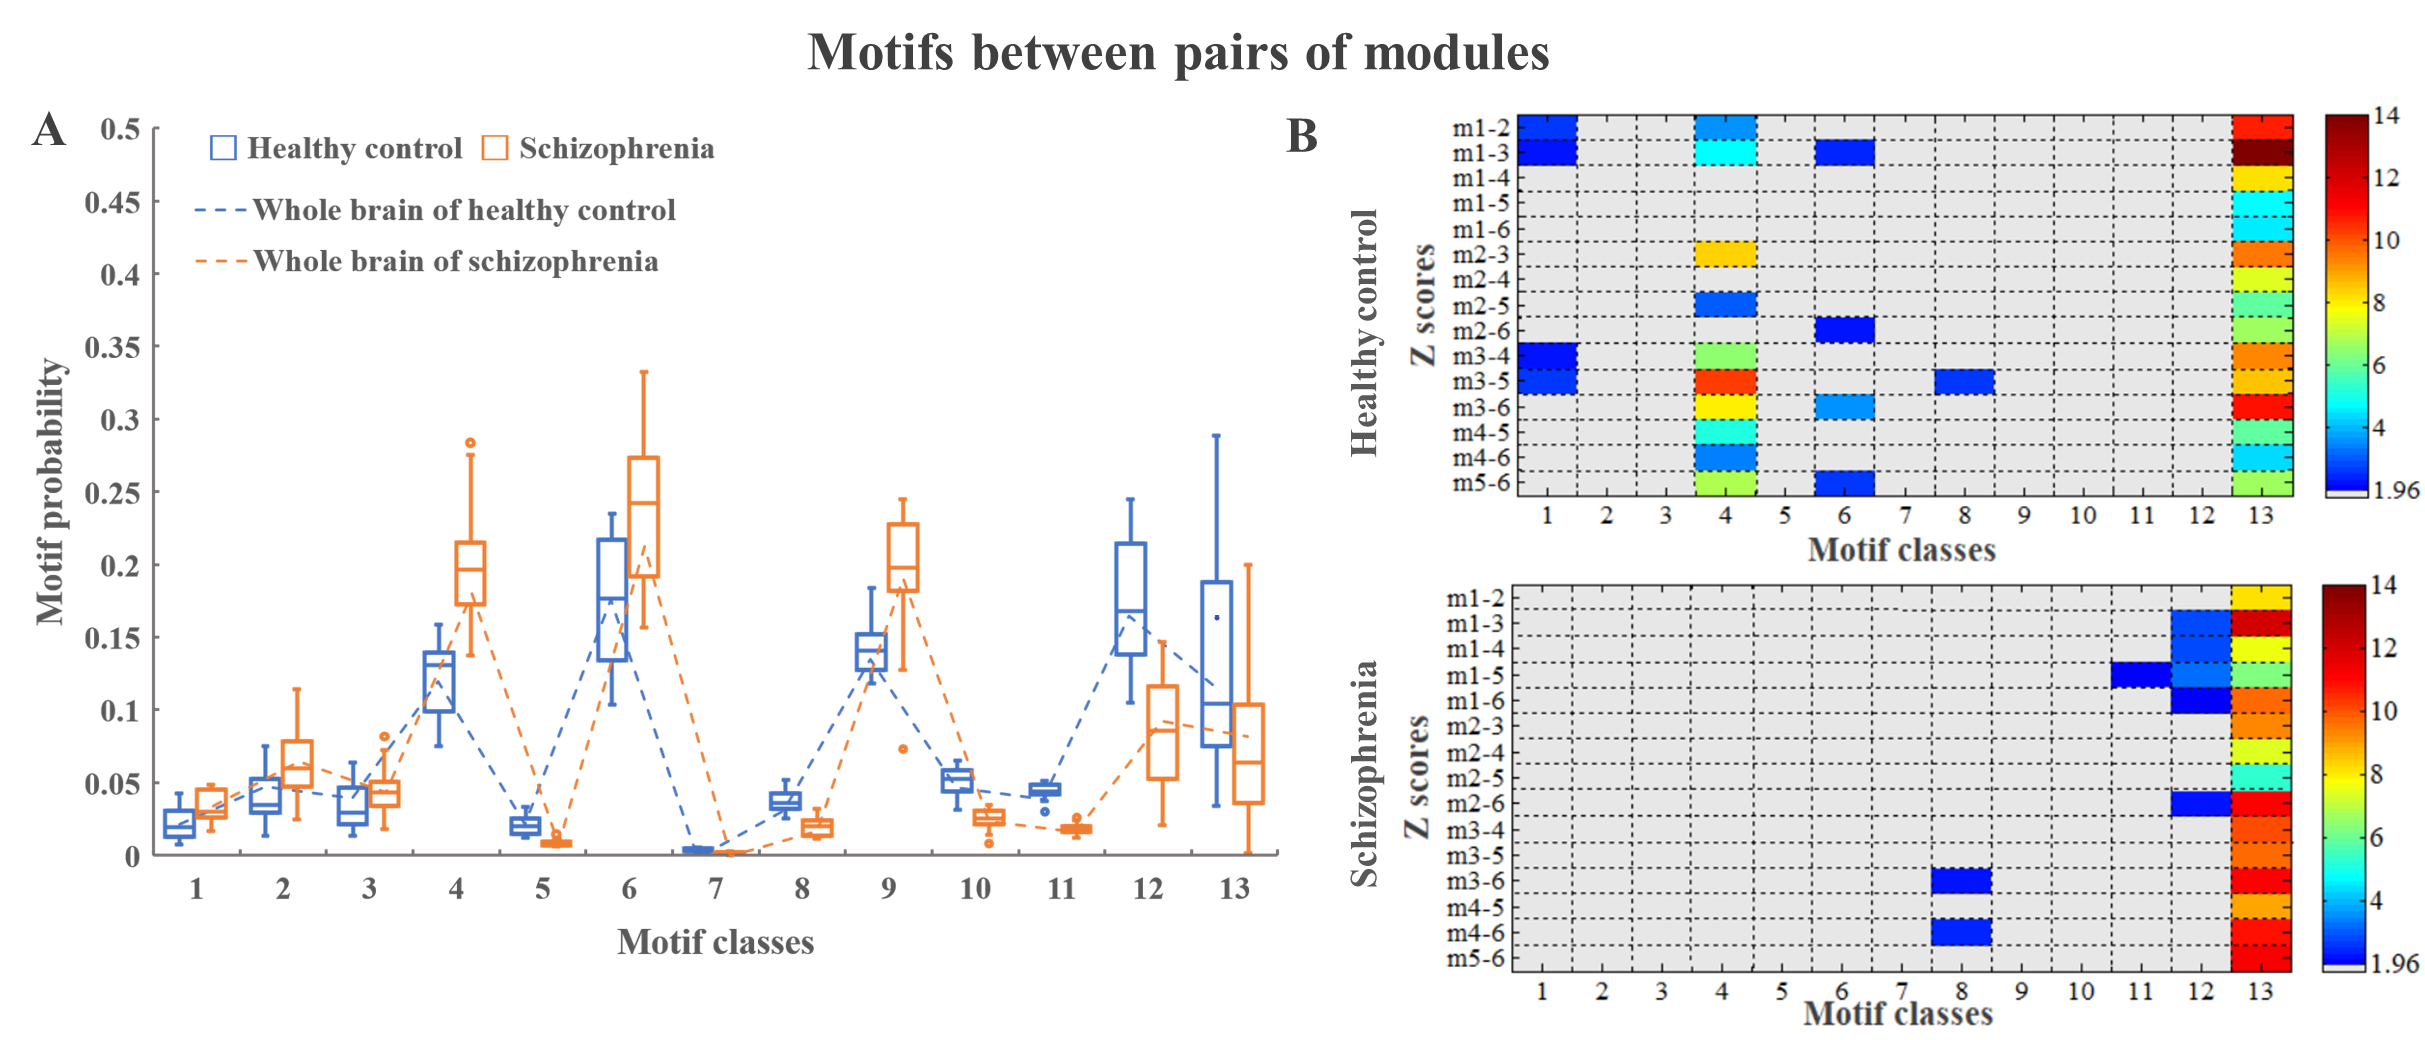
The motif frequency spectra at the whole brain scale of the two groups are shown in Figure 2A. The results show that the motif count in schizophrenia are significantly reduced at all 13 motif classes (All P < 0.01, FDR correction). There are high Z scores at four motifs (ID 4, 6, 9, 13) in healthy controls and three motif classes (ID 9, 12, 13) in schizophrenia, demonstrating significances of these motifs (Figure 2B). For within-module scale, the motif probability shows similar profiles in both groups (Figure 3A). Four motif classes (ID 4,6,9,13) in some modules of healthy control brain had significance, while the significance of motifs (ID 4,6,9) were decreased and the significance of motif (ID 13) were increased in several modules of patient brain (Figure 3B). For the between-module scale, the motif probability also shows similar profiles in both groups (Figure 4A). The significance of motifs (ID 1,4,6) were decreased and the significance of motifs (ID 12,13) were increased in several modules of patient brain (Figure 4B).Discussion
In this study, we investigate the difference of motif patterns in directed brain functional networks between healthy controls and schizophrenia. The identified five significant motif classes at both whole brain and modular scales can be classified into the chain-like motif type (i.e., ID 4, 6, 9) and the loop-like motif type (i.e., ID 12, 13). All 13 motif classes at whole brain scale are significantly decreased in schizophrenia group, demonstrating there is disease-related disconnection for the directed brain functional networks. In addition, the combination of the decreased motif significance for chain-like motifs and the increased motif significance for loop-like motifs at both whole brain and modular network scales demonstrates weaker information segregation and stronger integration for information flow patterns in schizophrenia.Conclusion
To our knowledge, this is the first study using motif pattern analysis method to assess the disconnection in schizophrenia. The disease-related motif alterations may gain new insights of the abnormal information flow patterns.Acknowledgements
No acknowledgement found.References
1. Yu M, Dai Z, Tang X, et al. Convergence and Divergence of Brain Network Dysfunction in Deficit and Non-deficit Schizophrenia. Schizophrenia Bulletin. 2017;43(6):1315-1328.
2. Micheloyannis S. Graph-based network analysis in schizophrenia. World J Psychiatry. 2012;2(1):1-12.
3. Chao-Gan Y, Yu-Feng Z. DPARSF: A MATLAB Toolbox for "Pipeline" Data Analysis of Resting-State fMRI. Front Syst Neurosci. 2010;4:13.
4. Dosenbach NU, Nardos B, Cohen AL, et al. Prediction of individual brain maturity using fMRI. Science. 2010;329(5997):1358-1361.
5. Sugihara G, May R, Ye H, et al. Detecting causality in complex ecosystems. Science. 2012;338(6106):496-500.
6. Sporns O, Kotter R. Motifs in brain networks. PLoS Biol. 2004;2(11):e369.
7. Milo R, Shen-Orr S, Itzkovitz S, et al. Network motifs: simple building blocks of complex networks. Science. 2002;298(5594):824-827.
8. Maslov S, Sneppen K. Specificity and stability in topology of protein networks. Science. 2002;296(5569):910-913.
Figures