3875
The functional network construction by using Pearson’s correlation, mutual information and convergent cross mappingZhizheng Zhuo1, Xiangyu Ma2, Lijiang Wei2, Zhe Ma2, and Haiyun Li2
1Clinical Science, Philips Healthcare, Beijing, China, 2Capital Medical University, Beijing, China
Synopsis
To compare and evaluate the functional networks constructed by using Pearson’s correlation, mutual information and convergent cross mapping.
Purpose
To compare and evaluate the functional networks constructed by using Pearson’s correlation, mutual information and convergent cross mapping.Introduction
Functional network have been widely applied in the works of functional MRI analysis in neuroscience. Pearson’s correlation (PC) is the most used method to describe the relationship between different brain regions, but it was limited to linear system. Mutual information (MI) based on the information theory and convergent cross mapping (CCM) based on the analysis in an embedded manifold could be used to identify the non-linear relationship between brain regions. Neuro-coupling has been regarded as a kind of non-linearity. So in this work, we compared and evaluated the functional network used in fMRI analysis based on linear (PC) and non-linear (MI and CCM) methods.Materials and methods
Seven fMRI images (TR=0.72s with Simultaneous Multi-Slice Excitation and Acquisition) downloaded from Human Connectome Project (HCP) were included in this study. These images were preprocessed according to the HCP preprocessing pipeline except for regression of white matter and CSF signals, filtering and smoothing. White and CSF signal regression, and signal filtering with bandwidth of 0.001-0.1Hz limited to the grey matter region were carried out in our following preprocessing. Pearson’s correlation, mutual information and convergent cross mapping were adopted to represent the relationship between each pair of brain regions (defined by AAL 90 atlas). And thus the functional networks were constructed. Graph analysis were applied to evaluate the network characteristics based on the above three methods. Small-worldness, clustering coefficient, averaged characteristic path length and global efficiency were calculated and compared.Results
Figure 1 and Figure 2 showed the functional connectivity matrix and corresponding network parameters respectively. The functional connectivity matrix were similar with each other and the network parameters were similar along different network sparsity especially for the averaged characteristic path length and global efficiency.Discussion
As the initial results showed, non-linear method including MI and CCM showed the ability to describe the relationship between different brain regions. For PC and MI, the connectivity matrix is symmetric but not for CCM. CCM could indicate the causality of two variables X and Y. If the local variables of Y could be predicted by the local variables of X in a low-dimension manifold, then there is a causality from X to Y. This causality is quantified by the correlation between the original Y and the predicted Y’. No matter the PC, MI or CCM, they all could be used to identify the underlying linear or non-linear coupling between the neuro activities within different brain regions. The functional networks constructed by these methods showed the similar network characteristics, which indicated the ability of these methods for brain network related works.Conclusion
Mutual information and convergent cross mapping could be used for the functional network construction and showed similar results as conventional Pearson’s correlation.Acknowledgements
No acknowledgement found.References
[1]. G. I. Bischi, et al., Eds., Nonlinear Dynamics in Economics, Finance and Social Sciences (Springer, Berlin, 2010).
[2] G. Sugihara et al., Detecting Causality in Complex Ecosystems. SCIENCE, 2012, vol 338, pp 496-500.
Figures
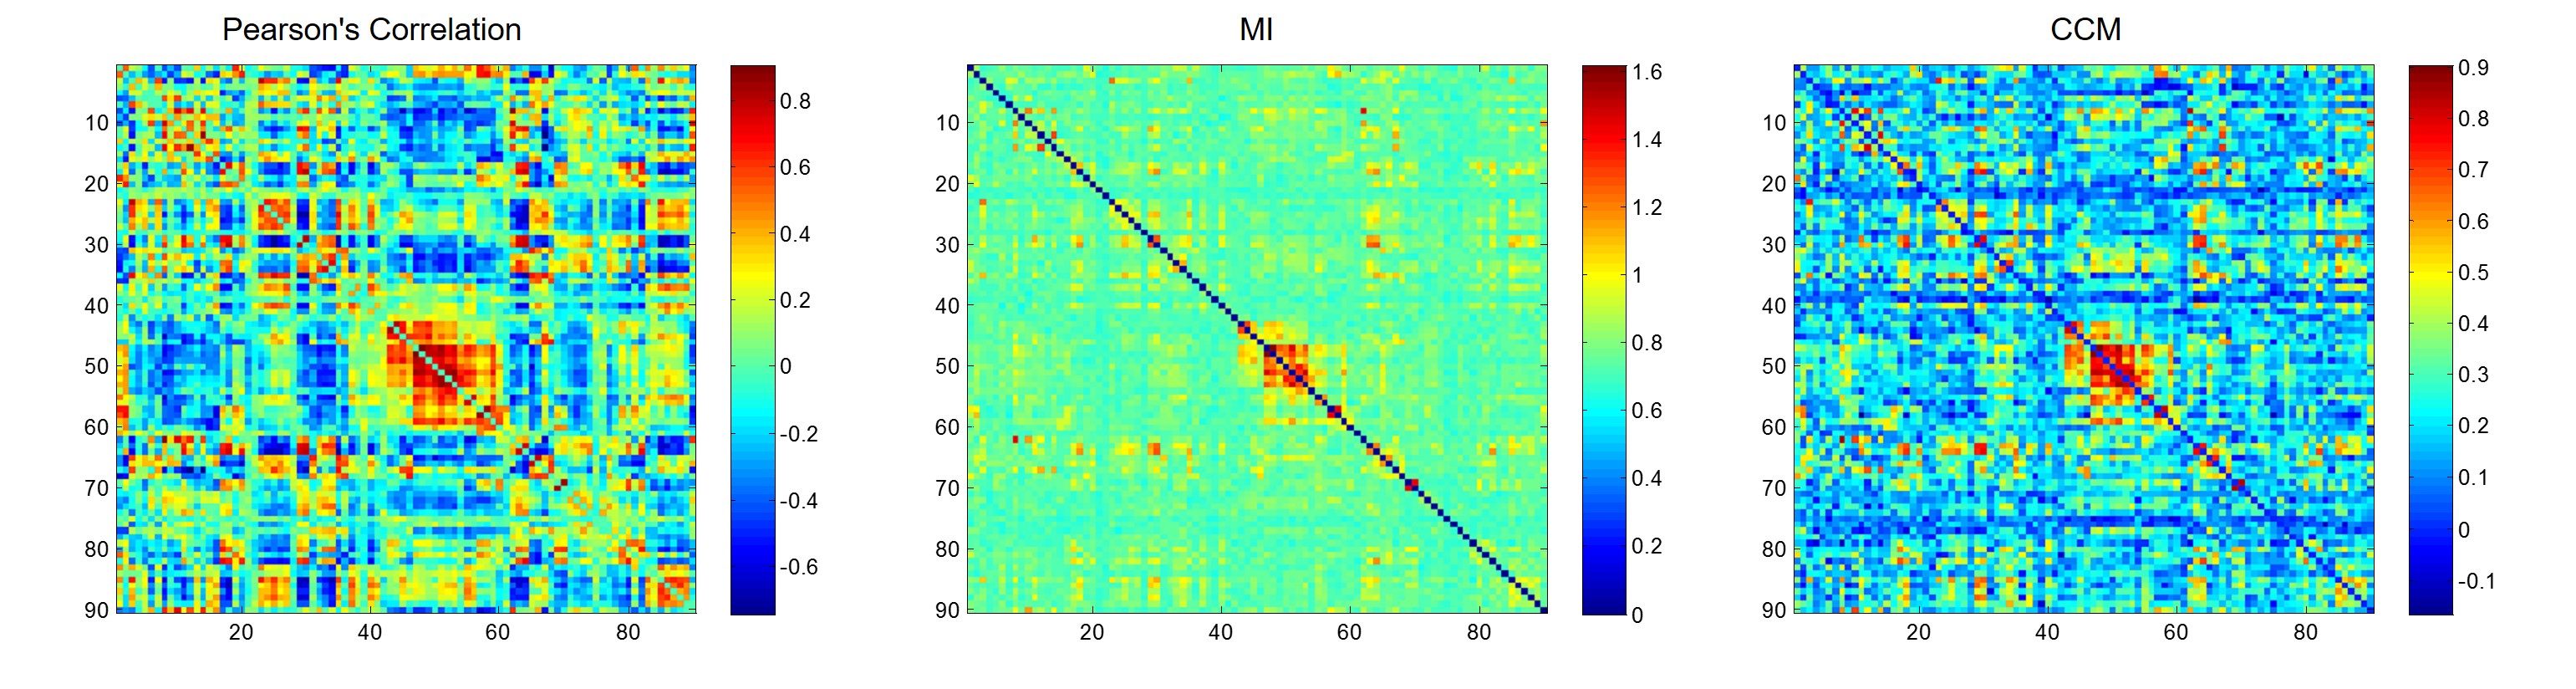
Figure 1. The functional connectivity network
constructed by Pearson’s correlation, mutual information and convergent cross
mapping.
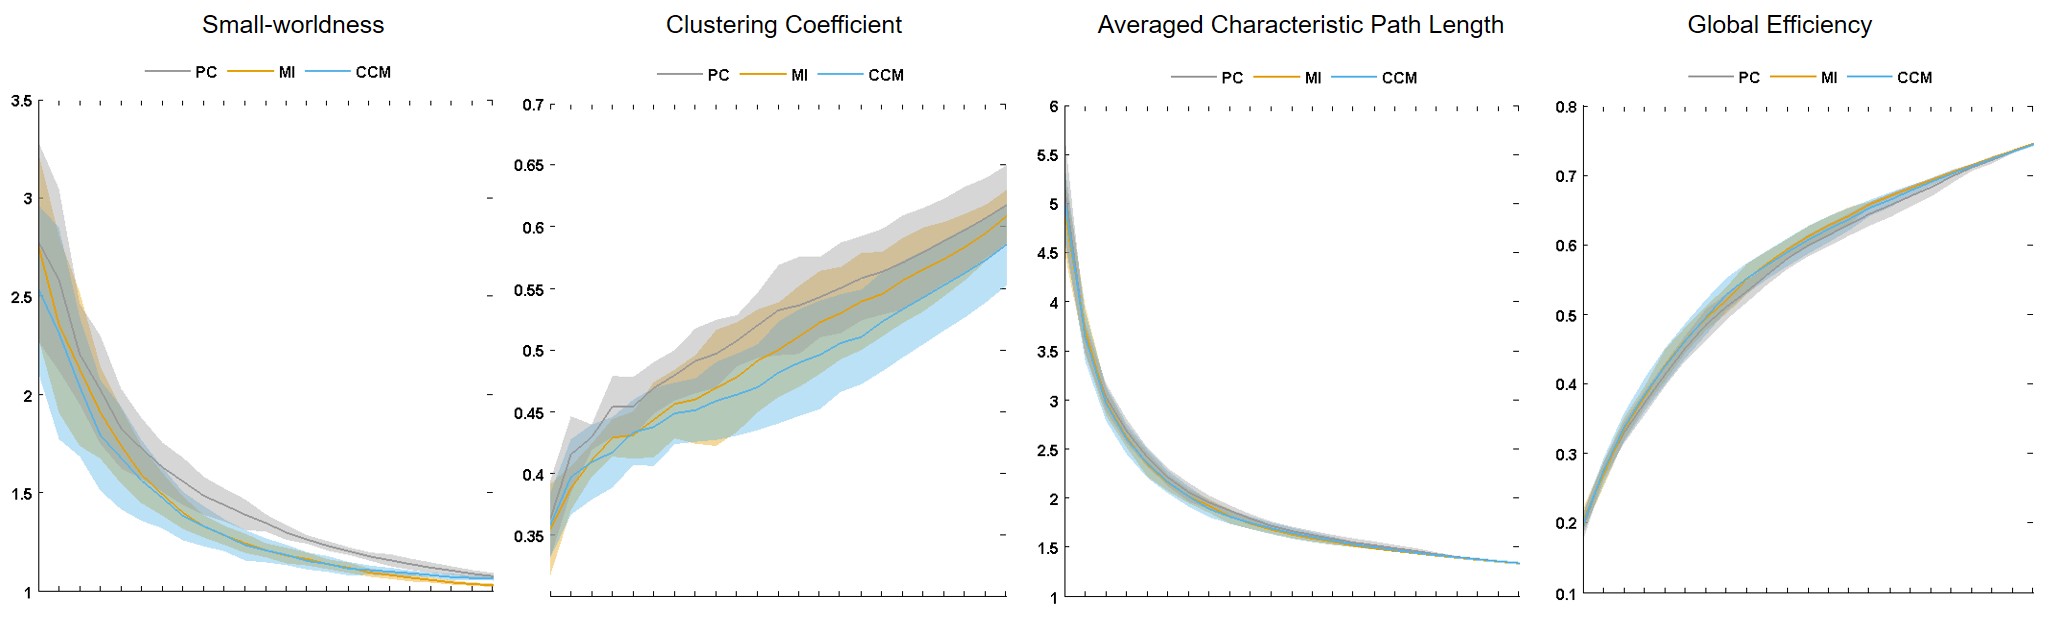
Figure 2. The network characteristics based on
Pearson’s correlation, mutual information and convergent cross mapping. (Line
indicated the mean value and the shadow indicated the standard error of the 7
subjects)