3870
Simple Data Acquisition Choices can Adversely Affect Preprocessing Strategies in Resting State fMRI1Imaging Institute, Cleveland Clinic Foundation, Cleveland, OH, United States
Synopsis
Common resting state fRMI preprocessing steps are done in the Fourier domain, in particular temporal filtering. These can introduce temporal artifacts that can be exaggerated by using data time-series that are not power of 2 in length. We show that using non-power of 2 data can affect the shape of the temporal filter being applied and can increase unwanted correlations from aliased physiologic noise for example and introduce increased autocorrelations in the data.
Introduction
It has been recently reported that preprocessing strategies can introduce “colored” features, or temporal artifacts in resting state fMRI data1. Low-pass2,3, high-pass4 and bandpass5, have all been recommended as preprocessing steps for resting state data analyses. Temporal filtering is often applied in the Fourier domain, normally achieved via the discrete Fourier transform (DFT). A drawback of the DFT is that it requires the length of the data vector, or in the case of rsfMRI, the time-series, to be a power of 2. If the data are not a power of 2, the data vector is filled with a zeros to the next highest power of 2 prior to applying the DFT. Artifacts can occur with applying filters serially on top of this zero-filling that can introduce colored noise into the filtered data that can appear as global temporal correlations. We demonstrate this here by simulating time-series with white noise with power-of-two length, and an arbitrary length and apply a simple low-pass filtering technique as well as the low-pass filtering method provided by AFNI. We compare the resulting Fourier power spectrum to the original.Methods
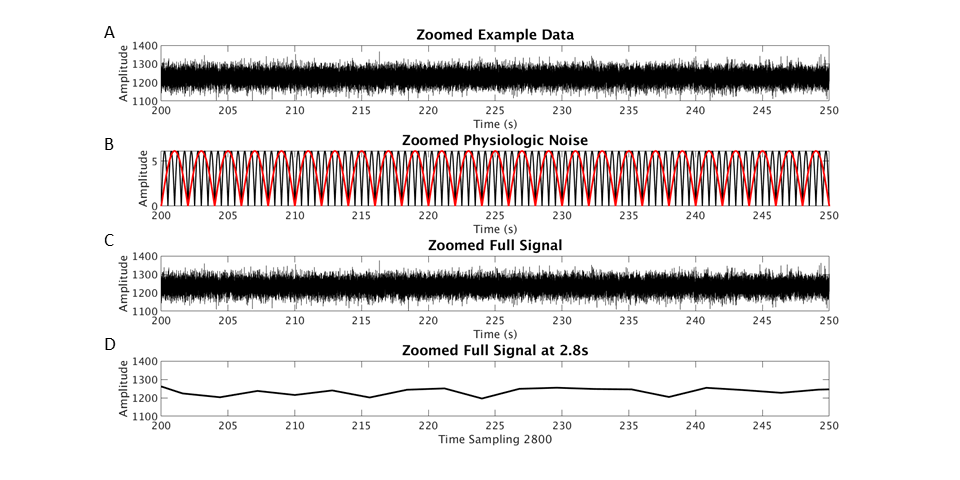
A random Gaussian signal was created with a mean and standard deviation from a typical gray matter connectivity voxel. Generic cardiac and respiratory signals were added in as rectified sinusoids at 1Hz and ¼Hz respectively with amplitude of 0.5% of the mean Gaussian signal. Then, the data was sampled at 2.8sec, a typical functional connectivity acquisition TR (Figure 1). This data was truncated to 128 and 135-point datasets and was filtered using 2 methods: Matlab’s FFT, and AFNI.
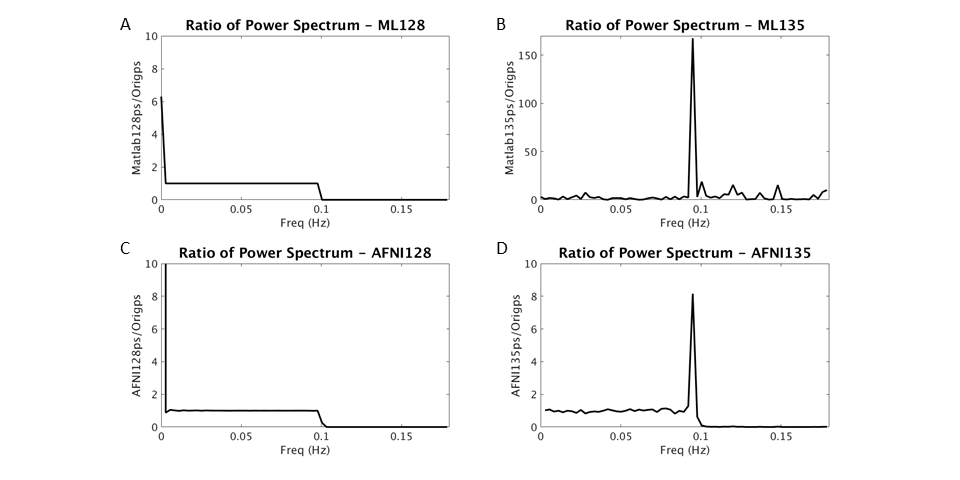
In Matlab, the Fourier transform of both datasets were taken. These were then filtered from 0-0.1Hz and transformed back into the time domain. For the AFNI processing, 3dRSFC6 was used to filter from 0-0.1Hz on both datasets. For each processing method, the Fourier power spectrum was compared to the original unfiltered Fourier power spectrum using 128-time points. The ratio of each filtered power spectrum and the original unfiltered power spectrum were plotted in each case to show the shape of the filter being applied (Figure 2).
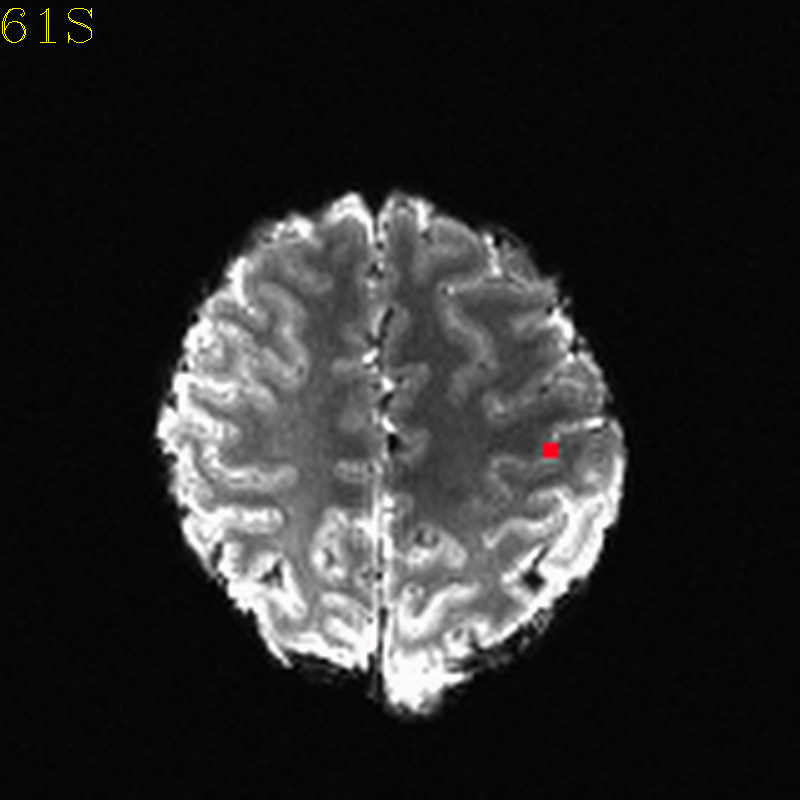
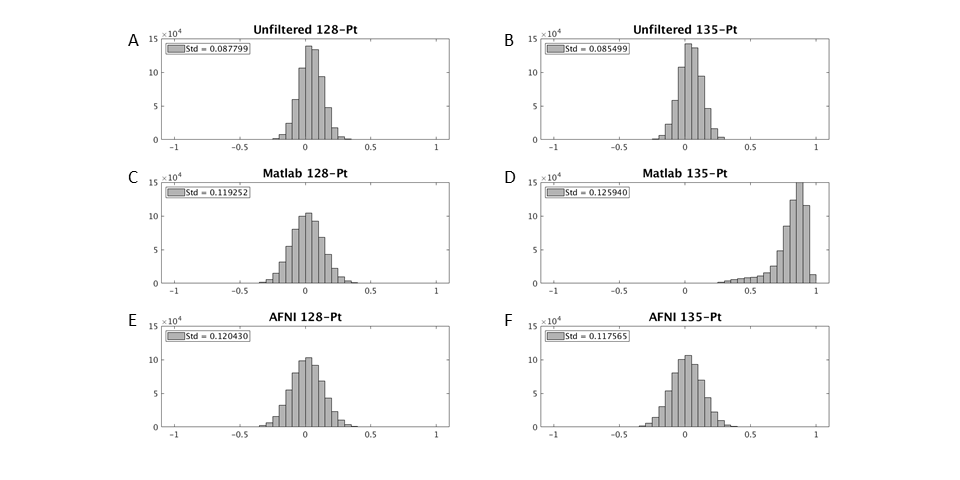
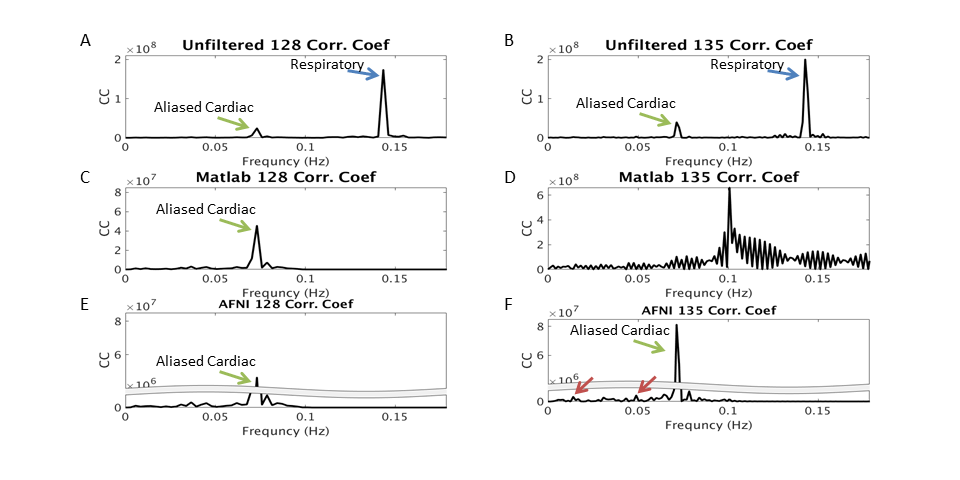
A 4-D simulated rsfMFI volume was then created and the same filtering methods were applied. A simulated seed-based correlation analysis was performed on the original unfiltered 128-point, and 135-point data as well as all 6 filtered datasets using a 9 voxel seed in the left motor region (Figure 3). A histogram of the whole brain correlations was created for each simulated data set (Figure 4). Finally, the average frequency spectrum of the correlation coefficients was computed and decomposed into frequency components for the unfiltered and filtered data allowing us to examine the impact of introducing colored noise on the correlation distribution (Figure 5)3,7.
Results
The ratio of the power spectrum of each filtered to unfiltered data highlight large deviations around 0.1Hz between the 128-point and 135-point data for the Matlab and AFNI filtering. When using power-of-two data, the power spectrum is identical to the unfiltered data until it rolls off at 0.1Hz. When power-of-two data is not used ringing is induced with a large spike near the cutoff frequency. Filtering the data increases autocorrelations in the data and thus the spread of the correlation distribution (Figure 4), as reported in prior work8. The decomposed frequency components show that the respiratory signal is removed in all filtering methods, but not the aliased cardiac component. The 135-point data resulted in extra rippling across the frequency components with the worst case being the Matlab 135-point filtering which also showed a large spike around the cutoff frequency of 0.1Hz.Discussion
We found that using temporal filtering on data that does not contain a power-of-two time points introduces more autocorrelation artifact than power of 2 data. Figures 4-5C and D show that using simple windowing in the Fourier domain works very well for power-of-two data, but can be disastrous for non-power-of-two data. Figures 2C and D show that, although much less than simple windowing, the more well-behaved AFNI temporal filtering still introduces colored noise into the frequency spectrum and this is evident in the spectral decomposition of the correlation coefficient (Figure 5F). This increases autocorrelations from undesired signal such as aliased cardiac and broadens the correlation distribution. When analyzing rsfMRI data, temporal filtering can alter your results if not used carefully.Conclusion
Resting state fMRI data acquisitions of arbitrary length can introduce spurious autocorrelations if Fourier domain filtering strategies are used. Opting for time-series that have a power-of-two in length can help to improve, in some cases dramatically, temporal filter performance.Acknowledgements
No acknowledgement found.References
1. Chen, JE, Jahanian, H, Glover, GH: Nuisance Regression of High-Frequency Functional Magnetic Resonance Imaging Data: Denoising Can Be Noisy. Brain connectivity, 7, 13-24, (2017).
2. Biswal, B, Yetkin, FZ, Haughton, VM, Hyde, JS: Functional connectivity in the motor cortex of resting human brain. Magn. Res. Med., 34, 537-41, (1995).
3. Cordes, D, Haughton, VM, Arfanakis, K, Carew, JD, Turski, PA, Moritz, CH, Quigley, MA, Meyerand, ME: Frequencies contributing to functional connectivity in the cerebral cortex in "resting-state" data. AJNR Am J Neuroradiol, 22, 1326-33, (2001).
4. Smith, SM, Beckmann, CF, Andersson, J, Auerbach, EJ, Bijsterbosch, J, Douaud, G, Duff, E, Feinberg, DA, Griffanti, L, Harms, MP, Kelly, M, Laumann, T, Miller, KL, Moeller, S, Petersen, S, Power, J, Salimi-Khorshidi, G, Snyder, AZ, Vu, AT, Woolrich, MW, Xu, J, Yacoub, E, Ugurbil, K, Van Essen, DC, Glasser, MF, Consortium, WU-MH: Resting-state fMRI in the Human Connectome Project. Neuroimage, 80, 144-68, (2013).
5. Hallquist, MN, Hwang, K, Luna, Beatriz: The Nuisance of Nuisance Regression: Spectral Misspecification in a Common Approach to Resting-State fMRI Preprocessing Reintroduces Noise and Obscures Functional Connectivity. Neuroimage, 0, 208-225, (2013).
6. Taylor, PA, Saad, ZS: FATCAT: (An Efficient) Functional and Tractographic Connectivity Analysis Toolbox. Brain Connectivity, 3(5), 523-535, (2013).
7. Cordes, D, Haughton, VM, Arkanakis, K, Wendt, GJ, Turski, PA, Moritz, CH, Quigley, MA, Meyerand, ME: Mapping Functionally Related Regions of Brain with Functional Connectivity MR Imaging. American Journal of Neuroradiology, 21(9), 1636-1644, (2000).
8. Davey, CE, Grayden, DB, Egan, GF, Johnston, LA: Filtering induces correlation in fMRI resting state data. NeuroImage, 64, 728-740, (2013).
Figures