3868
Resting-state functional connectivity estimates across scans are correlated with nuisance metrics both before and after nuisance regression1Zhejiang University, Hangzhou, China, 2University of California, San Diego, La Jolla, CA, United States
Synopsis
Nuisance regression is commonly used to reduce the influence of nuisance effects on functional connectivity (FC) estimates. Here we demonstrate that FC estimates across different scans are significantly correlated (prior to nuisance regression) with the norms of various nuisance signals including head motion regressors and signals from non-functional regions. We further show that nuisance regression does not necessarily eliminate the observed correlations between the FC estimates and nuisance norms. We demonstrate that the limited efficacy of nuisance regression is partly due to a theoretical bound that limits the difference in FC estimates obtained before and after regression.
Introduction
In resting-state fMRI, the correlations between fMRI time courses from different brain regions are used to form estimates of functional connectivity (FC).1 Nuisance regression is commonly used to reduce the effects of nuisance terms on the FC estimates on a per-scan basis.2,3,4 Preliminary work suggests that FC estimates are significantly related to nuisance norms across different scans both before and after nuisance regression.5 Here, we first show that FC estimates across scans are significantly correlated with the norms of head-motion (HM) measurements and signals from the white-matter (WM) and cerebrospinal fluid (CSF) regions. We then extend the prior work5 and demonstrate that the limited efficacy of nuisance regression is consistent with a theoretical bound on the difference between FC estimates obtained before and after nuisance regression.Methods
We used the dataset in.5 We obtained the FC estimates for each scan by computing the correlations between the posterior cingulate cortex (PCC) and every voxel in the brain (referred to as Pre FC estimates). We then defined 3 groups of regressors: (1) six HM measurements, (2) signals from the WM and CSF regions, and (3) HM+WM+CSF signals. For each group, we used multiple regression to remove the nuisance effects and computed the resulting FC estimates (Post FC estimates). For each scan ($$$k$$$), we first demeaned the individual nuisance regressors and computed their geometric norm (e.g. $$$|n|_k = \sqrt{\sum_t n(t)^2}$$$). Then, a total nuisance norm for each regressor group was computed as the root mean square (RMS) of the individual norms. Finally, we correlated the total nuisance norms with the FC estimates before and after regression. As an approximation to multiple regression, we also used the first principal component (PC) of regressors in each group as a single regressor and compared the results with respect to multiple regression. Regression with the first PC was then used to assess the validity of the theoretical bound on the difference between the FC estimates obtained before and after regression.Results
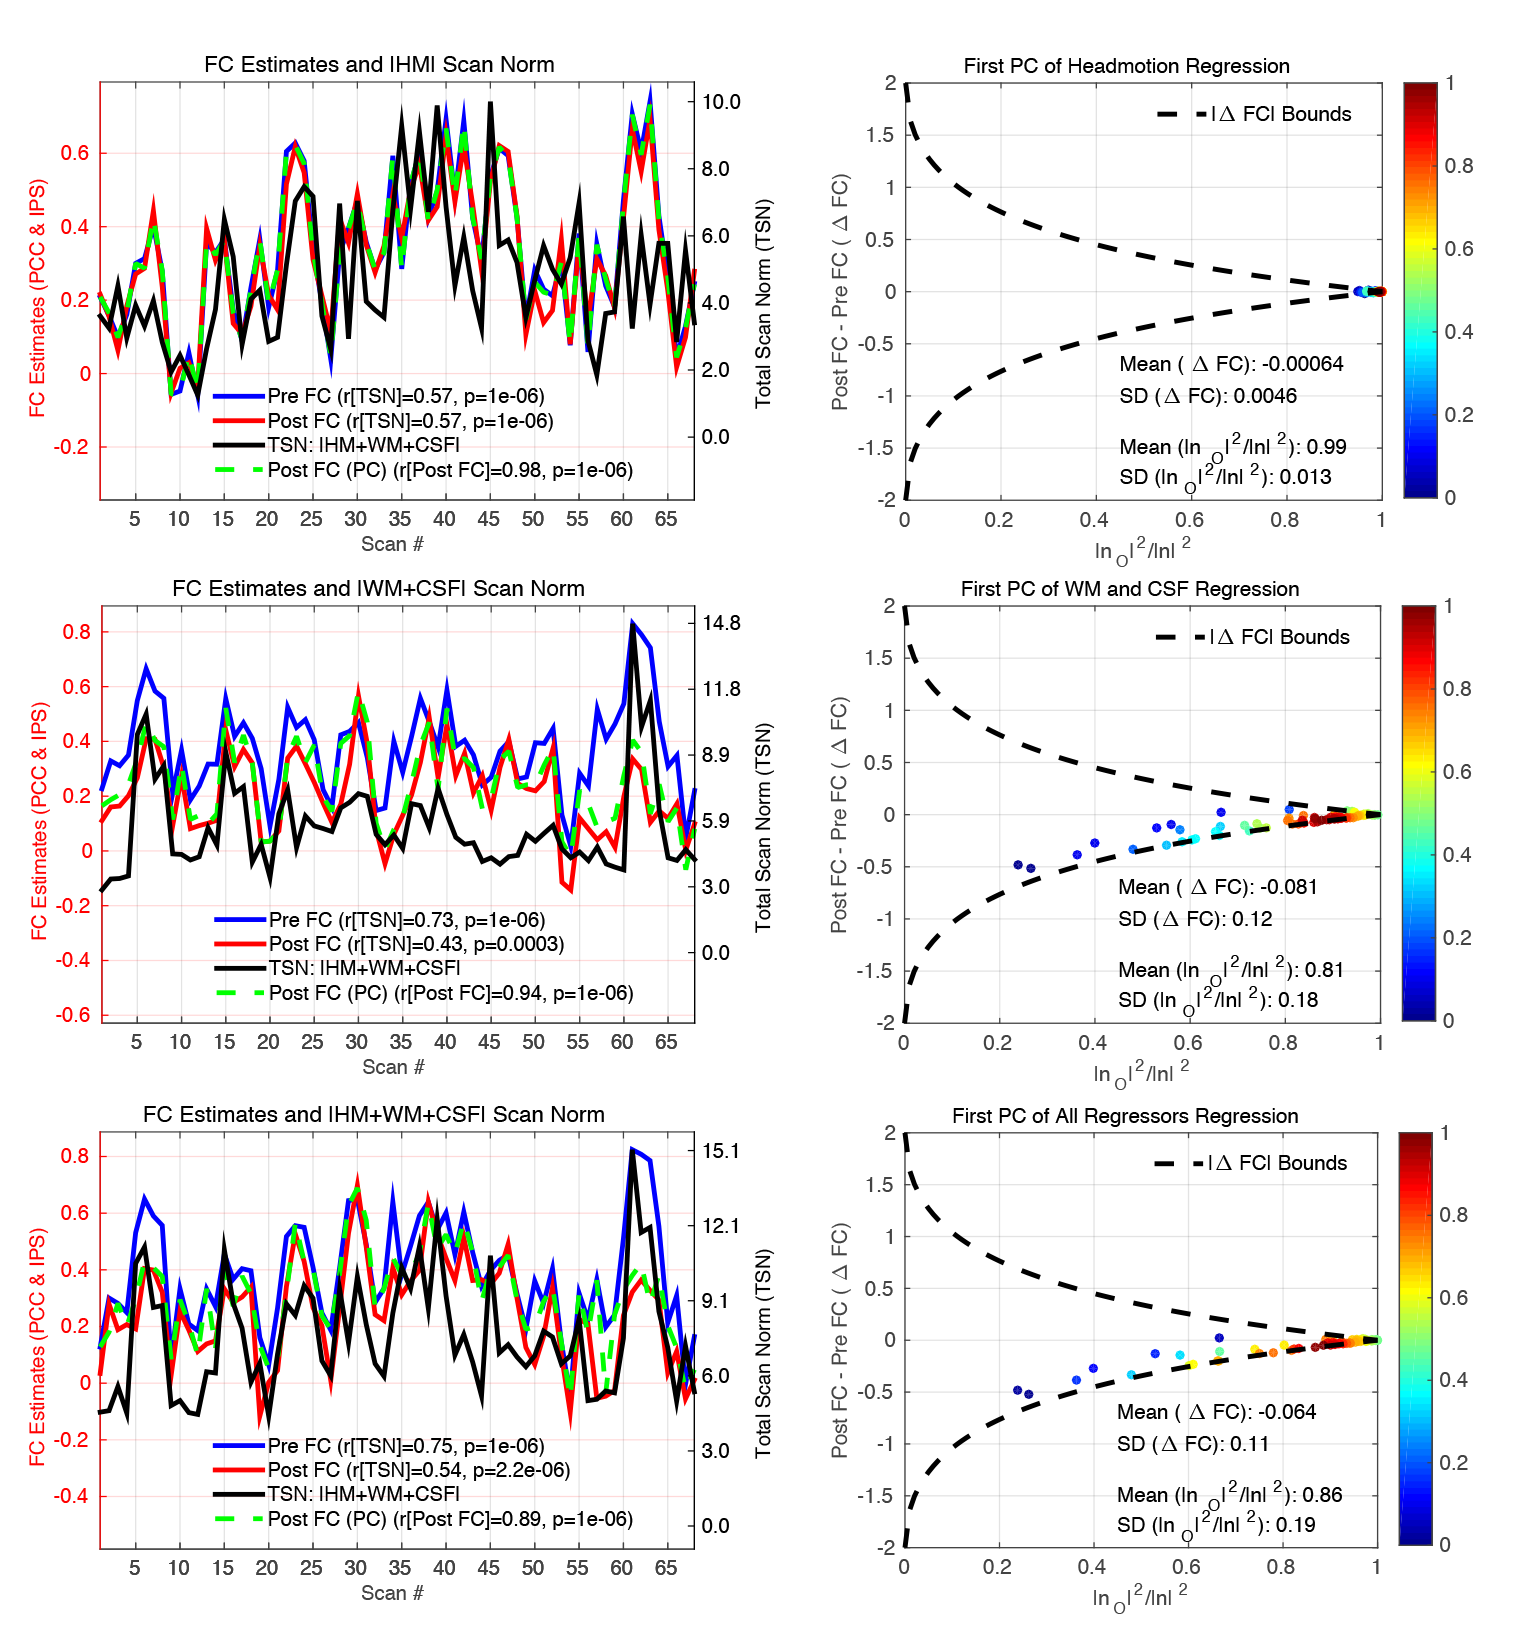
In Figure 1, the left column shows that the Pre FC estimates across 68 scans (blue lines) are significantly $$$(p<10^{-6})$$$ correlated with the nuisance norms (black lines). Each row shows a different regressor group (HM, WM+CSF, and HM+WM+CSF) and the correlation values between the Pre FC estimates and total nuisance norms are $$$r=0.57$$$, $$$r=0.73$$$, and $$$r=0.75$$$, respectively. After regression, the Post FC estimates (red lines) are still significantly $$$(p<3\times 10^{-3})$$$ correlated with the nuisance norms with $$$r=0.57$$$, $$$r=0.43$$$, and $$$r=0.54$$$ for the same regressor groups. The Post FC (PC) estimates (green line) obtained after regression with the first principal component (PC) are significantly $$$(p<10^{-6})$$$ correlated with the Post FC estimates after multiple regression, with correlation values of $$$r=0.98$$$, $$$r=0.94$$$, and $$$r=0.89$$$ for the regressor groups. This shows that the effect of regression with the first PC is a fairly good approximation to performing multiple regression. The right column shows the empirical differences in FC ($$$\Delta$$$FC=Post FC (PC) – Pre FC) versus the orthogonal nuisance fraction $$$(|n_O|^2/|n|^2)$$$ as introduced in5. This fraction measures the orthogonality between the nuisance term to the fMRI signals. For all scans, $$$\Delta$$$FC values were found to lie within the theoretical bounds previously derived for dynamic FC estimates5, consistent with the inefficacy of nuisance regression.
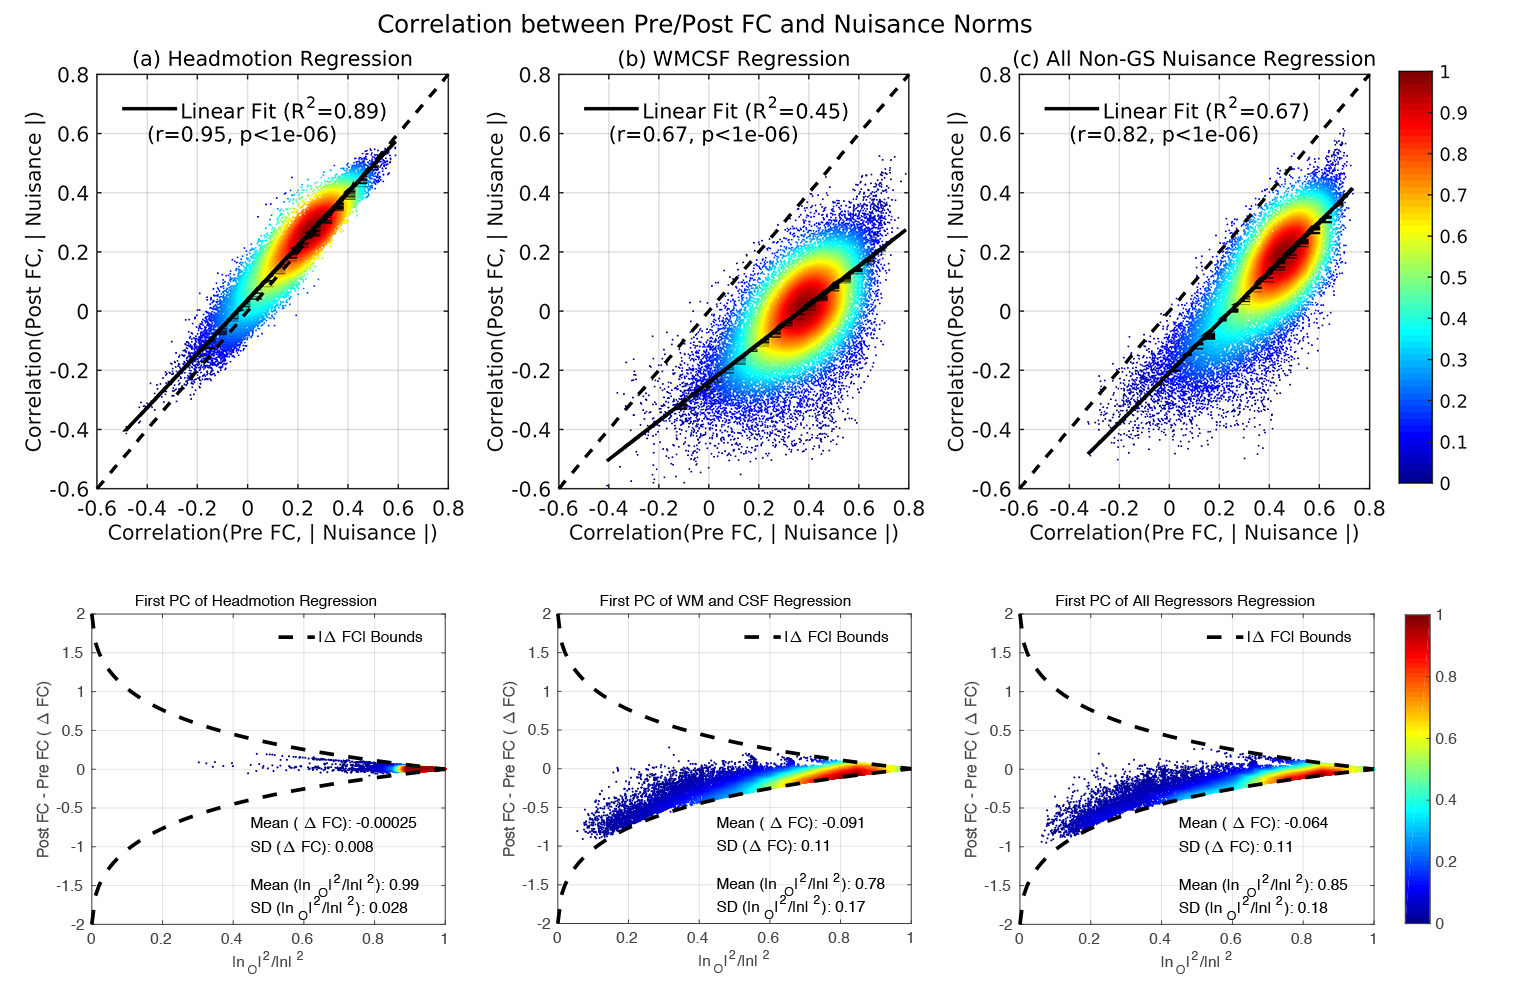
In the upper row of Figure 2, we show that there is a strong linear relationship $$$(p<10^{-6})$$$ between the correlations obtained between the Post FC and nuisance norms versus the correlations obtained between the Pre FC and nuisance norms with explained variances of $$$R^2=0.89$$$, $$$R^2=0.45$$$, and $$$R^2=0.67$$$ for the |HM|, |WM+CSF| and |HM+WM+CSF| norms, respectively. Here, each point corresponds to a correlation value between the FC estimates and nuisance norms for a single voxel. In the bottom row, we plotted the $$$\Delta$$$FC values versus the orthogonal nuisance fraction, where each point represents one voxel from one scan. Most points are located in an operating region where the theoretical bounds (dashed lines) are relatively tight. As a result, nuisance regression has a very limited effect on the FC estimates for those voxels.
Discussion
We have shown that FC estimates are correlated with nuisance norms both before and after nuisance regression. The correlation between FC estimates and nuisance norm remains after regression partly because there is a theoretical limitation on the extent to which regression can correct FC estimates. Our finding indicates that nuisance effects need to be taken into consideration when comparing FC estimates from different scans even after applying nuisance regression.Acknowledgements
This work was partly supported by NIH grant R21MH112155.References
[1] Fox, M.D., et al."Spontaneous fluctuations in brain activity observed with functional magnetic resonance imaging." Nature Reviews Neuroscience 8.9 (2007): 700.
[2] Fox, M.D., et al."The global signal and observed anticorrelated resting state brain networks." Journal of Neurophysiology 101.6 (2009): 3270-3283.
[3] Murphy, K, et al. "The impact of global signal regression on resting state correlations: are anti-correlated networks introduced?." NeuroImage 44.3 (2009): 893-905.
[4] Nalci, A, et al."Global signal regression acts as a temporal down weighting process in resting-state fMRI." NeuroImage 152 (2017): 602-618.
[5] Nalci, A, et al. "Nuisance effects and the limitations of nuisance regression in dynamic functional connectivity fMRI." NeuroImage 184 (2019): 1005-1031.
Figures