3866
Global signal measures are significantly related to functional connectivity variations across scans both before and after global signal regression1University of California, San Diego, La Jolla, CA, United States
Synopsis
Global signal regression (GSR) is widely employed to reduce the influence of nuisance factors in functional connectivity (FC) estimates. Here, we investigate the GS contributions to the variability of FC estimates across different scans. We show that correlation-based FC estimates are significantly related to the GS norms across scans. We further show that even after GSR there is still a significant relation between the GS norms and FC estimates, indicating that inter-scan FC variations can largely reflect GS effects both before and after GSR.
Introduction
In resting-state fMRI, the correlations between fMRI time courses obtained from different brain regions are used as estimates of functional connectivity (FC).1 Global signal regression (GSR) is a commonly performed preprocessing step that can improve the spatial specificity of the FC maps on a per-scan basis.2,3,4 However, it is unknown whether GSR is effective in removing the effects of GS in the variability of FC estimates across different scans. Here, we show that correlation-based FC estimates are significantly related to GS norms across scans. We show that even after performing GSR there is still a significant relation between the FC estimates and GS norms.Methods
We analyzed the data5 acquired from 68 resting-state scans. We performed standard preprocessing steps described in6 except for GSR. For each scan, we obtained FC estimates by computing correlations between the 3 seed signals obtained from the posterior cingulate cortex (PCC), medial prefrontal cortex (MPF), and auditory cortex (AUD), and every other voxel in the brain. We computed the GS norm $$$ \left(\sqrt{\sum_t|GS(t)|^2}\right)_i$$$ for each scan ($$$i$$$) and concatenated these across scans to form a GS norm vector. We then computed correlations between the GS norm vector and FC estimates for each seed-voxel pair both before and after GSR. We illustrate the GS contribution in FC estimates by using "GS contamination maps". Note that these maps are not FC maps and instead show the spatial distribution of the correlations between the FC estimates and GS norms across scans. To assess significance, we formed null distributions by permuting the scan ordering of FC estimates and GS norms over 1,000 trials. We then correlated the surrogate FC estimates and GS norms. Lastly, we compared the absolute correlations in the null distributions to the absolute correlations between the ‘empirical’ FC estimates and GS norms.
Results
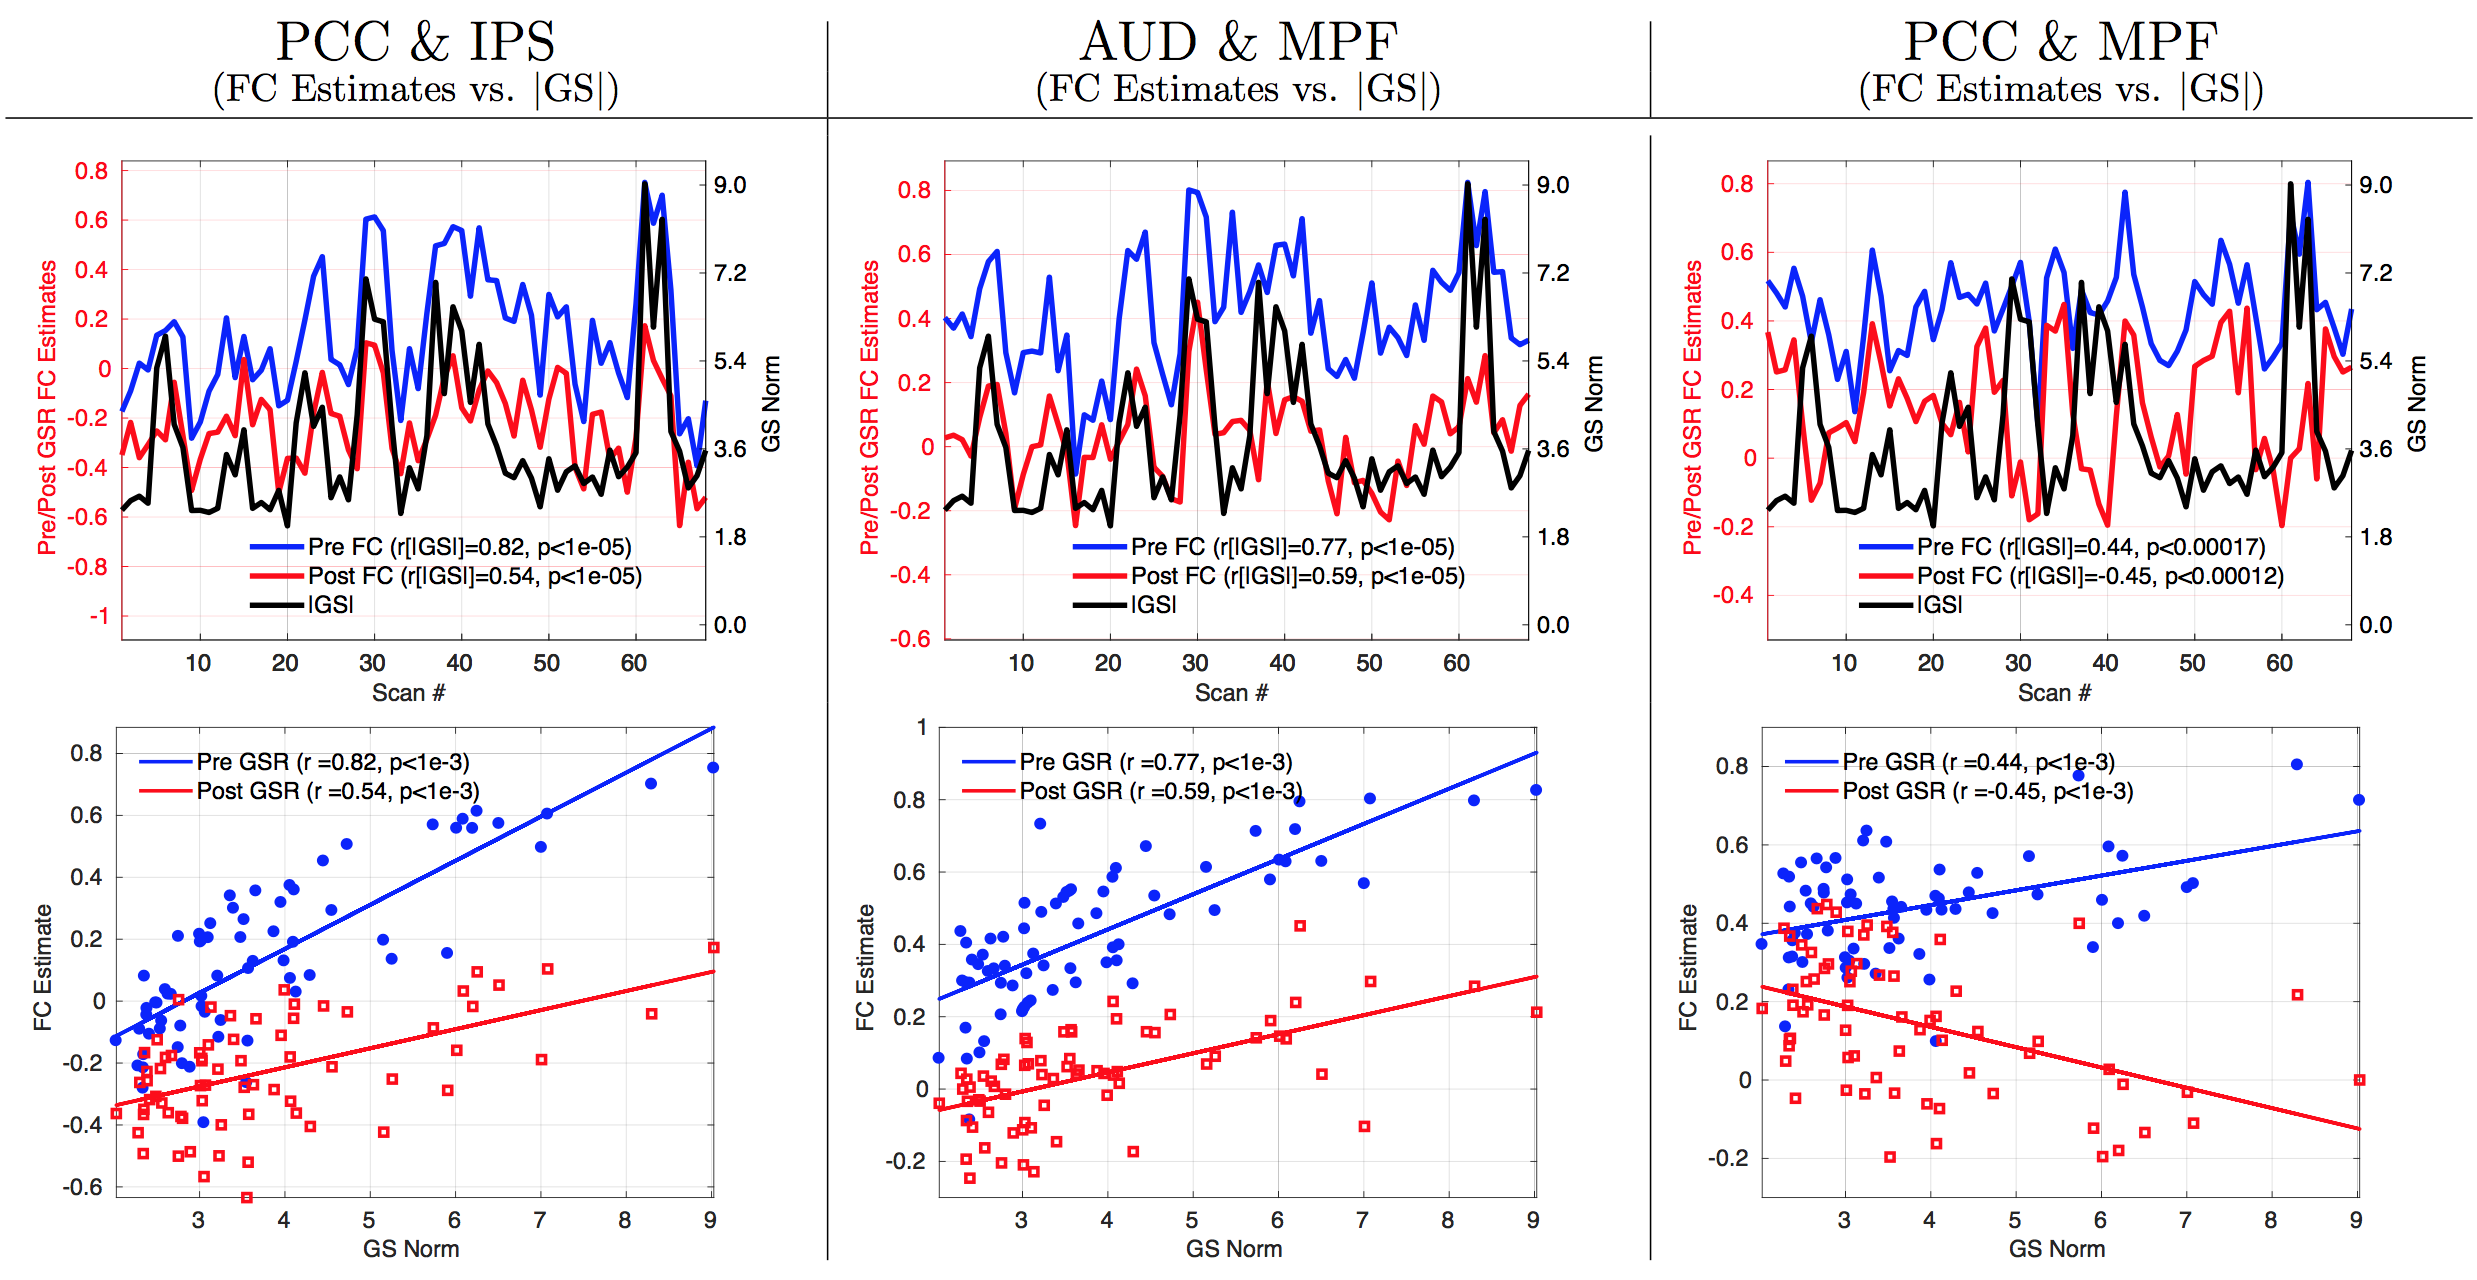
In the first row of Figure 1, the FC estimates obtained across 68 scans (labeled as Pre FC, blue lines) are significantly ($$$p<10^{-3}$$$) correlated with the GS norms (black lines) prior to GSR, where each column shows a different seed-pair. The observed correlations between the FC estimates and GS norms are $$$r=0.82$$$, $$$r=77$$$ and $$$r=0.44$$$ for the PCC&IPS, AUD&MPF and PCC&MPF pairs, respectively. After GSR, the FC estimates (Post FC, red lines) are still significantly ($$$p<10^{-3}$$$) correlated with the GS norms with $$$r=0.54$$$, $$$r=0.59$$$ and $$$r=-0.45$$$ for the same seed-pairs, respectively. The second row in Figure 1 shows the same relation between pre/post FC estimates and GS norms using scatter plots, where each point represents a scan.
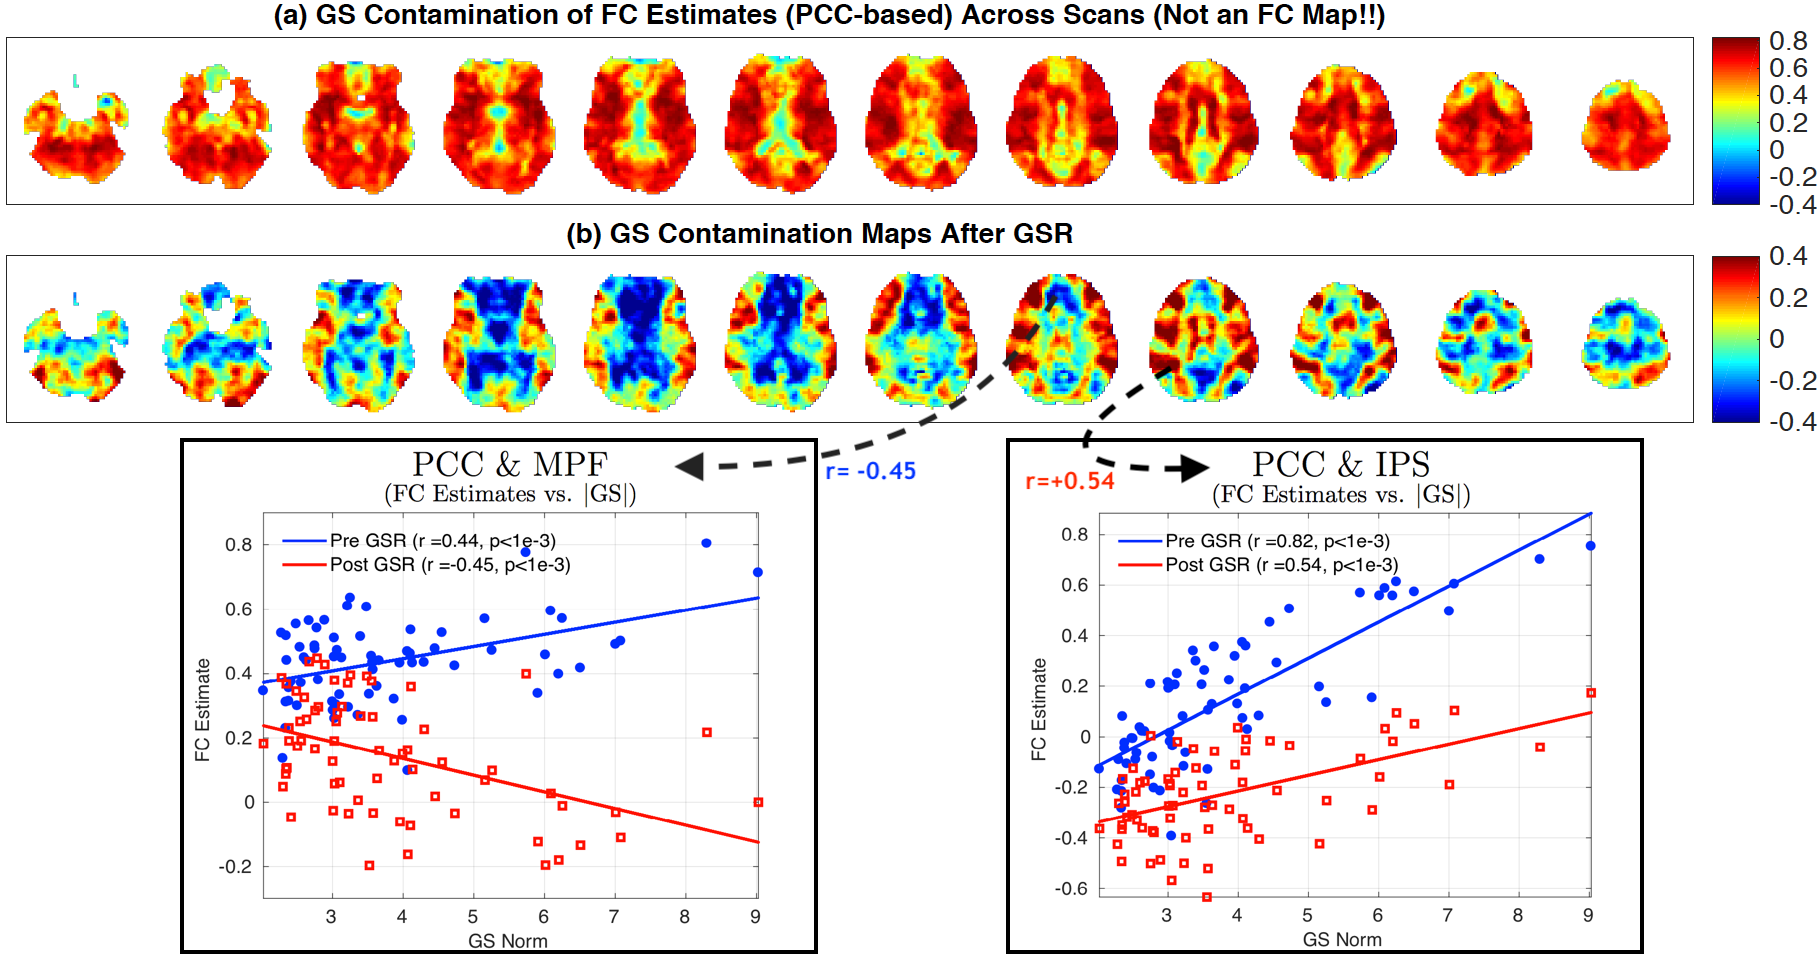
In Figure 2, we show the GS contamination maps for the PCC seed before and after GSR (Note: these are not functional connectivity maps). In panel (a), 98% of the Pre FC estimates across scans before GSR were positively and significantly ($$$p<0.05$$$, empirical p-value) correlated with the GS norms. In (b), the GS norms are still significantly correlated with the Post FC estimates after GSR with 27% of the voxels having significant correlations. The relation between the Post FC estimates and GS norms exhibits both positive and negative correlations in major functional regions. In the last row, the scatter-plots from the 1st and 3rd columns in Figure 1 were superimposed to show the GS contamination of Post FC estimates from 2 brain regions e.g. IPS ($$$r=+0.54$$$) and MPF ($$$r=-0.45$$$).
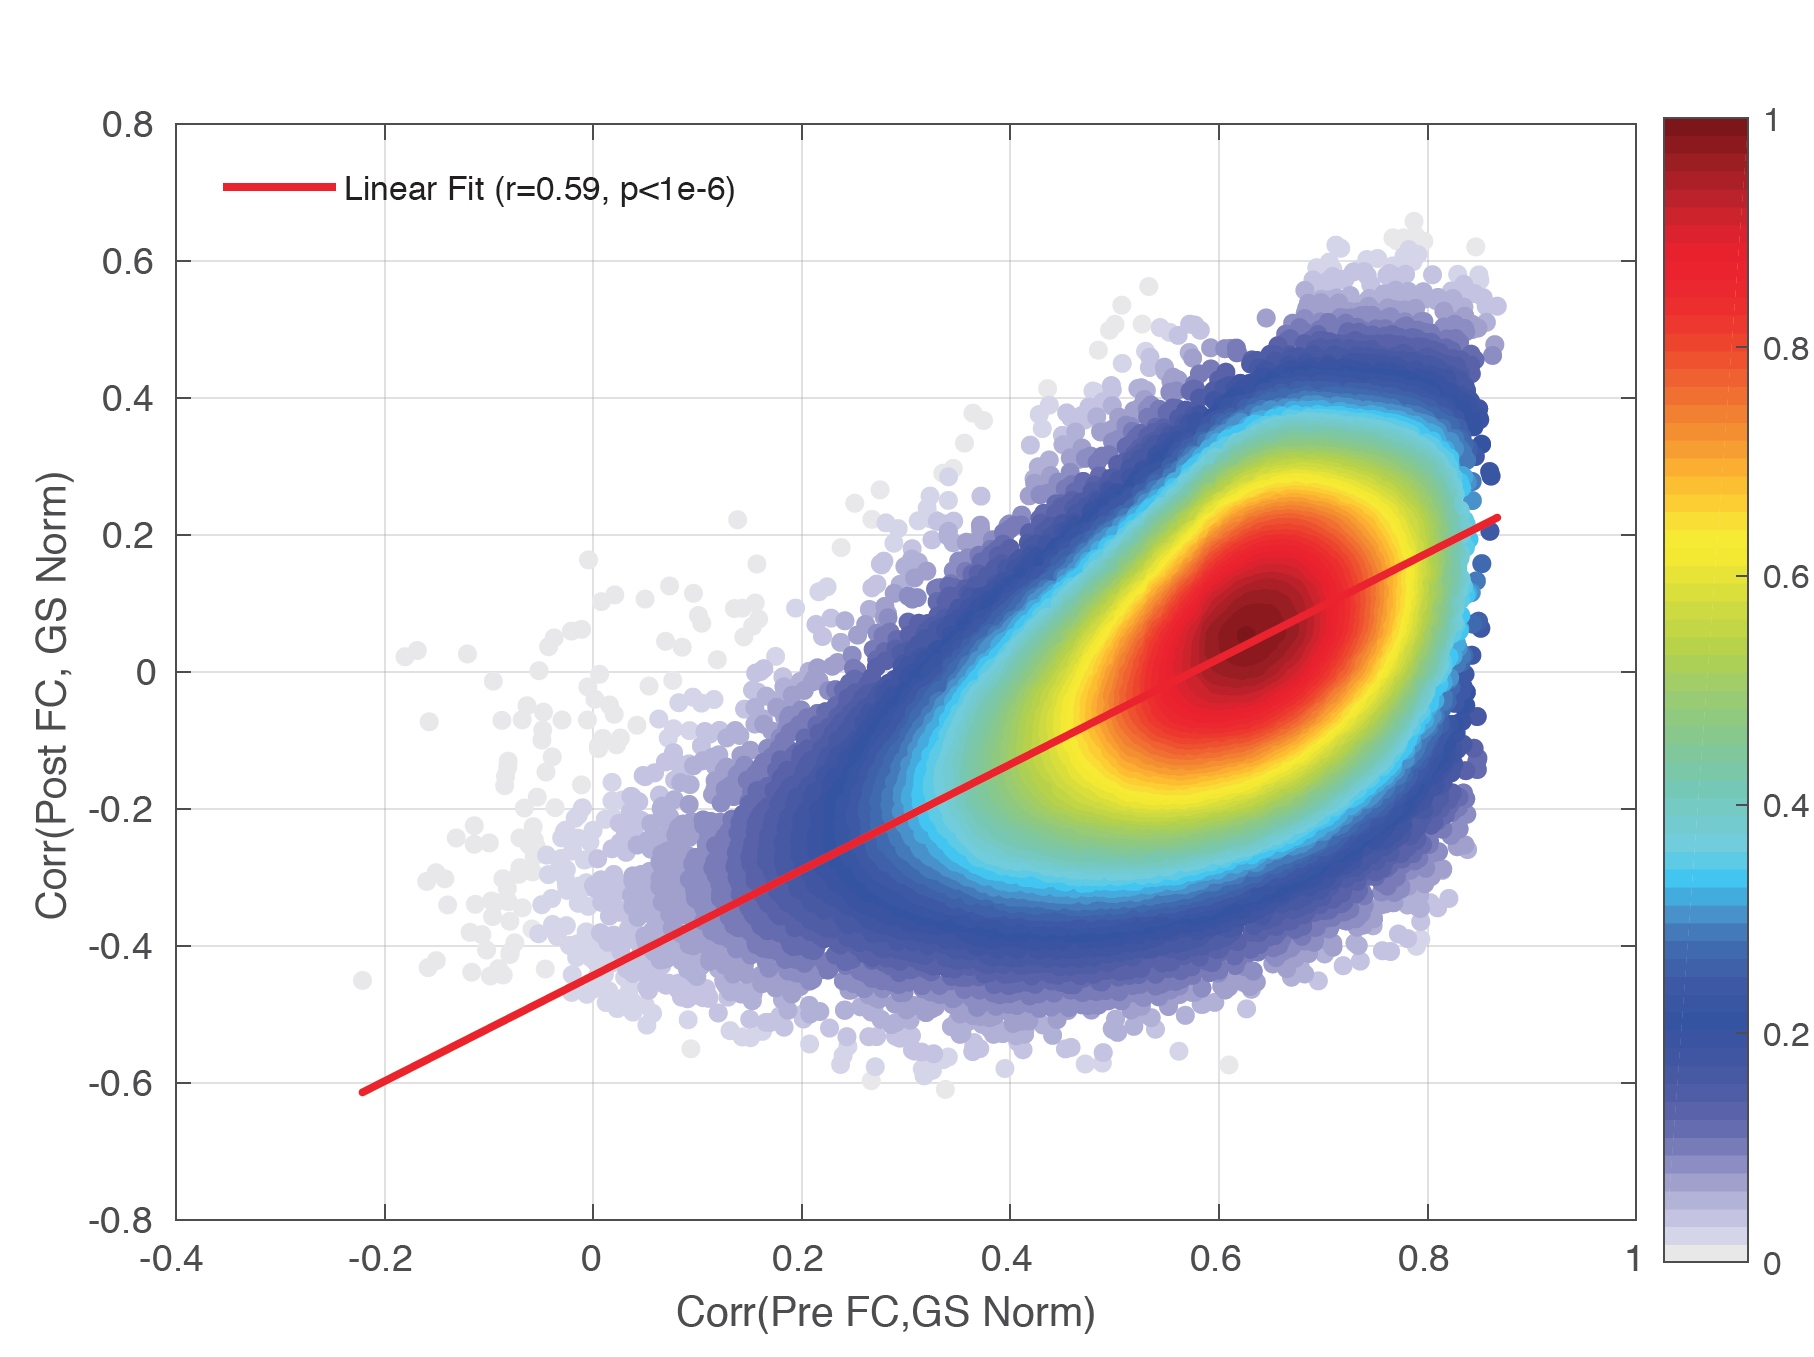
In Figure 3, we plot the correlations between the FC estimates and GS norms after GSR versus the correlations before GSR for all voxels. The linear fit ($$$r=0.59$$$, $$$p<10^{-3}$$$) indicates that GS contamination is largely present in the FC estimates after GSR.
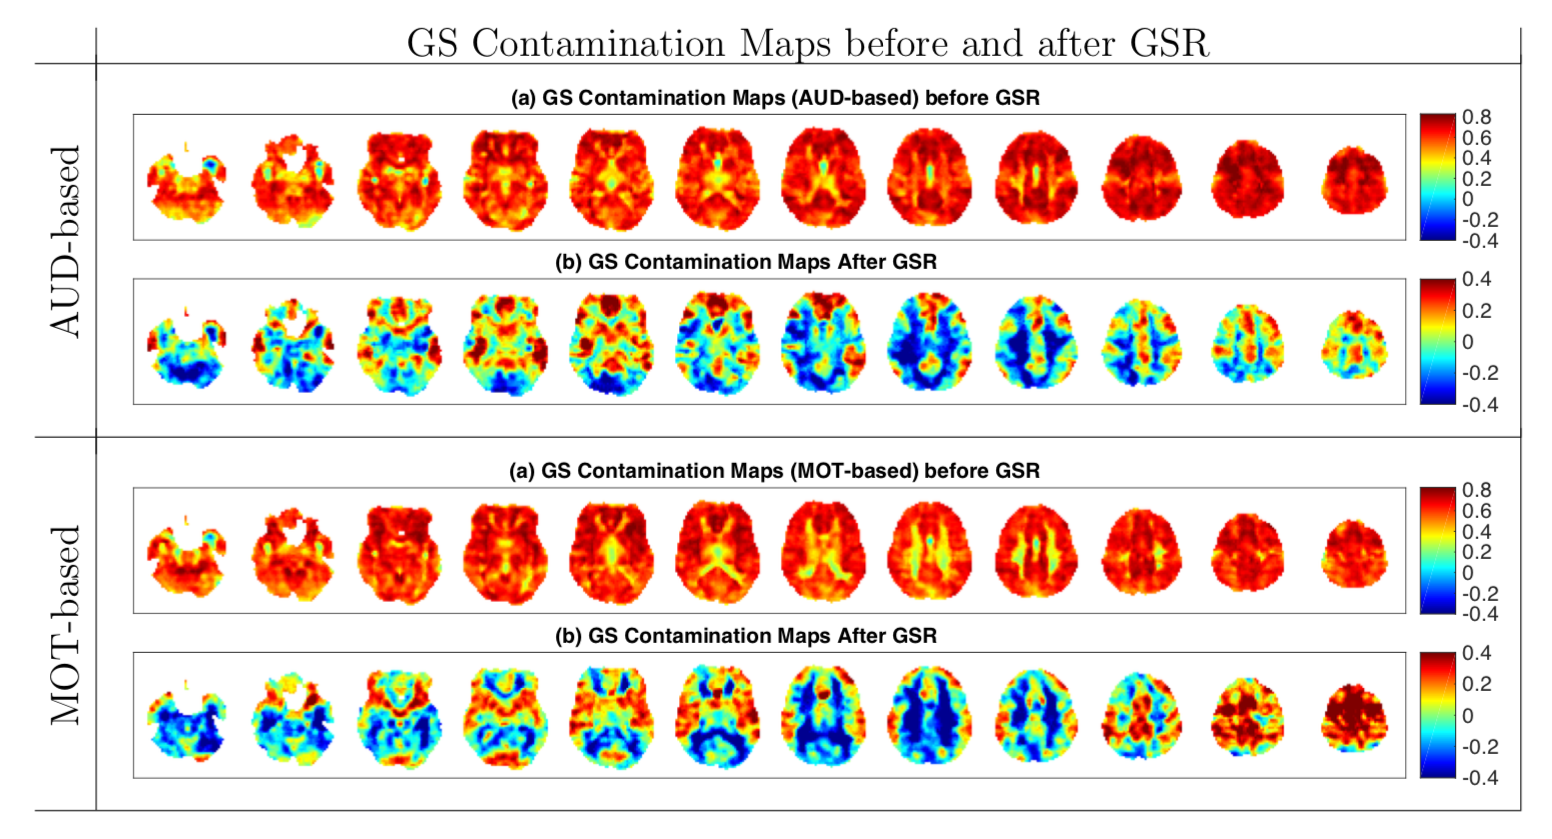
In Figure 4, we show additional GS contamination maps for other seeds. The first and second halves of the figure show the per-voxel GS contamination of FC estimates across scans when using the AUD and MOT seeds, respectively. In each half, panel (a) shows the GS contamination before GSR and (b) shows the contamination after GSR.
Discussion
We have shown that variations in FC estimates across scans largely depend on the GS norm before and after GSR. If GSR is not used, the GS contamination in FC estimates is severe (e.g. 97% PCC-based FC estimates were significantly related to GS norms). If GSR is used, GS contamination still persists in major functional regions of the brain. This means the FC estimates will largely depend on to the GS norm across scans regardless of performing GSR. As the brain regions with GS contamination correspond to important functional regions as shown in Figures 2 and 4, caution must be exercised when analyzing the FC measures across scans and groups.Acknowledgements
This work was partly supported by NIH grant R21MH112155.References
[1] Fox, M.D., et.al."Spontaneous fluctuations in brain activity observed with functional magnetic resonance imaging." Nature Reviews Neuroscience 8.9 (2007): 700.
[2] Fox, M.D., et.al."The global signal and observed anticorrelated resting state brain networks." Journal of Neurophysiology 101.6 (2009): 3270-3283.
[3] Murphy, K, et.al."The impact of global signal regression on resting state correlations: are anti-correlated networks introduced?." NeuroImage 44.3 (2009): 893-905.
[4] Nalci, A, et.al."Global signal regression acts as a temporal downweighting process in resting-state fMRI." NeuroImage 152 (2017): 602-618.
[5] Fox, M.D., et.al. "Intrinsic fluctuations within cortical systems account for intertrial variability in human behavior." Neuron 56.1 (2007): 171-184.
[6] Nalci, A, et.al. "Nuisance effects and the limitations of nuisance regression in dynamic functional connectivity fMRI." NeuroImage 184 (2019): 1005-1031.
Figures