3859
Simultaneous measurement of functional connectivity and cerebrovascular reactivity (CVR): feasibility of vasculature-normalized fcMRI1Department of Biomedical Engineering, Johns Hopkins University School of Medicine, Baltimore, MD, United States, 2The Russell H. Morgan Department of Radiology, Johns Hopkins University School of Medicine, Baltimore, MD, United States, 3Neuroimaging Research Branch, National Institute on Drug Abuse, Baltimore, MD, United States, 4Center for Vital Longevity, University of Texas at Dallas, Dallas, TX, United States, 5Department of Biomedical Imaging and Radiological Science, China Medical University, Taichung, Taiwan
Synopsis
Although widely used in fMRI to assess functional connectivity (FC), the blood-oxygenation-level-dependent (BOLD) signal is not merely a representation of neural activity, but also inherently modulated by vascular physiology. It is therefore desirable to conduct FC mapping with consideration of vascular properties, ideally in the same scan. The present work demonstrated that FC and cerebrovascular reactivity (CVR) could be obtained from BOLD images collected during a single CVR scan. Moreover, the FC indices from gas-inhalation data showed a significant correlation with CVR, suggesting the potential of using CVR as a covariate or normalization factor in interpreting FC results.
Purpose
Functional connectivity MRI (fcMRI), based on blood-oxygenation-level-dependent (BOLD) signal, is commonly used in neuroscience research. However, the BOLD signal is inherently modulated by both neural activity and vascular physiology. It is therefore desirable to conduct functional connectivity (FC) mapping with consideration of vascular properties, ideally in the same scan. This study therefore has two goals. We first aim to show that brain FC can be obtained from BOLD data collected during a cerebrovascular reactivity (CVR) scan, by regressing out the gas effects from the BOLD data and subjecting the residual time courses to the conventional FC analysis, thereby achieving the goal of deriving both FC and vascular measures from a single MRI scan. We conducted a comprehensive comparison of several FC indices derived from the gas-inhalation data relative to the resting-state data (acquired separately as a gold standard), including amplitude of low frequency fluctuation (ALFF), region-based correlation matrix, and Independent-Component-Analysis (ICA) networks. Second, we demonstrated that the FC indices derived from the gas-inhalation data showed a significant correlation with the vascular property, specifically CVR, suggesting the potential of using CVR as a covariate or normalization factor in interpreting FC results in future studies.Method
A total of 207 healthy adult subjects (50.9±19.9y, 82 males) were recruited from the Dallas Lifespan Brain Study. The hypercapnia CVR scan consisted of interleaved breathing of room-air and CO2-enriched air (5% CO2) in 1-minute blocks for 7min, while BOLD images (TR/TE =2000ms/25ms, flip-angle=80°, resolution=3.4×3.4×3.5mm) were continuously acquired. End-tidal CO2 (EtCO2) were recorded throughout the experiment. For validation of the hypercapnia FC results, a resting-state BOLD scan was performed as well.
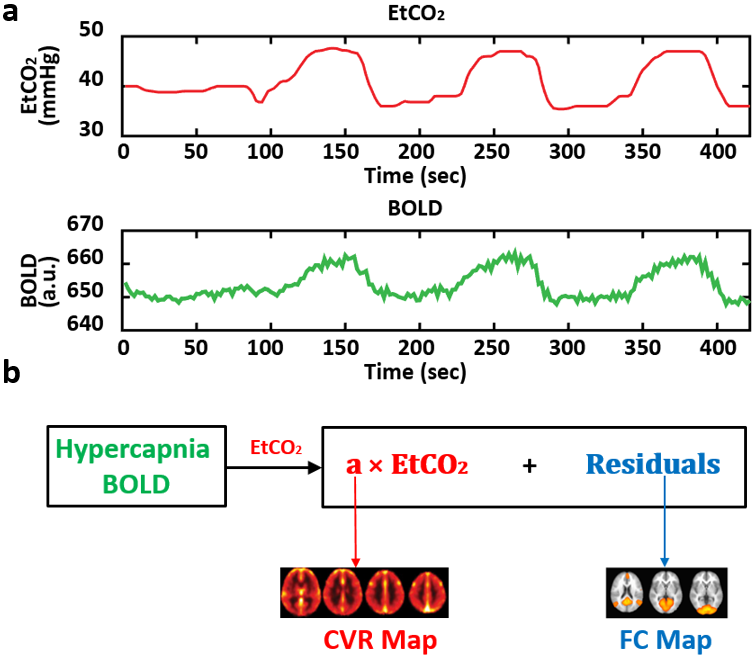
The hypercapnia BOLD data were analyzed to derive 1) a vascular measure of CVR; and 2) FC. To obtain CVR, the EtCO2 time course was synchronized to the BOLD signal and a voxel-by-voxel linear regression was used to compute a CVR map. To obtain the FC measures, the BOLD time course was first regressed against the shifted EtCO2 (Fig.1), so that the CO2 effect on the BOLD time course is removed. The residual image series were subjected to standard FC analyses.
Several FC metrics, including ALFF, region-based correlation matrix, and ICA network were computed using standard analysis pipelines described in the literature1-3, which are not detailed here due to space limits. They were compared to the corresponding indices derived from the resting-state BOLD.
Furthermore, to characterize the association between CVR and FC indexes, cross-correlation coefficients (CC) were calculated between the CVR and each of the FC indices in a network-specific fashion4,5.
Results & Discussion
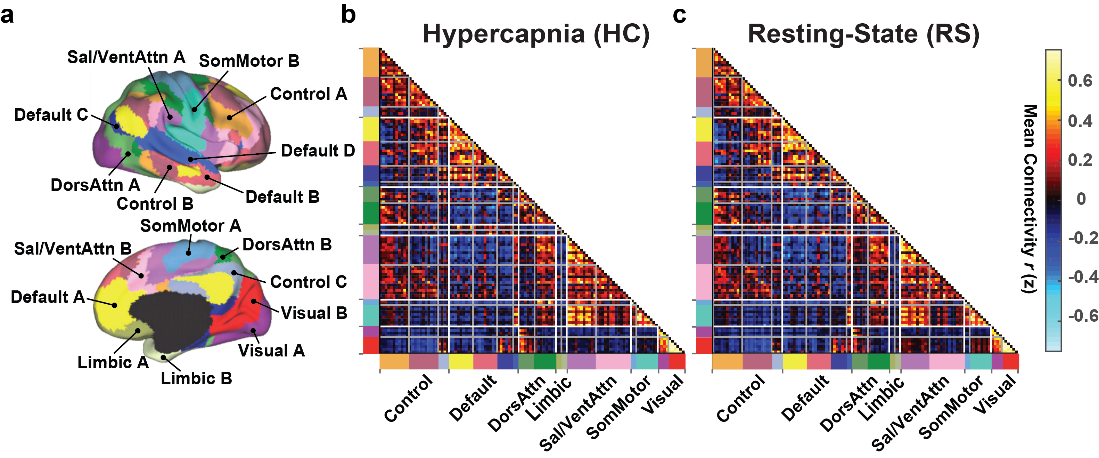
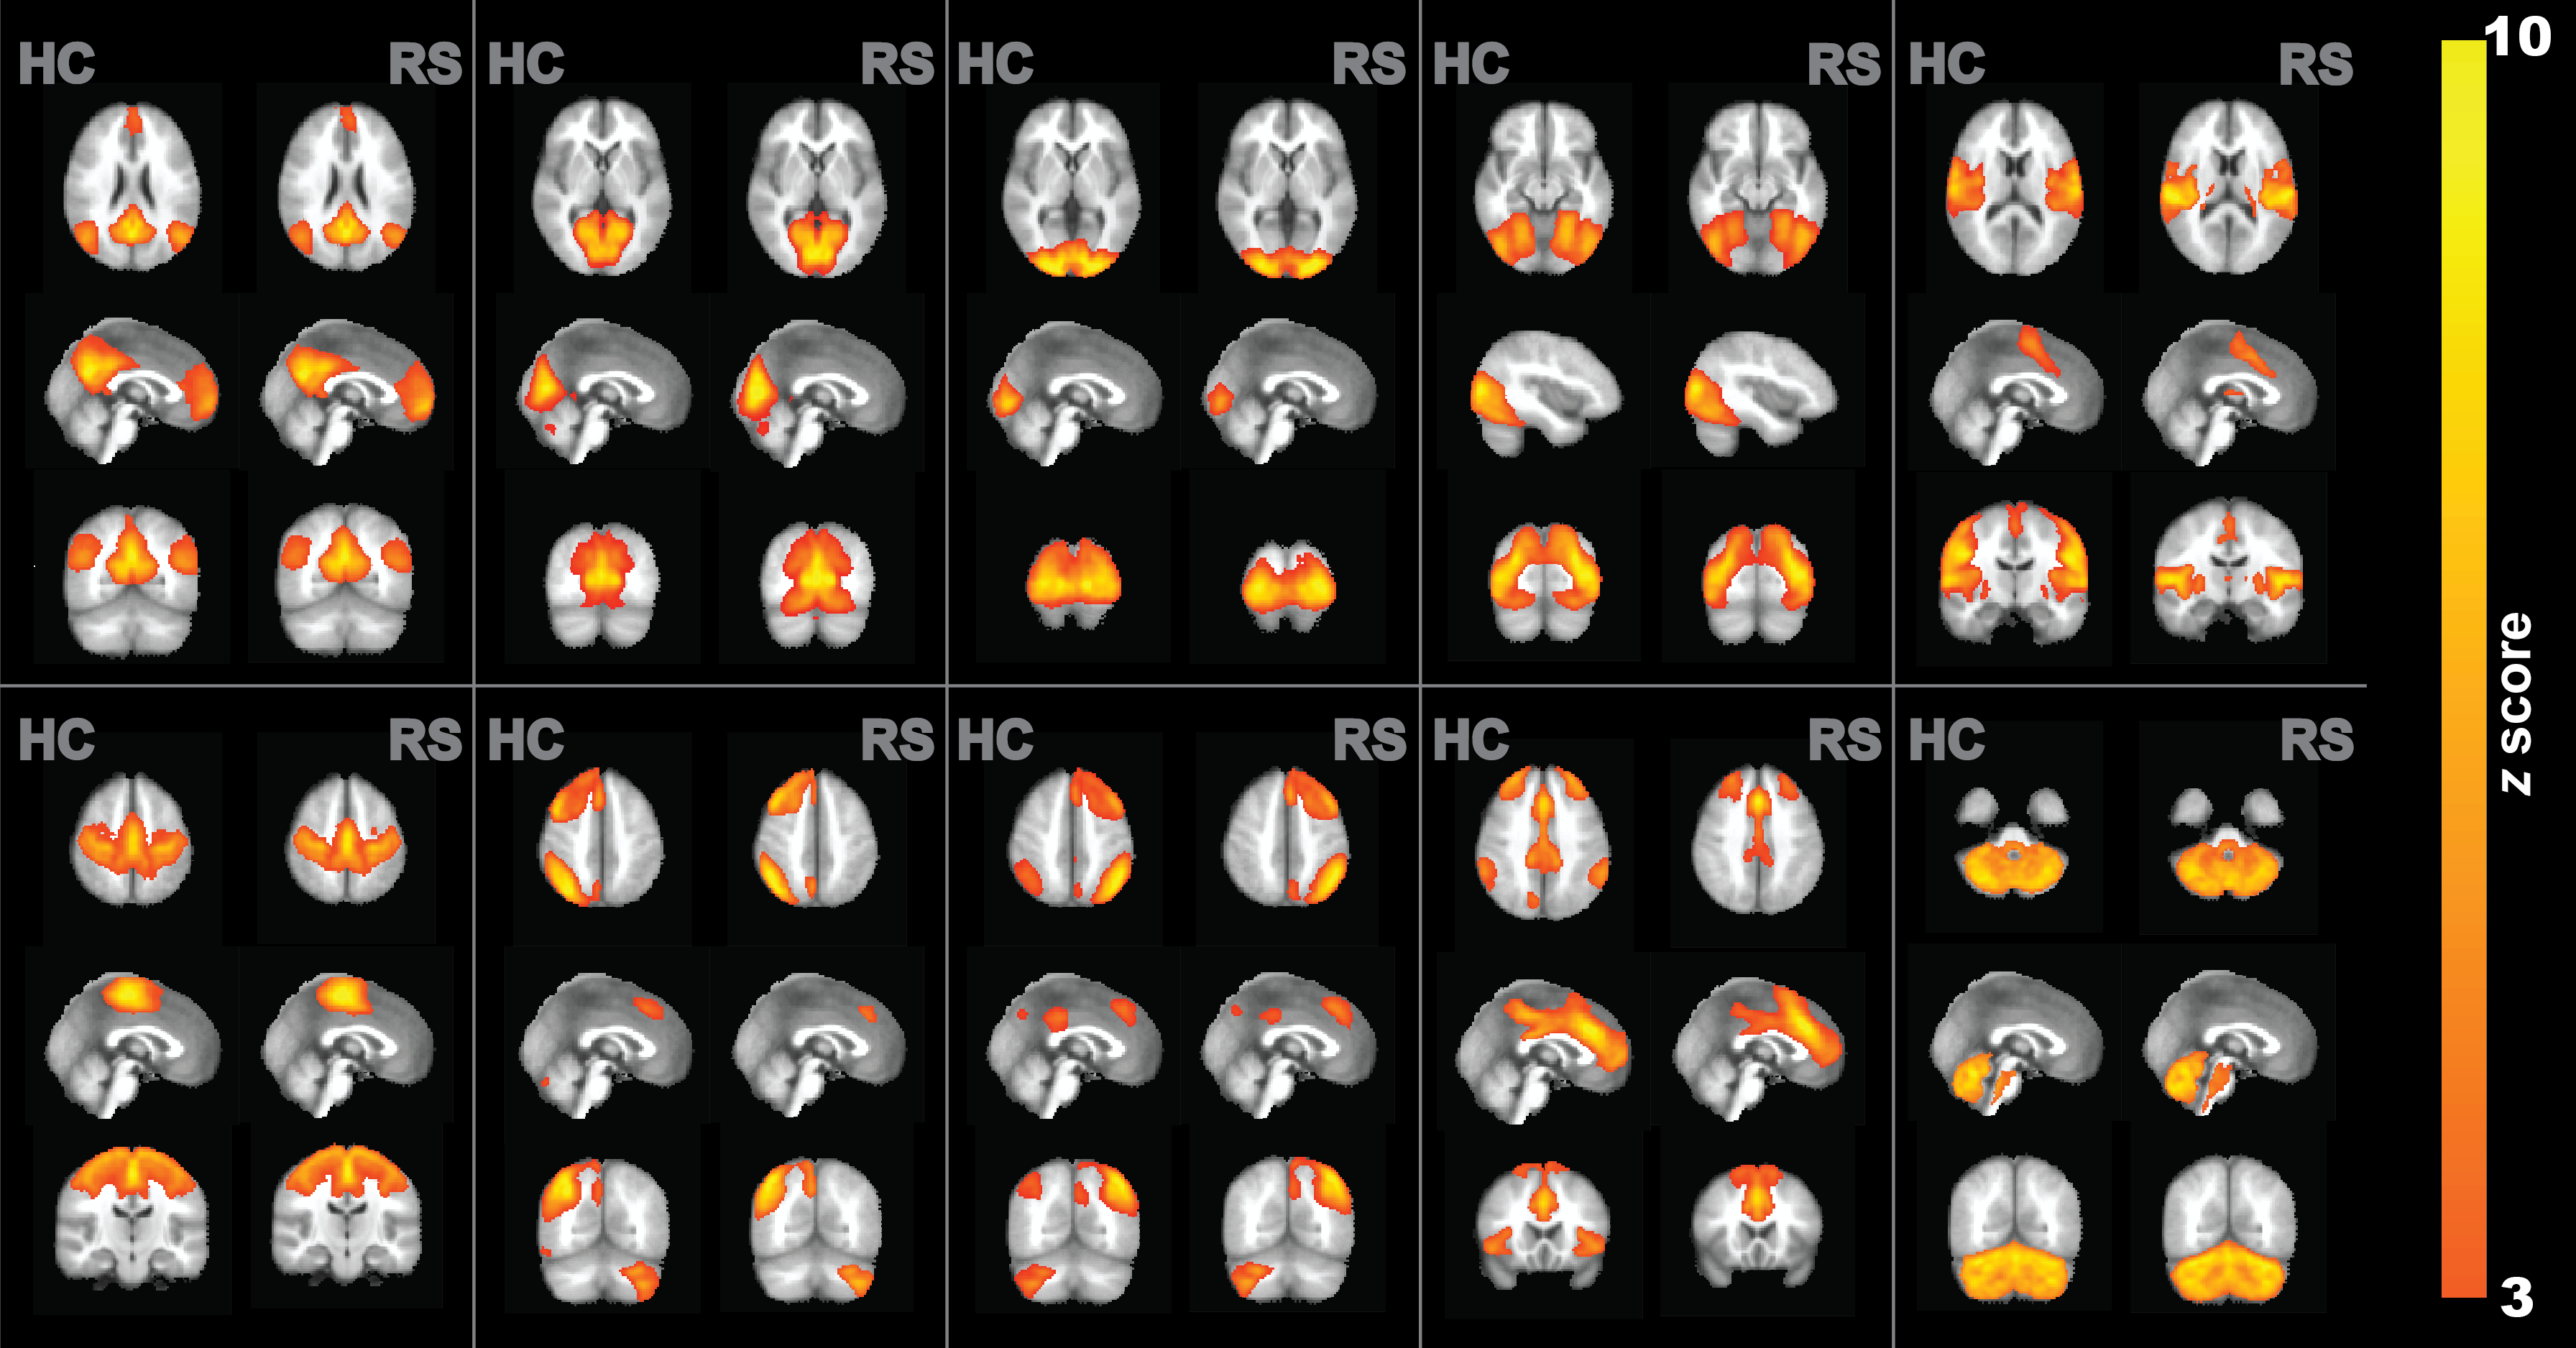
We first examined the spatial correspondence of ALFF maps derived from the hypercapnia BOLD data relative to the conventional resting-state data. On the group-averaged maps, ALFF showed a spatial correlation of 0.96 between the hypercapnia and resting-state results. On individual level, the CC were 0.43±0.02 (p<0.001) across subjects. Next, we investigated the spatial consistency of the FC matrix (Fig.2). The hypercapnia FC matrix revealed general features reported in previous literatures3 with group-level and individual-level consistency as r=0.97 and r=0.56±0.10 when compared to resting-state results. Furthermore, 10 functionally relevant independent components (ICs) were identified from hypercapnia ICA analysis (Fig.3), which showed a group-level spatial correlation of 0.85±0.11 compared to resting-state results. The individual correlations between hypercapnia and resting-state ICA maps were 0.38±0.14.
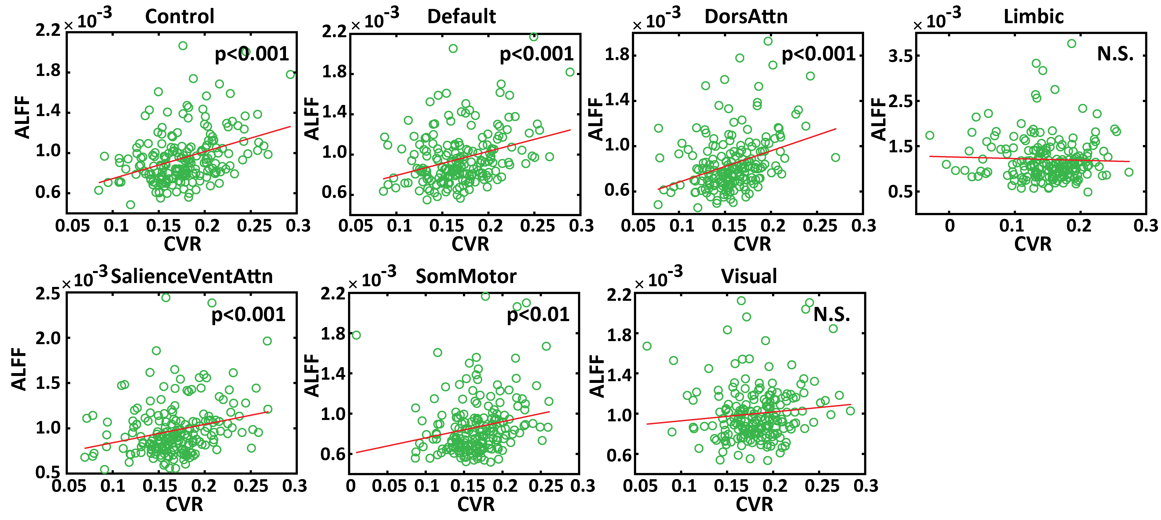
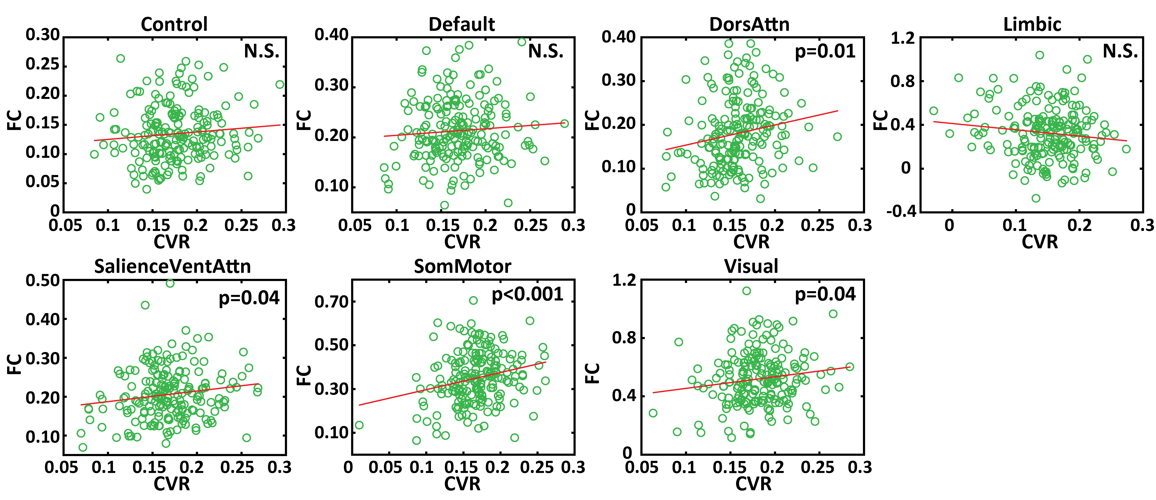
Examination of the association between ALFF and CVR (across subjects) revealed that, in 5 of the 7 networks investigated, ALFF and CVR showed a significantly positive association (Fig.4). In limbic and visual networks, there was not a correlation. For the association between within-network FC strength and CVR, we found that 4 of the 7 networks showed a significant positive correlation (Fig.5). Additionally, ICA-derived network strengths were found to positively correlate with CVR in 5 out of 10 networks investigated.
Conclusion
In this study, we demonstrated that FC derived from hypercapnia BOLD data after factoring out CO2 effect exhibited excellent agreement with resting-state FC. Our results suggested that the hypercapnia and resting-state FC maps are amplitude-wise correlated across subjects, spatially correlated across voxels, and network-level structure are highly correlated. We further showed that these two simultaneously derived indices, FC and CVR, had a significantly positive correlation across participants in several of the FC networks. Importantly our results were derived from the same MRI scan rather than requiring two separate scans. Therefore, it may be feasible that CVR values obtained from the same scan as the FC results can serve as a vascular covariate or normalization factor in future studies comparing FC across patient groups.Acknowledgements
No acknowledgement found.References
1. Zou QH, Zhu CZ, Yang Y, Zuo XN, Long XY, Cao QJ, Wang YF, Zang YF. An improved approach to detection of amplitude of low-frequency fluctuation (ALFF) for resting-state fMRI: fractional ALFF. J Neurosci Methods 2008;172:137-141.
2. Zuo XN, Kelly C, Adelstein JS, Klein DF, Castellanos FX, Milham MP. Reliable intrinsic connectivity networks: test-retest evaluation using ICA and dual regression approach. Neuroimage 2010;49:2163-2177.
3. Betzel RF, Byrge L, He Y, Goni J, Zuo XN, Sporns O. Changes in structural and functional connectivity among resting-state networks across the human lifespan. Neuroimage 2014;102 Pt 2:345-357.
4. Golestani AM, Kwinta JB, Strother SC, Khatamian YB, Chen JJ. The association between cerebrovascular reactivity and resting-state fMRI functional connectivity in healthy adults: The influence of basal carbon dioxide. Neuroimage 2016;132:301-313.
5. Kannurpatti SS, Motes MA, Biswal BB, Rypma B. Assessment of Unconstrained Cerebrovascular Reactivity Marker for Large Age-Range fMRI Studies. Plos One 2014;9.
Figures