3857
Arterial spin labeling pre-processing strategies for functional connectivity analysis1Neurology, Vanderbilt University Medical Center, Nashville, TN, United States, 2Radiology, Vanderbilt University Medical Center, Nashville, TN, United States
Synopsis
Arterial spin labeling-based functional connectivity (ASL-FC) is an emerging method to identify synchronous brain networks from perfusion fluctuations. ASL-FC may compensate for some susceptibility-induced limitations in blood-oxygenation-level-dependent (BOLD)-FC, however ASL-FC processing strategies are only beginning to be investigated. We evaluate optimized ASL-FC pre-processing for network detection, testing the effects of six pre-processing strategies by comparing spatial and temporal features with BOLD-FC in major brain networks. Spatial smoothing, surround subtraction, and global signal regression are necessary to increase ASL-FC sensitivity. ASL-FC also allows for low frequencies to be interrogated, which contain high power but are inaccessible to common BOLD-FC analyses.
Introduction
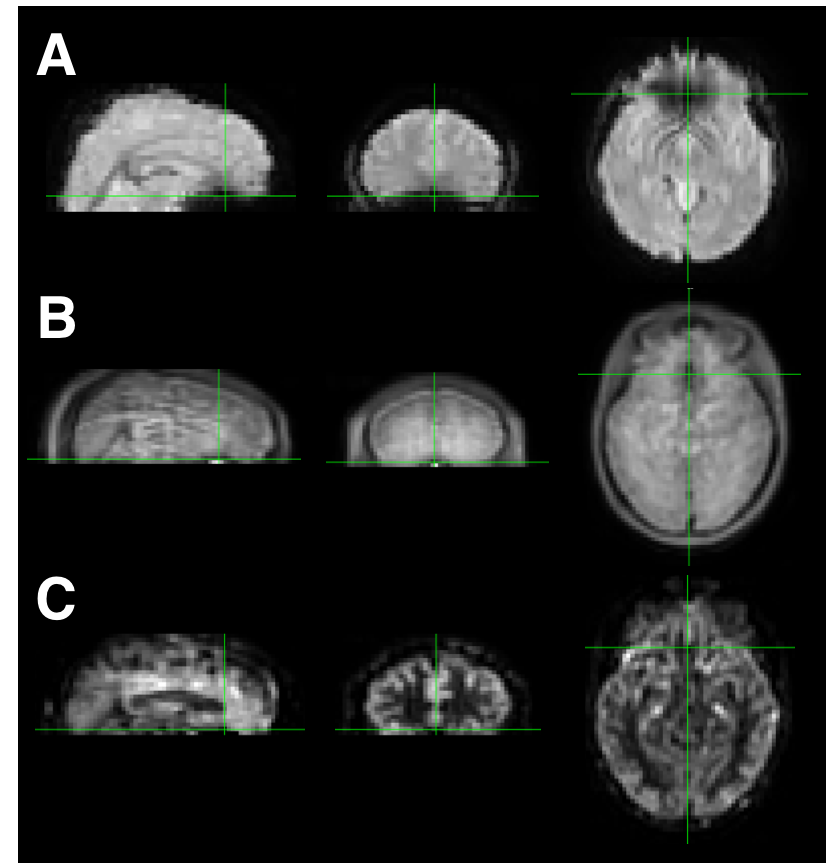
BOLD fMRI is often utilized to identify brain resting-state networks (RSNs); however, BOLD contrast originates in venous blood water, does not scale linearly with neural metabolic activity, is vulnerable to susceptibility artifacts in many functionally eloquent regions (e.g. the orbitofrontal cortex, Fig. 1), and cannot interrogate very low frequency fluctuations due to frequency filtering and required baseline drift corrections. Arterial spin labeling (ASL)-based functional connectivity (ASL-FC) is an emerging alternative to describe the spatial and temporal structure of neural networks1–4. Because ASL-FC is sensitive to perfusion directly, has a contrast not based in susceptibility and thus utilizes short TE, and utilizes pair-wise image subtraction which eliminates the requirement for drift correction, it has potential to overcome many BOLD limitations. ASL-FC limitations pertain to low SNR and temporal resolution and can complicate the realization of these benefits. Higher SNR 3D GRASE readouts, multi-pulse background suppression, and more efficient blood water labeling should permit improved detection of functional networks from ASL data5,6. However, systematic processing optimization is necessary to understand the utility of ASL-FC tools. Here, we test the effect of preprocessing strategies on RSN detection in a direct ASL-FC vs. BOLD-FC comparison, and we provide information on advantages and limitations of ASL-FC for RSN detection.Methods
Healthy adults (n=16; age=28.5±4.7 years, sex=8M/8F) provided informed consent; for reproducibility, a subgroup (n=8) of participants were scanned using an identical protocol on a separate date. We acquired 3T pseudo-continuous ASL with a 3D gradient-and-spin-echo (GRASE) readout6 (four-pulse background suppression; TR/TE=3900/13 ms, PLD=1800 ms, label duration=1800 ms, in-plane acceleration=3, through-plane acceleration=2) (Fig. 2) and 2D EPI T2*-weighted BOLD (TR/TE=2000/35 ms) at matched spatial resolution (3.8 mm isotropic) and equal duration (20 minutes). In preliminary work, it was determined that the network detection abilities using longer labeling duration and post-labeling delay outweighed limitations from the poorer temporal resolution required (which is not a major limitation given the very low frequency networks interrogated). Seed-based functional connectivity analysis was performed separately using: (1) surround subtraction, (2) frequency filtering (exclusion of frequencies>0.10 Hz), (3) global signal regression (GSR), (4) motion regression (six affine parameters), (5) spatial smoothing (5 mm full-width-at-half-maximum Gaussian), and (6) an all-of-the-above approach.
For each of these six strategies (and a baseline no-preprocessing case), three common RSNs were evaluated: the default mode network (DMN), visual network (VN), and sensorimotor network (SMN). Power spectra were calculated for each approach and network, and the overlap between ASL- and BOLD-derived RSNs was quantified using Dice similarity coefficients.
Results
Spatial smoothing improves detection of DMN (p<0.001), VN (p<0.001), and SMN (p<0.001) compared to ASL without pre-processing. Surround subtraction better identifies VN (p=0.014). The combined pre-processing strategy improves DMN (p=0.001), VN (p=0.009), and SMN (p=0.008) detection (Fig. 3). At the group level (Fig. 4), the combined pre-processing approach outperformed all other strategies (group-level Dice=0.49, 0.54, 0.33, for DMN, VN, and SMN). Reproducibility was highest for VN (mean inter-session ASL Dice score of 0.32 for the combined strategy), followed by SMN (mean Dice=0.23), and DMN (mean Dice=0.15). ASL reproducibility was significantly improved by spatial smoothing for DMN (p=0.01) and VN (p=0.002). ASL scans had a distinct power spectral profile from BOLD. For all three RSNs, BOLD power spectra showed a sharp peak close to 0.02 Hz, with power decreasing above and below 0.02 Hz. ASL power spectra showed similar power between 0 and 0.06 Hz, including frequencies below 0.01 Hz (Fig. 5).Discussion
We tested six pre-processing strategies to optimize ASL-based functional connectivity in common RSNs and compared the results to BOLD-derived RSNs. We found that spatial smoothing and surround subtraction more accurately replicate these networks at the individual level, while GSR increased ASL-BOLD overlap at the group level. The combined preprocessing strategy outperformed all others at the group level. Importantly, ASL shows power at a broad range of frequencies, including very low frequencies inaccessible to BOLD, which generally requires frequency filtering to correct for baseline drift. This may facilitate the interrogation of network features which are physiologically important but inaccessible to conventional approaches. However, ASL-FC also showed relatively low reproducibility at the subject level, likely due to the limited number of measurements acquired as demanded by the longer TR. However, ASL-FC may also provide a novel method to describe the connectivity of regions with high susceptibility artifact, such as the orbitofrontal cortex.Conclusion
Background-suppressed 3D GRASE ASL-based functional connectivity benefits from surround subtraction, GSR and spatial smoothing, but not from frequency filtering or motion regression, and when applied appropriately, can provide frequency information in a range inaccessible to BOLD.Acknowledgements
We would like to acknowledge the volunteers for this study and the staff at the Vanderbilt University Institute of Imaging Science.References
1. Dai W, Varma G, Scheidegger R, Alsop DC. Quantifying fluctuations of resting state networks using arterial spin labeling perfusion MRI. J Cereb Blood Flow Metab. 2016;36(3):463-473. doi:10.1177/0271678X15615339.
2. Jann K, Gee DG, Kilroy E, et al. Functional connectivity in BOLD and CBF data: similarity and reliability of resting brain networks. Neuroimage. 2015;106:111-122. doi:10.1016/j.neuroimage.2014.11.028.
3. Viviani R, Messina I, Walter M. Resting state functional connectivity in perfusion imaging: Correlation maps with Bold connectivity and resting state perfusion. Zuo X-N, ed. PLoS One. 2011;6(11):e27050. doi:10.1371/journal.pone.0027050.
4. Liang X, Connelly A, Calamante F. Voxel-Wise Functional Connectomics Using Arterial Spin Labeling Functional Magnetic Resonance Imaging: The Role of Denoising. Brain Connect. 2015. doi:10.1089/brain.2014.0290.
5. Petersen KJ, Claassen DO, Donahue MJ. Functional connectivity mapping using 3D GRASE arterial spin labeling MRI. In: International Society for Magnetic Resonance in Medicine. ; 2017.
6. Gunther M, Oshio K, Feinberg DA. Single-shot 3D imaging techniques improve arterial spin labeling perfusion measurements. Magn Reson Med. 2005. doi:10.1002/mrm.20580.
Figures