3856
Functional Connectome Fingerprinting using Recurrent Neural Networks Does Not Depend on the Temporal Structure of the Data1UCSD Center for Functional MRI, La Jolla, CA, United States, 2Beihang University, Beijing, China, 3Canyon Crest Academy, San Diego, CA, United States
Synopsis
Functional connectome fingerprinting can identify individuals with high accuracy with long duration scans (> 6 min) but the performance significantly degrades with shorter (72s) duration scans. It has been argued that Recurrent Neural Networks (RNN) can achieve high identification performance with short duration data by taking advantage of temporal information in the fMRI signals. We test this claim by permuting the temporal ordering of the data. We show that the RNN can achieve high accuracy for short duration data even when the temporal structure is destroyed, suggesting that the RNN performance depends primarily on the spatial correlation of the data.
Purpose
Prior work has demonstrated that functional connectome fingerprinting can identify individuals with high accuracy using long duration scans (greater than 6 minutes).1 However, the accuracy significantly decreased when the data duration was decreased to 72 seconds.1 Later work showed that Recurrent Neural Networks (RNN) were able to achieve high accuracy with short duration (72 s) data, and argued that this reflected the ability of the RNN to capture temporal features in the data.2 Here we test this claim by assessing whether an RNN can achieve high predictive performance even when the temporal order of the fMRI data is permuted.Methods
In this study, we followed the methodology in2 and used a Gated Recurrent Unit (GRU)3 based model, a variant of RNN, to identify individuals based on their resting-state fMRI data. We broke the temporal structure of the data to assess the role of the temporal information in the GRU identification process.
We used the 100 Unrelated Subjects data from the Human Connectome Project database4, which are preprocessed and split into training, validation and test sets as described in.2 The database consists of 4 resting-state scans per subject from 2 separate sessions, where each scan has 1,200 time frames with a repetition time of 0.72 seconds. We used a predefined cortex atlas of 360 regions of interest (ROI)5 and included 19 additional ROIs corresponding to subcortical parcellations as predefined in.3 We computed the average time courses within each ROI. Each average time course was then split into overlapping time segments of 100 time frames with 99% overlap between segments in the training set and 75% overlap in the validation and test sets.
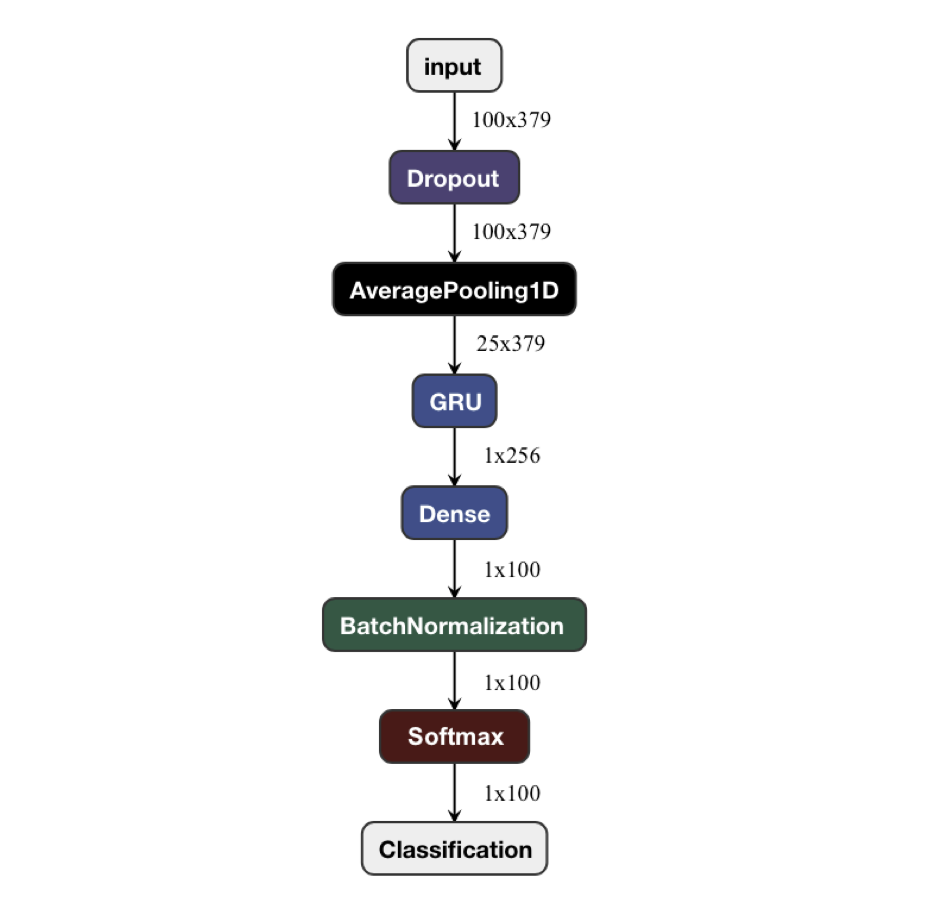
The structure of the GRU model can be seen in Figure 1. In order to test the role of temporal information on GRU based identification performance, we performed three separate tests. In the first test, denoted as the Original Time Series Test (Original TST), we preserved both spatial and temporal correlations in the data and used the original time series for both training and testing the model. In the second test, denoted as the Temporally Permuted – Same Pattern Test (SPT), we permuted the ROI time courses (1200 time frames) using the same temporal permutation pattern across ROIs. This preserved the spatial correlation (i.e. functional connectivity) of the data, but broke the temporal structure. In the third test, denoted as the Temporally Permuted – Different Pattern Test (DPT), we permuted the ROI time courses with a different temporal permutation pattern for each ROI. This destroyed both the spatial correlation and temporal structure of the data. We performed all tests with and without Global Signal Regression (GSR).
Results
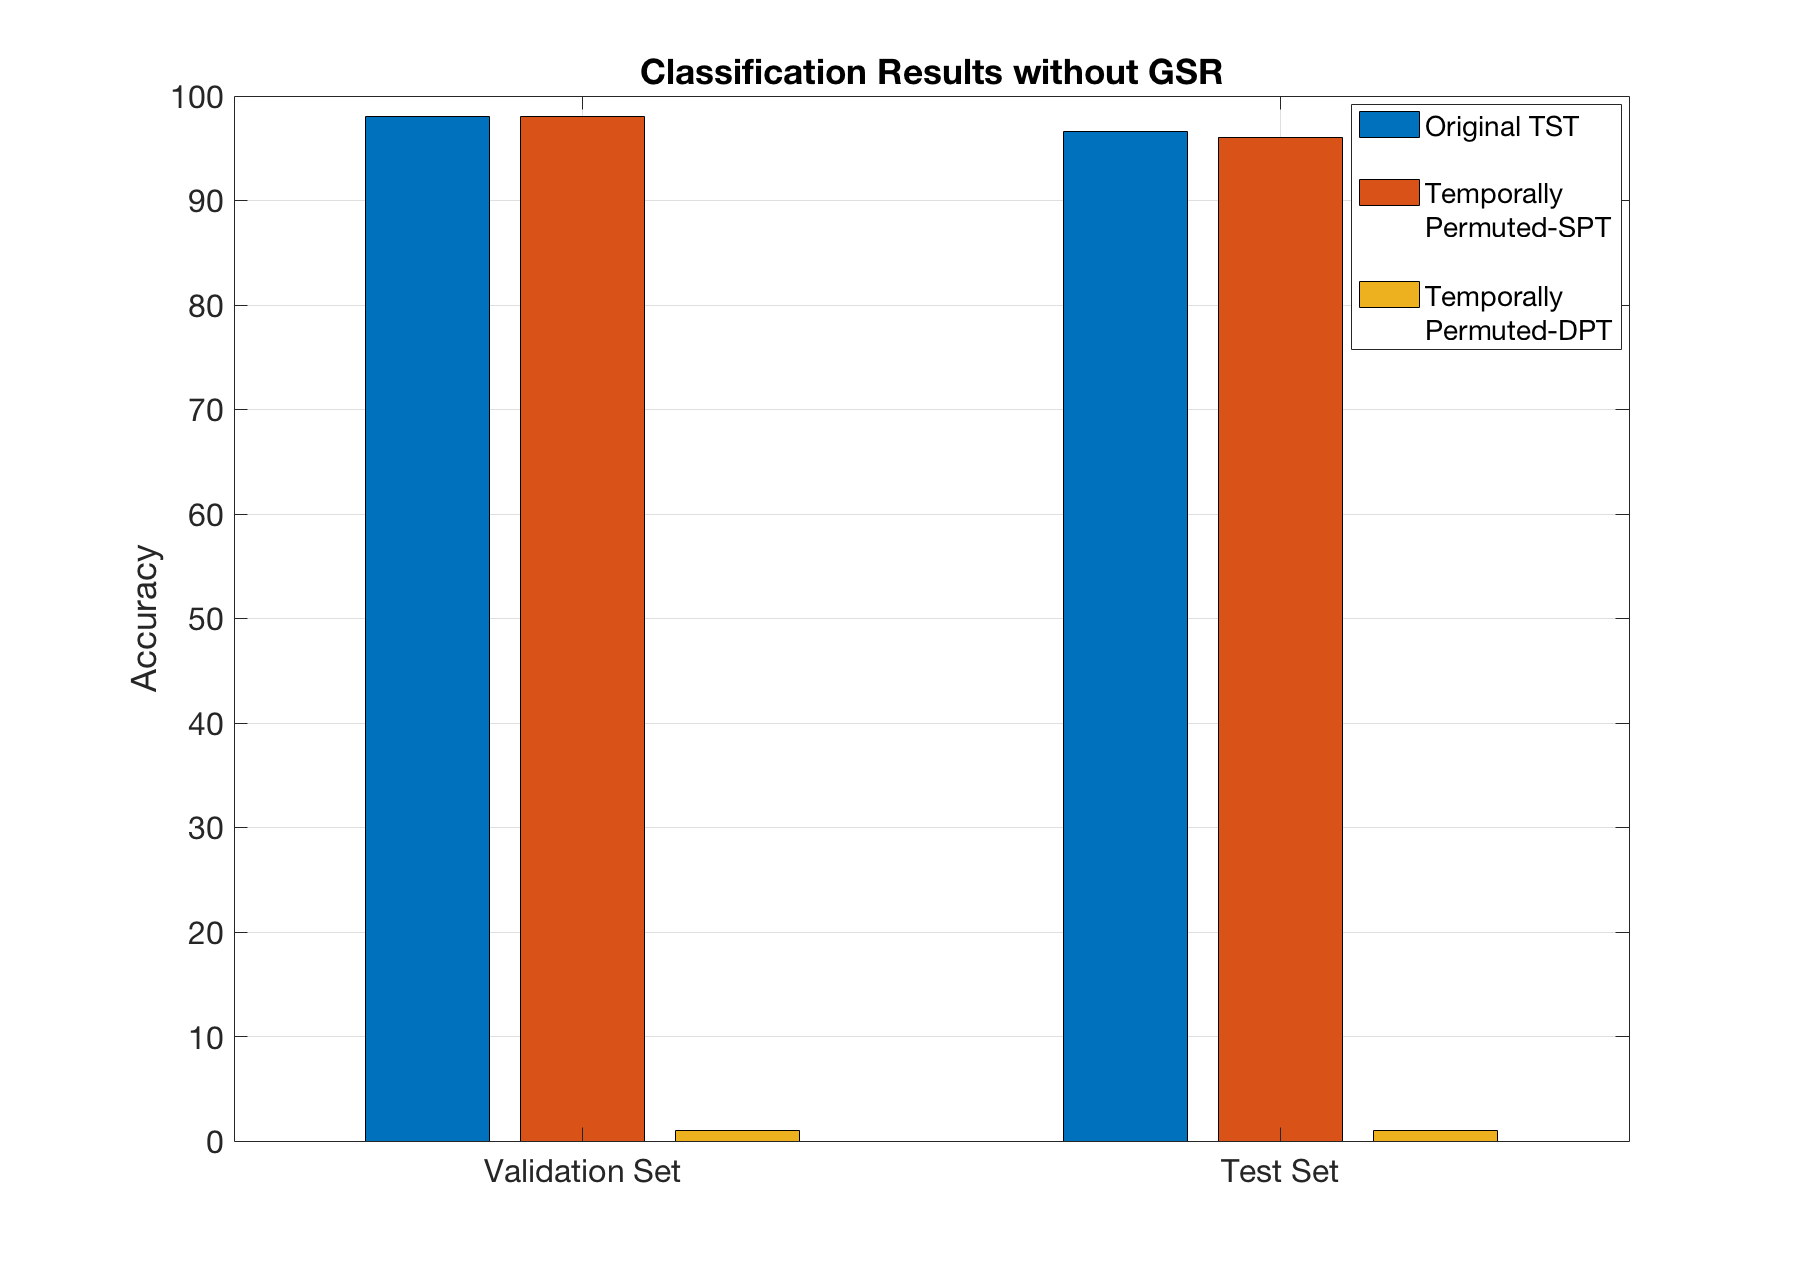
In Figure 2, we show the GRU based individual identification results without GSR. We achieve similar accuracy in the Original TST (Validation = 98.04%, Test = 96.58%) and in the Temporally Permuted – SPT (Validation = 98.04%, Test = 96.06%). However, in the Temporally Permuted – DPT, the result was equivalent to random guessing (Validation = 1.05%, Test = 1.02%) since the spatial correlation was destroyed. As a sanity check for the Temporally Permuted – SPT, we applied one temporal permutation pattern for the training set and a different one for the validation and the test sets. As expected we achieved similar accuracies (Validation = 97.82%, Test = 96.29%) to the Original TST, since here the spatial correlation is also preserved.
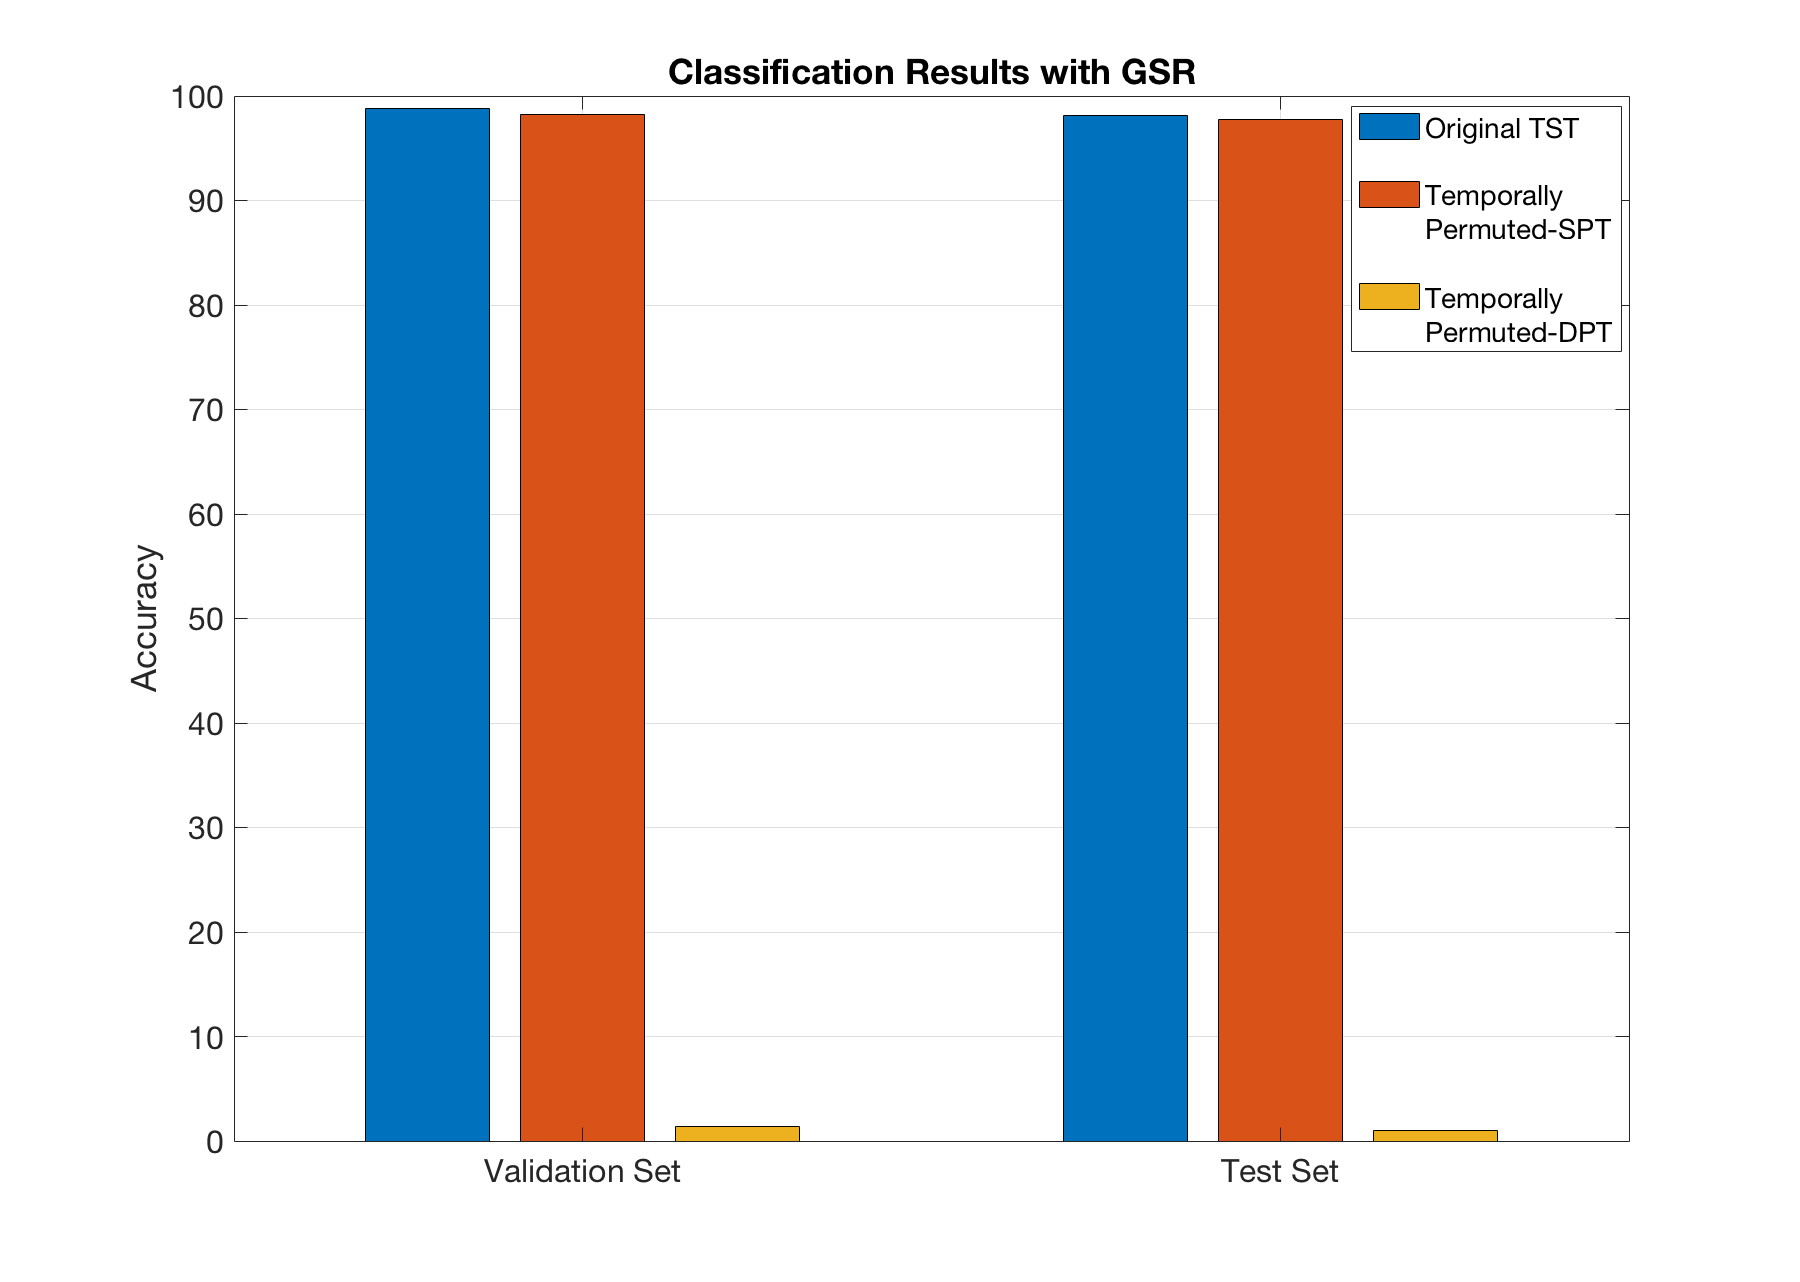
Finally, in Figure 3, we show the GRU based individual identification results with GSR. The results are similar to those obtained without GSR, with a slight increase in the identification accuracy.
Discussion
We have shown that GRU based individual identification does not depend on the temporal information in the short duration data. If the spatial correlation of the data is preserved, we achieve high identification accuracy with the GRU model. This does not depend on the temporal ordering of the data. Our results indicate that the information present in the spatial correlation of the data carries the necessary information for individual identification, and is sufficient to identify individuals even with the short duration data. Acknowledgements
This work was partly supported by NIH grant R21MH112155.References
1. Finn ES et al. Functional connectome fingerprinting: identifying individuals using patterns of brain connectivity. Nature neuroscience 2015; vol. 18,11:1664-71.
2. Chen S et al. Individual Identification Using the Functional Brain Fingerprint Detected by the Recurrent Neural Network. Brain Connectivity 2018; vol. 8, 4: 197-204.
3. Cho K et al. On the properties of neural machine translation: Encoder-decoder approaches. arXiv preprint arXiv:1409.1259, 2014.
4. Van Essen DC et al. The WU-Minn human connectome project: an overview. Neuroimage 2013; 80:62–79.
5. Glasser MF et al. A multi-modal parcellation of human cerebral cortex. Nature 2016; 536:171–178.
6. Sergey Ioffe and Christian Szegedy. Batch normalization: Accelerating Deep Network Training by Reducing Internal Covariate Shift. Proceedings of the 32nd International Conference on Machine Learning 2015; vol. 37: 448-456.
Figures