3855
Brain connectivity assessed by mechanical covarianceHaitao Ge1,2, Armando Manduca3, David T. Jones4, Clifford R. Jack JR1, John Huston III1, Richard L. Ehman1, and Matthew C. Murphy1
1Radiology, Mayo Clinic, Rochester, MN, United States, 2School of Medical Imaging, Xuzhou Medical University, Xuzhou, China, 3Physiology and Biomedical Engineering, Mayo Clinic, Rochester, MN, United States, 4Neurology, Mayo Clinic, Rochester, MN, United States
Synopsis
Introduction
The field of connectomics provides both basic insights into the brain’s organization and a framework for investigating disease-driven changes to this organization. Given the complexity of the brain’s network architecture, there is a constant demand for novel and improved methods to interrogate its organization. Magnetic resonance elastography (MRE) is a non-invasive MRI technique for measuring tissue mechanical properties1, which are thought to reflect both the composition and organization of the brain parenchyma2-6. MRE-based stiffness estimates have demonstrated sensitivity to brain disorders7, 8, normal brain development9, aging10, 11 and behavioral performance12, 13. Given this sensitivity of the brain’s mechanical properties to its function, here we tested the hypothesis that MRE-based measures of brain stiffness can be used to assess the brain’s organization. This hypothesis was evaluated in two ways. First, we tested whether mechanical connectivity, defined as the correlation across different subjects between two defined brain regions, was correlated with established measures of both structural connectivity (as assessed by DTI) and functional connectivity (as assessed by resting state fMRI) by calculating the graphical similarity between the mechanical connectivity network (MCN) with each of the structural connectivity network (SCN) and functional connectivity network (FCN). Second, we tested whether the MCN follows the expected small world organization as established in literature14. Finally, we compared the topological organization between MCN with that of the SCN and FCN.Methods
Forty-four normal aging subjects were included in this study using previously described acquisition methods10. T1-weighted images were acquired to perform AAL parcellation (78 cortical regions) to define the network nodes. To estimate the MCN, stiffness maps were computed for each subject using a neural network inversion15. Mean stiffness in each region was computed for all subjects, followed by the computation of the Pearson correlation across subjects between each pair of regions. SCN was computed from separately acquired DTI data16 using the PANDA toolbox17, in which edge strength was defined as the mean fractional anisotropy in a tract connecting a given pair of nodes. FCNs for each individual were computed from resting state fMRI data (acquired and preprocessed as previously described18) by computing the mean time course in each AAL region followed by computation of the Pearson correlation matrix. The mean SCN/FCN across individuals was computed for comparison to the MCN. All data were processed in a custom sample-based template space. In order to estimate the statistical significance of differences between MCN and SCN/FCN, we generated 1000 bootstrap networks by random resampling of subjects with replacement and recalculating the connectivity matrices19. In addition, we also generated 1000 random networks to preserve the topology of the bootstrap networks (with the same number of nodes/total edges and degree distribution) to estimate the similarity that would be expected by chance20. We employed normalized Hamming distance (Snorm) to assess the similarity in connectivity patterns between the thresholded binary networks at varying degrees of density21. Then we tested the small world topology of MCN and compared the topological organization (including clustering coefficient and global/local efficiency) between MCN and SCN/FCN at the global level. Since each of the metrics has been computed over a specific density range, we estimated the integrals of each metric curve over the range as the summary metric.Results & Discussion
Mean connectivity graphs for each method are shown in Figure 1. Similarity analysis indicated a higher similarity between MCN and SCN/FCN (about 60%) when compared with that of randomly simulated networks over the entire range of density (Fig.2, all p values <10-10). Taken together, the results suggest that the MCN reported a network architecture that is significantly correlated with those reported by SC and FC. Furthermore, the small worldness of the MCN was >1 across the entire range of density, just as observed in the SCN and FCN (Fig. 3, all p values <10-10). The small worldness for MCN appeared more closely related to that of FCN than SCN. Despite these similarities, most pair-wise comparisons of network topology were significantly different between the three methods (Fig. 4). Differences in network topology were a function of network density, but were also observed in the summary measures of topology.Conclusion
Mechanical connectivity, while significantly related to both structural and functional connectivity, also produces a network with significantly different topological measures. As such, MRE provides a potentially new window into the brain’s organization. Future studies may consider the use of multiple mechanical parameters to compute the MCN, as well as the effects of aging and disease on the mechanical connectome.Acknowledgements
This study was supported by National Institutes of Health grant R37-EB001981References
- Park, H.J. and K. Friston, Structural and functional brain networks: from connections to cognition. Science, 2013. 342(6158): 1238411.
- Freimann, F.B., et al., MR elastography in a murine stroke model reveals correlation of macroscopic viscoelastic properties of the brain with neuronal density. NMR Biomed, 2013. 26(11): 1534-9.
- Guo, J., et al., Fractal network dimension and viscoelastic powerlaw behavior: II. An experimental study of structure-mimicking phantoms by magnetic resonance elastography. Phys Med Biol, 2012. 57(12): 4041-53.
- Johnson, C.L., et al., Local mechanical properties of white matter structures in the human brain. Neuroimage, 2013. 79: 145-52.
- Lambert, S.A., et al., Bridging Three Orders of Magnitude: Multiple Scattered Waves Sense Fractal Microscopic Structures via Dispersion. Phys Rev Lett, 2015. 115(9): 094301.
- Posnansky, O., et al., Fractal network dimension and viscoelastic powerlaw behavior: I. A modeling approach based on a coarse-graining procedure combined with shear oscillatory rheometry. Phys Med Biol, 2012. 57(12): 4023-40.
- Murphy, M.C., et al., Decreased brain stiffness in Alzheimer's disease determined by magnetic resonance elastography. J Magn Reson Imaging, 2011. 34(3): 494-8.
- Streitberger, K.J., et al., Brain viscoelasticity alteration in chronic-progressive multiple sclerosis. PLoS One, 2012. 7(1): e29888.
- McIlvain, G., et al., Mechanical properties of the in vivo adolescent human brain. Dev Cogn Neurosci, 2018. 34: 27-33.
- Arani, A., et al., Measuring the effects of aging and sex on regional brain stiffness with MR elastography in healthy older adults. Neuroimage, 2015. 111: 59-64.
- Sack, I., et al., The impact of aging and gender on brain viscoelasticity. Neuroimage, 2009. 46(3): 652-7.
- Johnson, C.L., et al., Double dissociation of structure-function relationships in memory and fluid intelligence observed with magnetic resonance elastography. Neuroimage, 2018. 171: 99-106.
- Schwarb, H., et al., Medial temporal lobe viscoelasticity and relational memory performance. Neuroimage, 2016. 132: 534-541.
- Bassett, D.S. and E. Bullmore, Small-world brain networks. Neuroscientist, 2006. 12(6): 512-23.
- Murphy, M.C., et al., Artificial neural networks for stiffness estimation in magnetic resonance elastography. Magn Reson Med, 2018. 80(1): 351-360.
- Schwarz, C.G., et al., Improved DTI registration allows voxel-based analysis that outperforms tract-based spatial statistics. Neuroimage, 2014. 94: 65-78.
- Cui, Z., et al., PANDA: a pipeline toolbox for analyzing brain diffusion images. Front Hum Neurosci, 2013. 7: 42.
- Murphy, M.C., et al., Regional brain stiffness changes across the Alzheimer's disease spectrum. Neuroimage Clin, 2016. 10: 283-90.
- Gong, G., et al., Convergence and divergence of thickness correlations with diffusion connections across the human cerebral cortex. Neuroimage, 2012. 59(2): 1239-48.
- Maslov, S. and K. Sneppen, Specificity and stability in topology of protein networks. Science, 2002. 296(5569): 910-3.
- Hosseini, S.M. and S.R. Kesler, Comparing connectivity pattern and small-world organization between structural correlation and resting-state networks in healthy adults. Neuroimage, 2013. 78: 402-14.
Figures
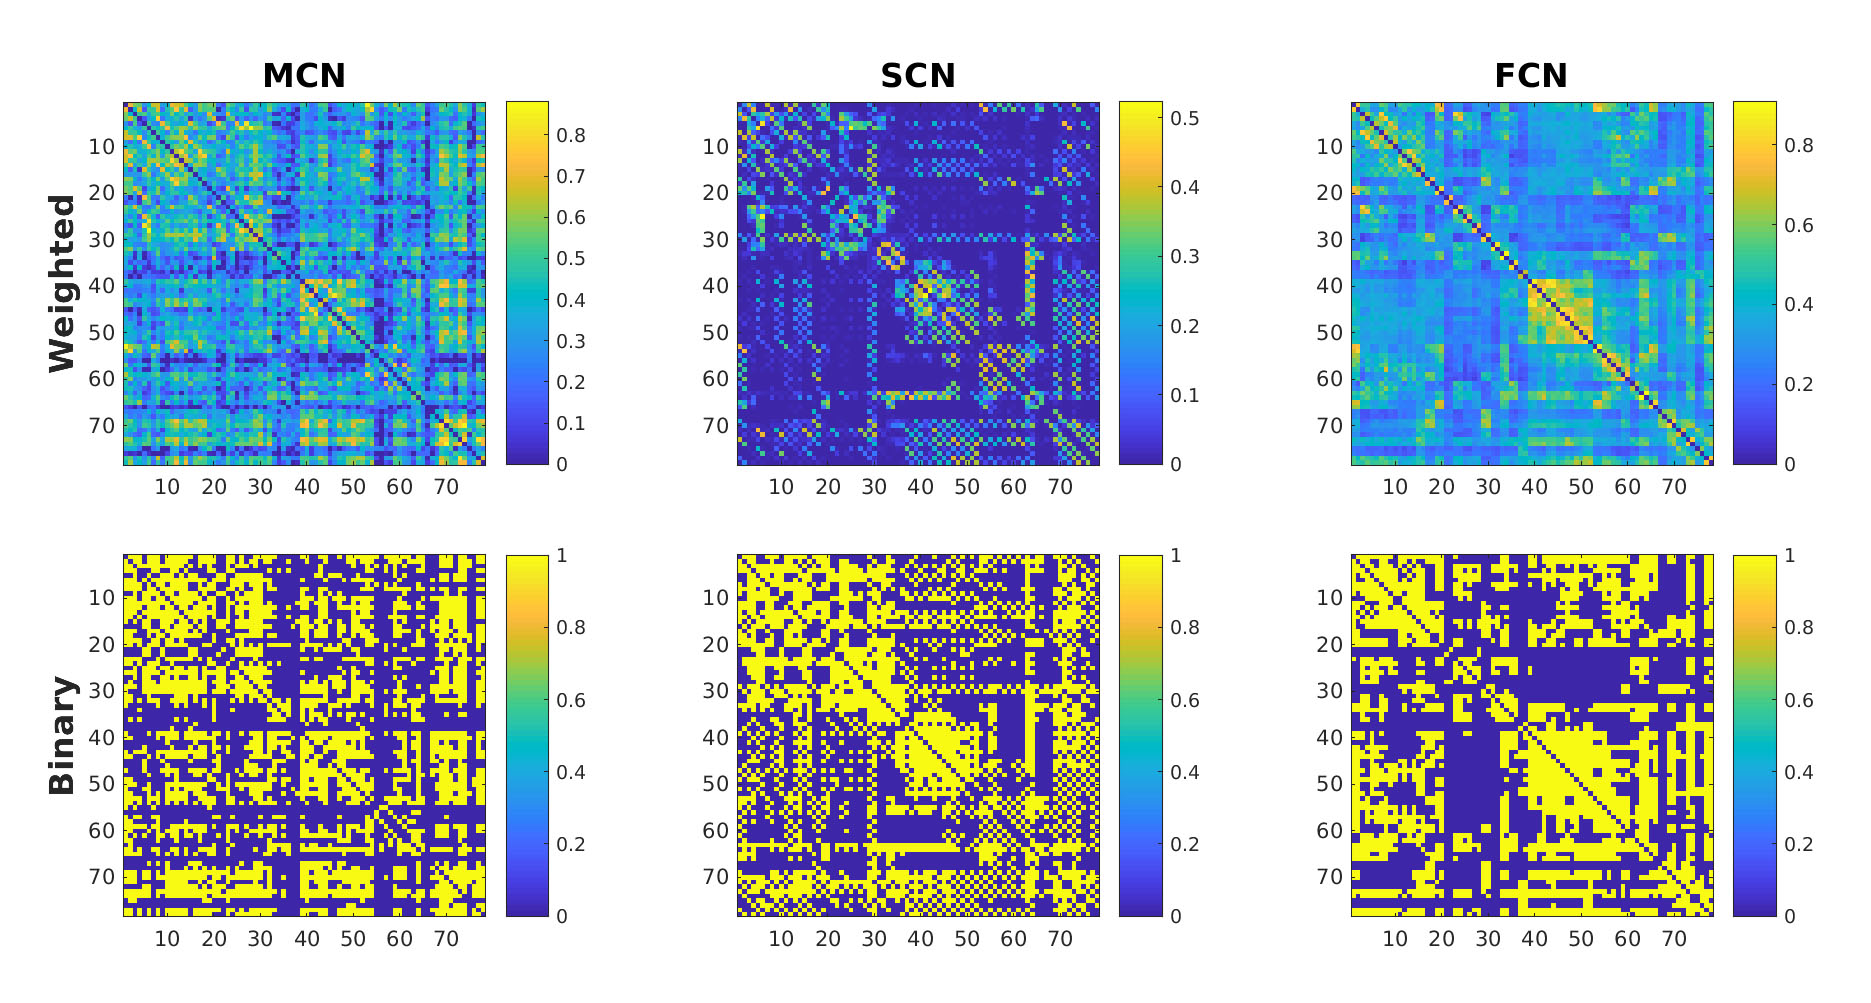
Figure 1. The weighted/binary connectivity matrix for
MCN/SCN/FCN. Maximum value of the
density range (0.45) is chosen to show the binary connectivity matrix.
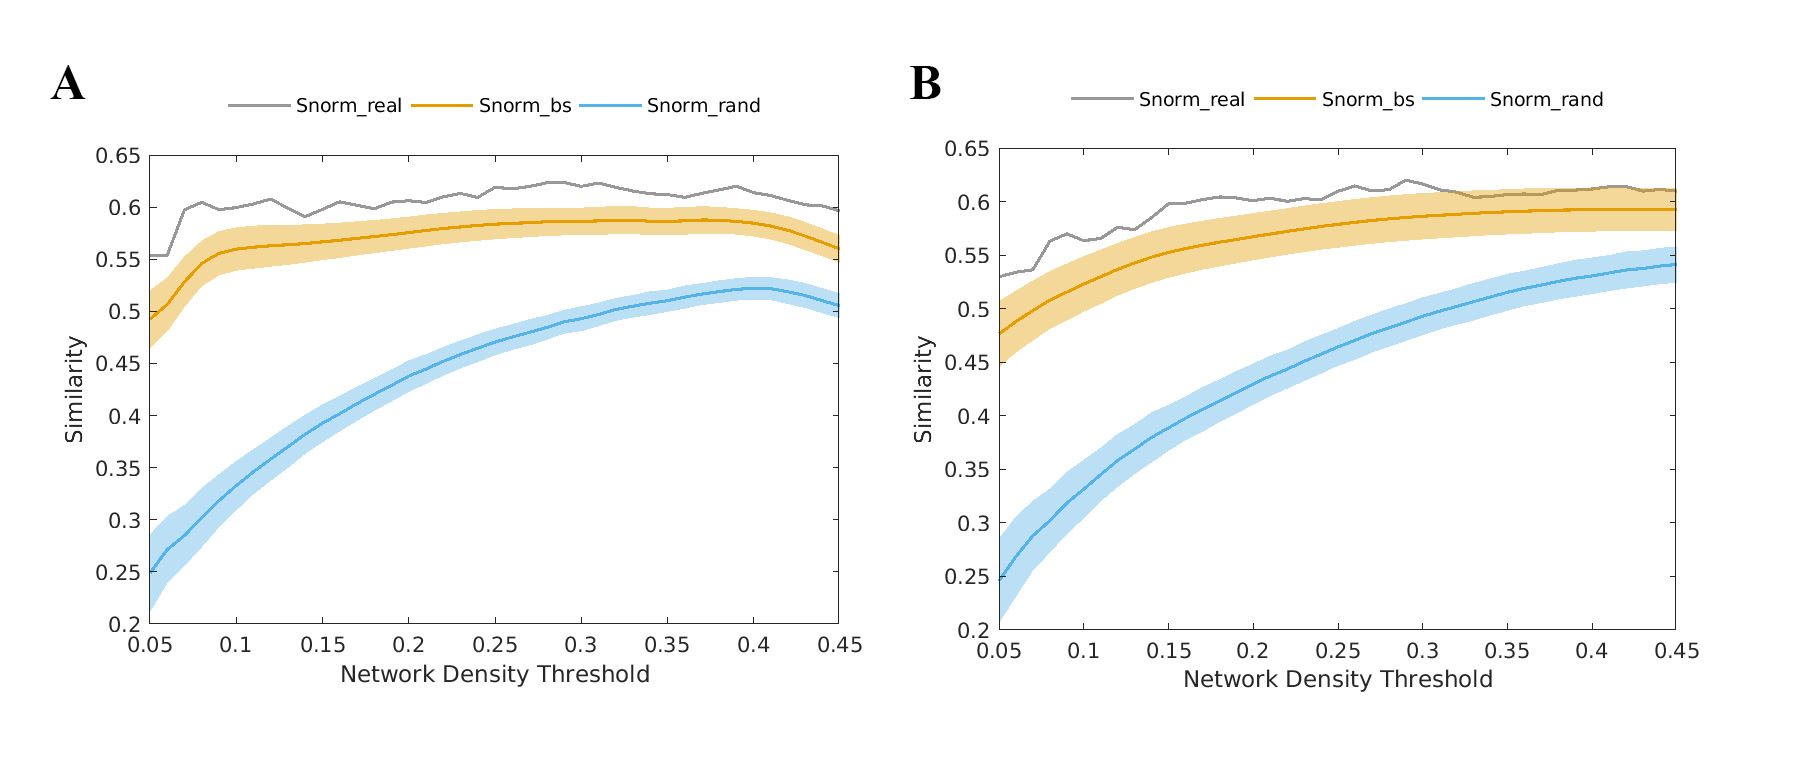
Figure 2. (A) Similarities between MCN and SCN and (B)
similarities between MCN and FCN across the entire density range.
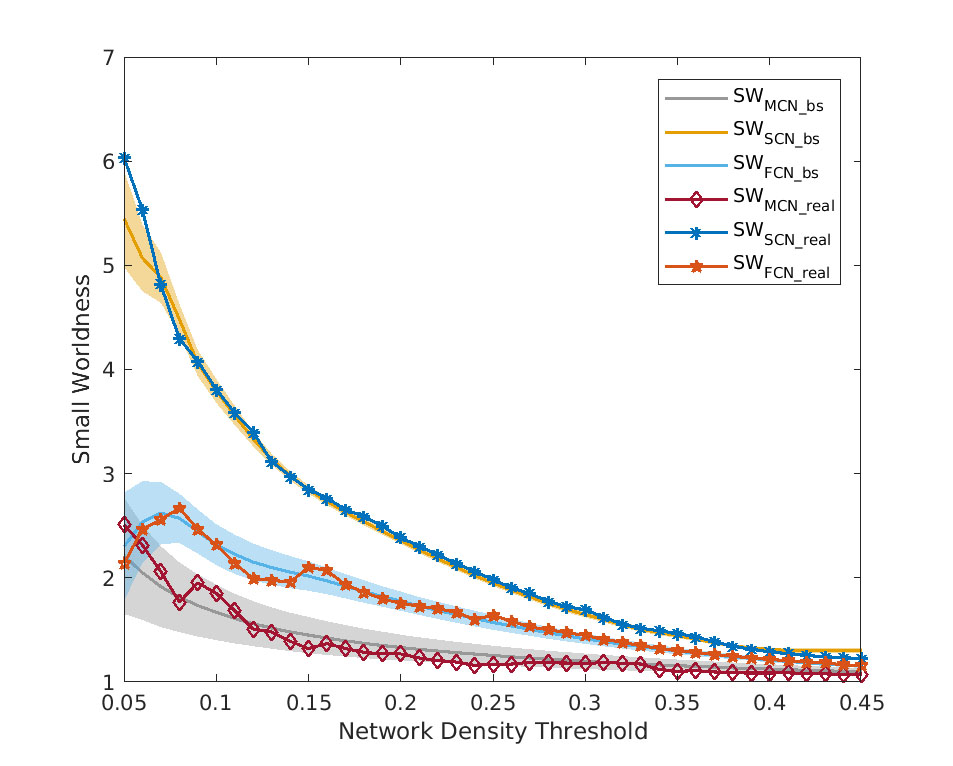
Figure 3. The small worldness of MCN/SCN/FCN for both real
and bootstrap data.
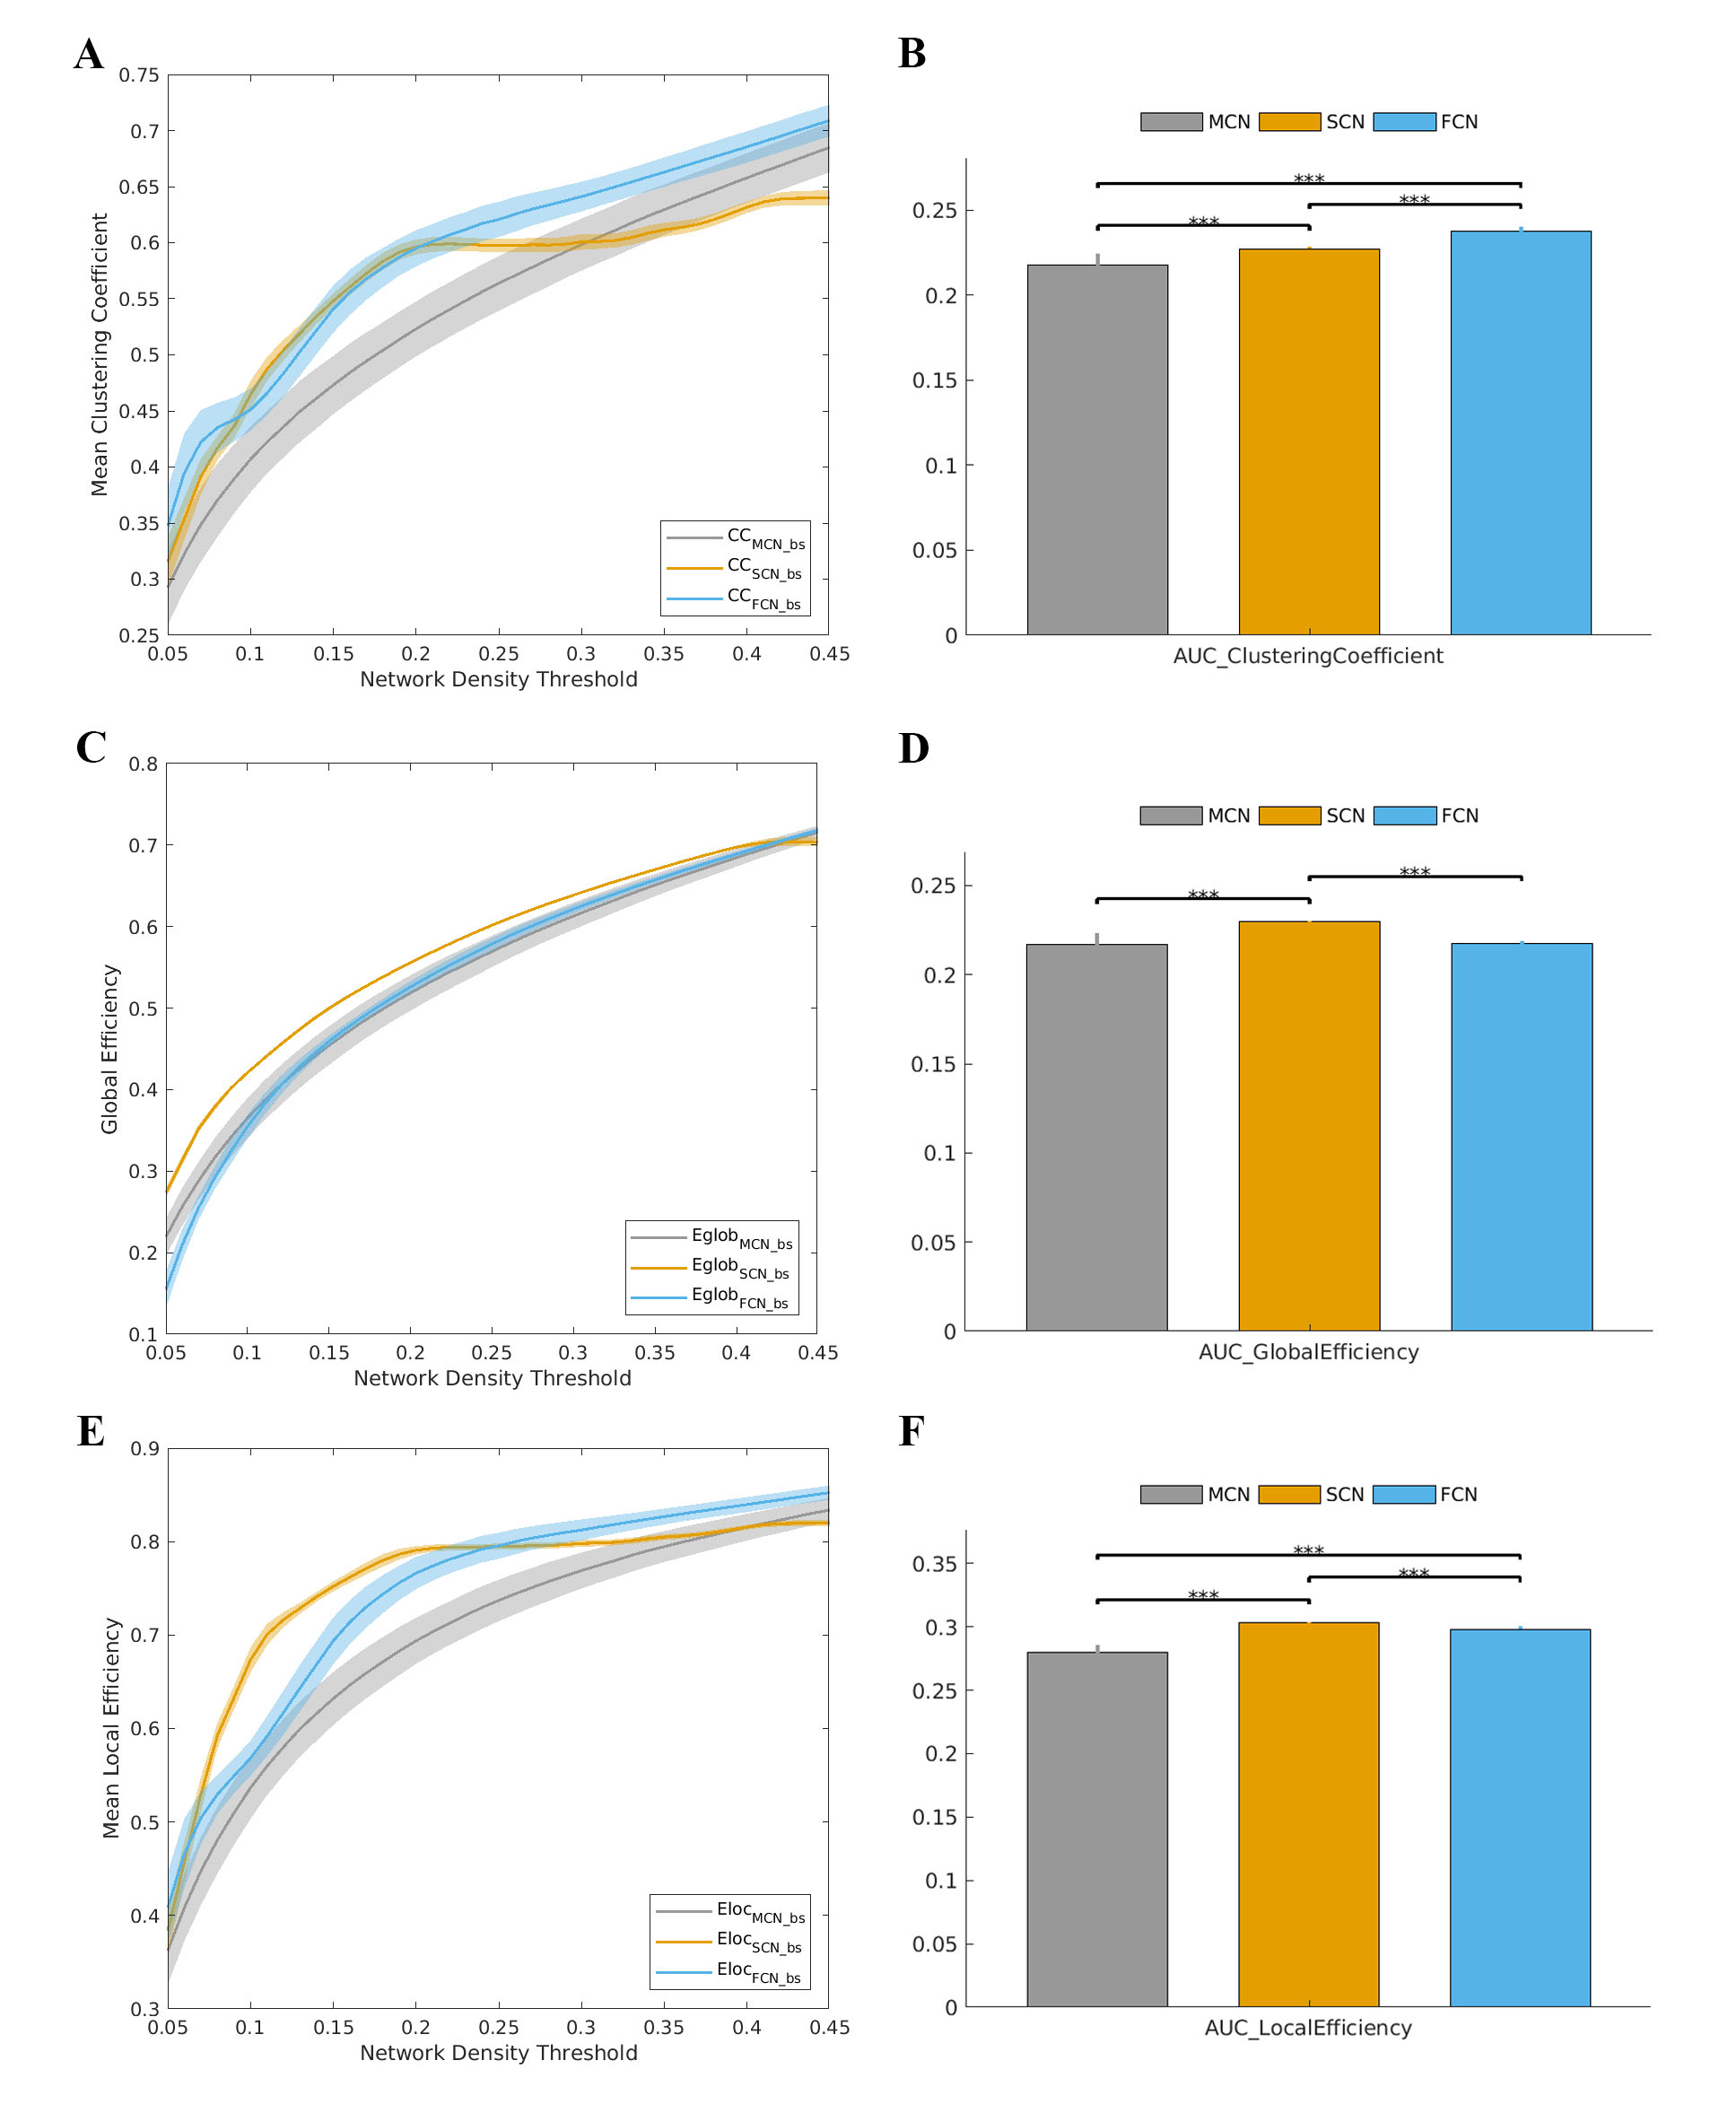
Figure 4. (A) Clustering coefficient and (B) AUC of clustering
coefficient, (C) global efficiency and (D) AUC of global efficiency, (E) local
efficiency and (F) AUC of local efficiency of MCN/SCN/FCN for bootstrap
data. Stars (***) indicate p values less
than 0.001.