3840
Catheter-based Arterial Input Function for Quantitative Perfusion Measurements with Intra-arterial Injection1Dept. of Radiology, Medical Physics, Medical Center University of Freiburg, Faculty of Medicine, University of Freiburg, Freiburg, Germany
Synopsis
MR-guided vascular interventions allow for direct injection of contrast agent (CA) through a catheter, which can be used for perfusion measurements of the target tissue, for example, the myocardium in MR-guided coronary catheterizations. For a quantitative perfusion measurement an arterial input function (AIF) is required that describes the CA concentration-time curve in the artery. In this work we show initial results of two methods to determine the AIF during an intervention and demonstrate the feasibility of measuring the AIF in intra-arterial CA injections based on the signal of an active guiding catheter.
Introduction
MR-guided vascular interventions allow for direct injection of contrast agent (CA) through a catheter, which can be used for perfusion measurements of the target tissue, for example, the myocardium in MR-guided coronary catheterizations1,2,3. For a quantitative perfusion measurement an arterial input function (AIF) is required that describes the CA concentration-time curve in the artery4. In conventional perfusion measurements with intravenous injections, the AIF is indirectly determined via the signal enhancement in an adjacent blood vessel which cannot be applied in intra-arterial CA injections. In this work we show initial results of two alternative methods to determine the AIF: (a) using an active catheter signal of a loop-coil at the tip and (b) an image-based approach in a downstream cross-section of the vessel.Materials & Methods
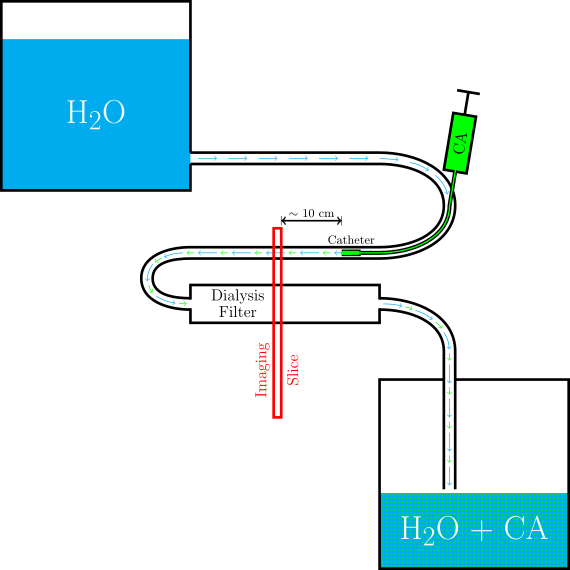
A perfusion phantom was built using a dialysis filter (Fresenius Helixone® High-Flux) that mimics the perfused tissue (Fig.1). The filter was flushed at a constant gravity-driven flow rate with water from a basin. An active catheter5 with a small receive coil at the tip was introduced into the supplying tube to measure the signal change during CA injection. Flushing holes proximal to the loop coil prevent blocking of the artery.
Perfusion experiments were performed at a clinical 3T MRI system (MAGNETOM Prisma, Siemens Healthcare, Germany). The dynamic contrast enhancement was imaged during injection of a 10ml-bolus of 1% Gd-DTPA solution via the catheter using a FLASH sequence with saturation recovery preparation (TE=1.6ms, TR=4.0ms, α=8°, (Δx)3=0.8×0.8×8.0 mm). The imaging plane was positioned several centimeters behind the catheter tip (Fig.1) orthogonal to both the dialysis filter and the supplying tube. The sequence was modified such that after each image acquisition a projection of the catheter tip signal was acquired using three non-selective excitations followed by a gradient-recalled echo along the three main axes. Before and after the perfusion measurement the volume flow rate of the supplying tube was measured using a phase contrast flow measurement (VENC=60cm/s).
Image-based AIF Measurement
The AIF was determined from the signal-time curves in a ROI around the supplying tube. From the signal-time curves CA concentration curves were calculated using the FLASH signal equation with saturation recovery preparation and assuming a T1-relaxivity of the CA in water6 of r1=4.0 l mmol-1s-1.
AIF from Active Catheter Signals
The concentration-time curves were calculated from the projection signals acquired with the tip coil. The CA concentration downstream of the catheter tip was determined using the relation7 $$$[Gd]_\mathrm{Blood}=\frac1{1+q}[Gd]_\mathrm{inj}$$$ with the volume flow rate ratio $$$q=\frac{Q_\mathrm{Blood}}{Q_\mathrm{inj}}$$$. Since the coil sensitivity extends beyond the catheter volume the coil is sensitive to both the catheter lumen and the surrounding blood vessel. The signal contribution from non-enhanced water around the catheter tip was corrected by using the simulated sensitivity profile. From this, the ratio λ of the signal inside the catheter to the total signal was calculated. In an additional set of measurements the flushing holes of the catheter were blocked to investigate the role of the flushing holes in the mixing process.
After reconstructing the AIF, the convolution of the AIF with a Fermi function8 was compared to the measured concentration-time curve within the perfusion phantom for both methods.
Results
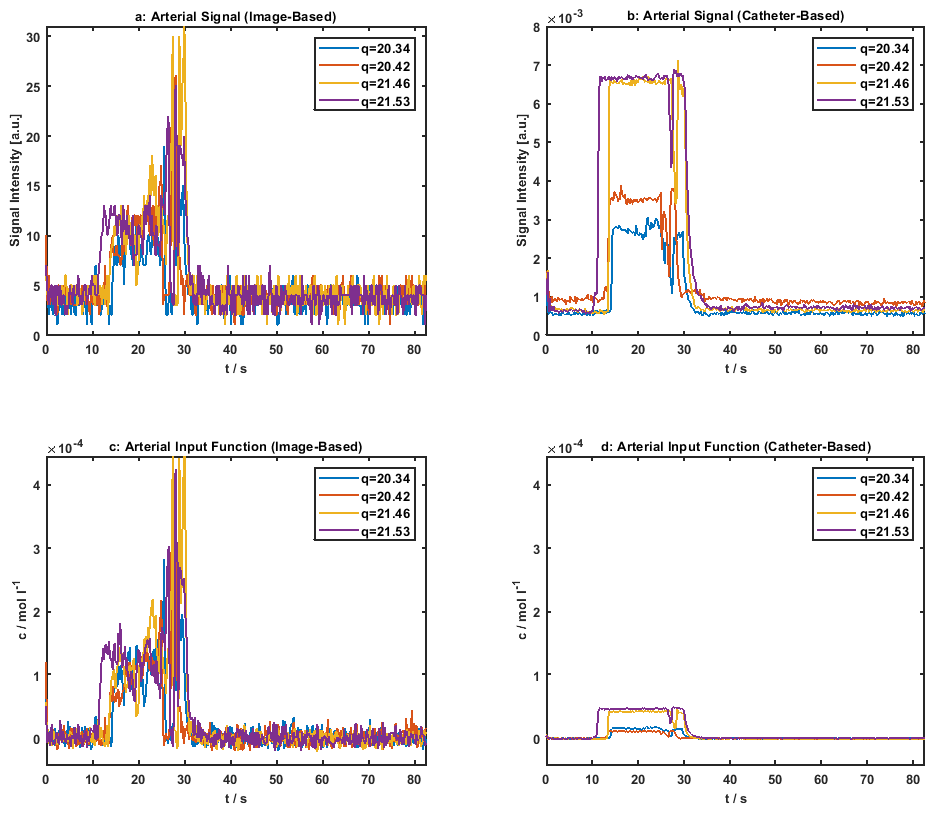
The signal-time curves of the bolus injection are shown in Fig.2(a,b). The signal enhancement is clearly seen in both the image and catheter signal. The second peak is caused by injecting 10 ml of water shortly after the CA injection to flush the remaining contrast agent within the catheter. As expected the measurements with blocked flushing holes show a higher signal increase compared those with open holes.
Fig.2(c,d) show the concentration-time curves reconstructed with the image-based and the catheter-based method. Again, a higher calculated concentration is observed when the flushing holes are blocked. The SNR of the concentration-time curves was calculated to SNRimg,1=6.1, SNRimg,2=5.9, SNRimg,3=7.5, SNRimg,4=6.9 and SNRcath,1=29, SNRcath,2=23, SNRcath,3=74, SNRcath,4=53.
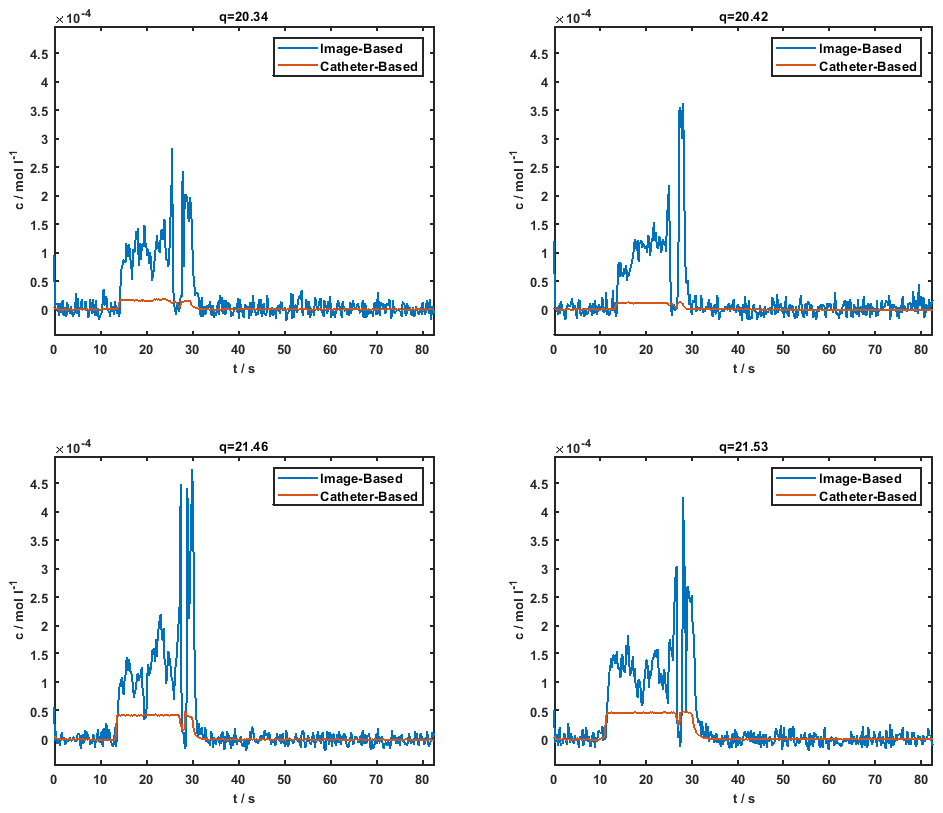
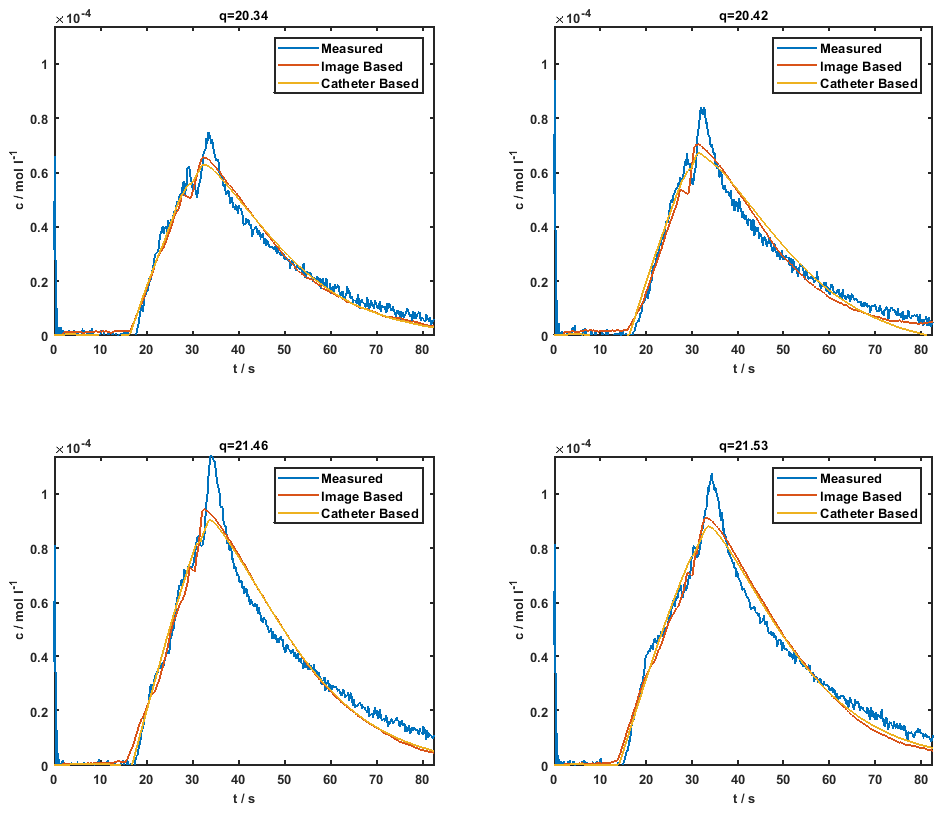
In Fig.3 the concentration-time curves of the image-based and the catheter-based reconstruction are compared for each measurement. The measured global myocardial CA concentration is shown in Fig.4 as well as the fitted convolutions using both the image-based and the catheter-based AIF.
Discussion & Conclusion
In this study the feasibility of measuring the AIF based on the signal of an active guiding catheter for quantitative perfusion assessment is demonstrated. The catheter-based method produces higher SNR compared to the image-based method but a systematic difference of up to 90% is seen in the AIF concentrations, which is reduced to 70% using the correction factors q and λ. To precisely determine for example myocardial perfusion during catheter-based MR-guided interventions, the AIF reconstruction needs to be further optimized so that myocardial perfusion can be rapidly calculated from a convolution fit (Fig.4).Acknowledgements
Support from A. Hengerer and F. Maier (Siemens) is gratefully acknowledged.References
1. S. Reiss, et al. Fully MR-Guided Implantation of a Bioresorbable Scaffold in the Left Coronary Artery of a Pig at 3T. Proc. Intl. Soc. Mag. Reson. Med. 26 (2018)
2. Spuentrup E, Ruebben A, Schaeffter T, et al. Magnetic Resonance–Guided Coronary Artery Stent Placement in a Swine Model. Circulation 2002;105(7):874–879
3. Omary RA., Green JD, Schirf BE. Real-Time Magnetic Resonance Imaging-Guided Coronary Catheterization in Swine. Circulation 2003;107(21):2656–2659.
4. L. Wissmann, M. Niemann, A. Gotschy, R. Manka und S. Kozerkeet al., Quantitative three-dimensional myocardial perfusion cardiovascular magnetic resonance with accurate two-dimensional arterial input function assessment. Journal of Cardiovascular Magnetic Resonance, 2015;17:108
5. A. C. Özen et al. Operator Controlled Illumination of Active Catheter Tips using a Variable Attenuator. Proc. Intl. Soc. Mag. Reson. Med. 25 (2017)
6. M. Rohrer, H. Bauer, J. Mintorovitch, M. Requardt und H.-J. Weinmann,et al. Comparison of Magnetic Properties of MRI Contrast Media Solutions at Different Magnetic Field Strengths. Investigative Radiology, 2005;40:715-724
7. R. Frayne, R. A. Omary, O. Unal und C. M. Strotheret al., Determination of Optimal Injection Parameters for Intrarterial Gadolinium-enhanced MR Angiography. Journal of Vascular and Interventional Radiology, 2000;11:1277-1284
8. N. Wilke, M. Jerosch-Herold, Y. Wang, Y. Huang, B. V. Christensen, A. E. Stillman, K. Ugurbil, K. McDonald und R. F. Wilson,et al. Myocardial Perfusion Reserve: Assesment with Multisection, Quantitative, First-Pass MR Imaging. Cardiac Radiology, 1997;204:373-384
Figures