3829
Flip angle optimization and in vitro demonstration of 2D DESPOT1-based fat thermometry1University Medical Center Utrecht, Utrecht, Netherlands
Synopsis
During MR-HIFU ablations, fat MR thermometry (MRT) is needed for monitoring temperature in adipose tissues (both in target regions and in subcutaneous fat in the near field of the ultrasound beam). It can be based on T1 mapping calculated with 2D-DESPOT1 method and corrected for the FA variation over the slice profile. However, difficulties arise in the choice of 2 flip angles optimized for the whole expected range of T1s in fat MRT. We identify the optimal settings through simulation and demonstrate the feasibility of fat MR thermometry through 2D DESPOT1 sequences in phantom experiments.
Introduction
Fat MR thermometry (MRT) is desired for monitoring thermal ablation of lesions in anatomical regions that contain both water and fat, like bone metastases and breast tumors. Moreover, during MRI-guided High Intensity Focused Ultrasound (MR-HIFU) treatments, fat thermometry can help to prevent thermal damage in the near field area of the ultrasound beam, where unwanted heating can occur in subcutaneous adipose tissue1. The Proton Resonance Frequency Shift (PRFS) MRT method works well in aqueous tissues2, but not in adipose tissues, where little water is present. In fat, MRT can be T1-based. The DESPOT1 method3 is commonly used for T1 mapping: it calculates T1 from 3D RF-spoiled steady-state scans at multiple flip angles (FA). Aiming for real-time thermometry, the method can be accelerated by switching to 2D acquisitions at two FAs. However, it has been shown that:
- Precision is best for FAs that provide 71% the maximum signal on either side of the Ernst angle; therefore, the two optimal FAs are determined by TR and the expected T13.
- 2D-DESPOT1 needs to be corrected for the FA variation over the slice profile4,5.
During MR-HIFU treatments, temperature ranges between body temperature, 36°C, and the target ablation temperature (around 60°C)6; consequently the expected fat T1 range is found approximately between 200 and 600 ms. Thus, FAs need to be carefully chosen. We investigated the optimal settings for the two FA aimed at MRT over the whole expected T1 range, with demo in a phantom experiment.
Methods
T1 maps are calculated with 2D-DESPOT1 method and corrected through simulation of the MR signal7.Temperature maps can then be derived assuming an exponential dependence between T1 and T, according to a free‐state molecular system6:
$$T_1= A e^{-{B}/{T+273.15}}$$
where A (=2.57*105ms ) and B (=2.08*103°C) are parameter constants6 and T is the tissue temperature (°C).
Simulations
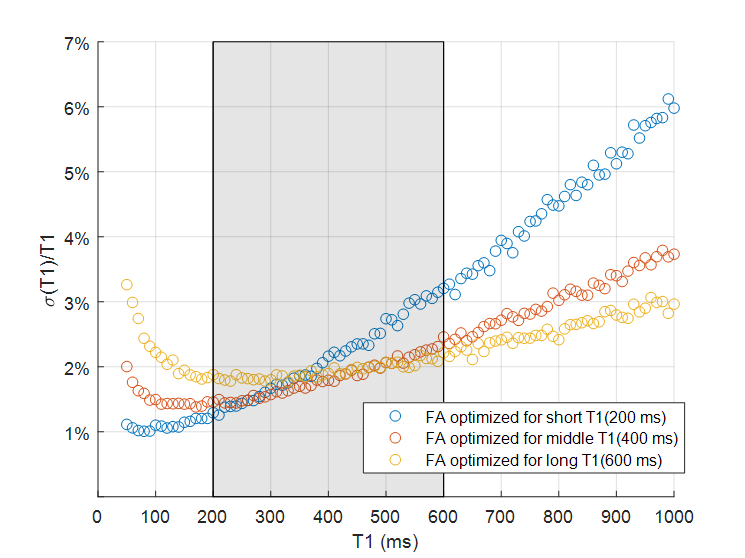
To investigate which combination of FAs is preferred for the expected fat T1 range, we performed simulations of the accuracy and precision of 2D-DESPOT1 mapping varying both FAs between [0° 90°] with 1° increment for TR = 20 ms, T1,short=200 ms, and T1,middle=400 ms and T1,long=600 ms. The optimal FA combinations for the three T1 values were (11°,65°), (8°,42°) and (6°,34°), for the short, middle and long T1, respectively. Based on the relative standard deviation (std/mean), the precision of T1 estimation was evaluated for the range 50-1000 ms with these 3 pairs of FAs. Noise was added to the simulated signal for an SNR=100.
Phantom experiment
A plastic tube containing sunflower oil with a fiberoptic thermometer (Luxtron Corp., Santa Clara, CA) in it was first heated in a water bath up to 80°C and then placed in a 1.5T clinical MR scanner (Philips Achieva, Best, The Netherlands). The acquisition started at 74°C and scans were acquired during the cool-down in steps of 2°C decrement until 36°C.
The MRT experiment was performed with repeated 2D SPGR scans with TR/TE=20ms/5ms, acquisition matrix 224x224, acquired voxel size 2x2x7 mm3 and the best combination of optimal FAs identified from simulation. Two seconds of dummy cycles were added to ensure steady-state signals. The whole procedure took 8 seconds per single slice (4 s for FA). In-plane FA variations were corrected using a 3D B1 map acquired variable TR method (TR1,2=30,150ms)8.
T1 values were calculated from a region of interest of 300 pixels near the probe. Absolute temperature and relative temperature changes can be estimated from the simulation-corrected T1 data and compared with the probe readings.
Results
Simulations
Figure 2 shows the relative std and accuracy for the three values of T1 in fat.
As depicted in Figure 3, the relative std is minimized with the pairs of FAs at middle and long T1; particularly in our range of interest, the std for (6°,34°) stays relatively constant at a value of 2%.
Phantom experiment
Figure 4 shows a plot of measured and simulation-corrected T1 (4a) and absolute temperature (4b) versus the temperature measured with the probe.
ΔT (T- Tref) estimated from simulation-corrected T1 are plotted versus ΔT measured with the probe, as shown in figure 5. The values are in good agreement: the MRT estimates lay within one std of the actual value.
Discussion and conclusion
We have shown that dynamic 2D fat MR thermometry with 2D-DESPOT1 sequence is feasible with FAs optimized for the fat T1 range expected during thermal therapy. Temperature changes can be estimated with the 2D-DESPOT1 method with a 2/3% of error over the temperature range of interest. In our future work, we will investigate the combination of this method with PRFS to provide thermometry both in aqueous and fatty tissues.Acknowledgements
No acknowledgement found.References
1. Baron P., Ries M., Deckers R., Greef M., Tanttu J., Kohler M., Viergever M.A., Moonen C.T.W.,Bartels L.W. (2014) In Vivo T2-Based MR Thermometry in Adipose Tissue Layers for High-IntensityFocused Ultrasound Near-Field Monitoring Magn Reson Med 72(4):1057-1064. https://doi: 10.1002/mrm.25025.
2. Peters R.D., Hinks R.S., Henkelman R.M. (1998) Ex vivo tissue-type independence in proton resonance frequency shift MR thermometry. Magnet Reson Med, 40(3):454-459. https://doi.org/10.1002/mrm.1910400316
3. Deoni, S. C. L., Rutt, B. K., Peters T. M. (2003). Rapid combined T1 and T2 mapping using gradient recalled acquisition in the steady state. Magnetic Resonance in Medicine, 49(3), 515–526. https://doi.org/10.1002/mrm.10407
4. Svedin, B. T., & Parker, D. L. (2017). Technical Note: The effect of 2D excitation profile on T1 measurement accuracy using the variable flip angle method with an average flip angle assumption. Medical Physics, 44(11), 5930-5937. https://doi.org/10.1002/mp.12513
5. Parker, G.J.M., Barker G. J., Tofts P.S. (2001). Accurate Multislice Gradient Echo T1 Measurement in the Presence of Non-ideal RF Pulse Shape and RF Field Nonuniformity. Magnetic Resonance in Medicine, 45(5), 838–845. https://doi.org/10.1002/mrm.1112
6. Baron, P., Deckers, R., Knuttel, F. M., Bartels L. W. (2015). T1 and T2 temperature dependence of female human breast adipose tissue at 1.5 T: Groundwork for monitoring thermal therapies in the breast. NMR in Biomedicine, 28(11), 1463–1470. https://doi.org/10.1002/nbm.3410
7. Braskute I., Deckers R., Viergever M.A., Moonen C.T.W., Bartels L.W. (2018) Bloch simulation-based correction for 2D VFA T1 mapping for fat MR thermometry, Abstract #4038, Proc. Intl. Soc. Mag. Reson. Med. 26
8. Yarnykh V.L.(2007) Actual flip-angle imaging in the pulsed steady state: a method for rapid three-dimensional mapping of the transmitted radiofrequency field Magn Reson Med.57(1):192-200 https://doi.org/10.1002/mrm.21120
Figures

Schematic overview of the method. Using the RF shape and the scan parameter settings, magnetization behavior is simulated using Bloch’s equations for 2 FAs and signals are calculated at each location. The simulated signals are then used to estimate 2D T1. Extending the procedure for an input range of T1 values, the dependence of 2D T1 on the nominal T1 is fitted and can be used as look-up table to correct experimental data. In the experiment, the steady-state signals at 2 FAs are acquired, T1 is computed and simulation-corrected. Using the temperature dependence of T1, MR thermometry can be performed.