3823
Improved MR thermometry using saturation bands to suppress water signal1Radiology and Imaging Sciences, University of Utah, Salt Lake City, UT, United States, 2Siemens Healthineers, Baltimore, MD, United States, 3Siemens Healthineers, Salt Lake City, UT, United States, 4Siemens Healthineers, Boston, MA, United States
Synopsis
MR guided focused ultrasound (MRgFUS) treatments are routinely monitored by MR thermometry (MRT). Image quality and MRT precision can be significantly degraded by water motion in the water bath used to couple the FUS transducer to the target tissue. This problem is especially challenging when the water bath surrounds the target tissue. In this work we investigate the use of saturation bands to suppress the unwanted signal in dedicated breast and brain MRgFUS systems. It is shown that using saturation bands to suppress signal from the water bath significantly reduces artifacts and improves MRT precision with potentially shorter scan times.
Introduction
In some MRgFUS systems, such as the breast-specific MUSE system (University of Utah, USA/IGT, France) (1) and the Exablate Neuro (Insightec, Israel) (2), the target tissue is surrounded by the coupling water bath. Large water volumes can result in motion artifacts degrading image quality and precision in the MR thermometry (MRT) used to monitor treatments. In the MUSE system the water surface can move due to patient motion and table vibrations, and the acoustic radiation force causes convection during sonications. The Exablate system features a closed-loop water circulation system, which, due to motion artifacts, is routinely turned off during sonications but it could potentially be advantageous to continuously circulate the water to cool the skull. The water signal can be suppressed by adding manganese chloride salt (3). However, salt can shorten the life of water chilling and degassing systems. Further, eliminating the water signal with salt can limit the use of the water signal to ensure coupling is maintained throughout treatment. Saturation bands have the advantage that the water signal can be selectively eliminated in those imaging sequences where the signal is undesirable. In this work we investigate the effect of water signal saturation and elimination on the MRT precision for breast and brain applications.Methods
Experiments were performed on a 3T scanner (Magnetom PrismaFIT, Siemens, Germany). Proton resonance frequency shift (PRFS) MRT was performed with a 3D segmented EPI pulse sequence (Table 1). In all experiments two 50-mm wide saturation bands (slab-selective saturation with RF spoiling of 50° quadratic increment, followed by gradient spoiling in the phase- and slice-encoding directions) were applied to suppress signal from water in the phase encoding direction.
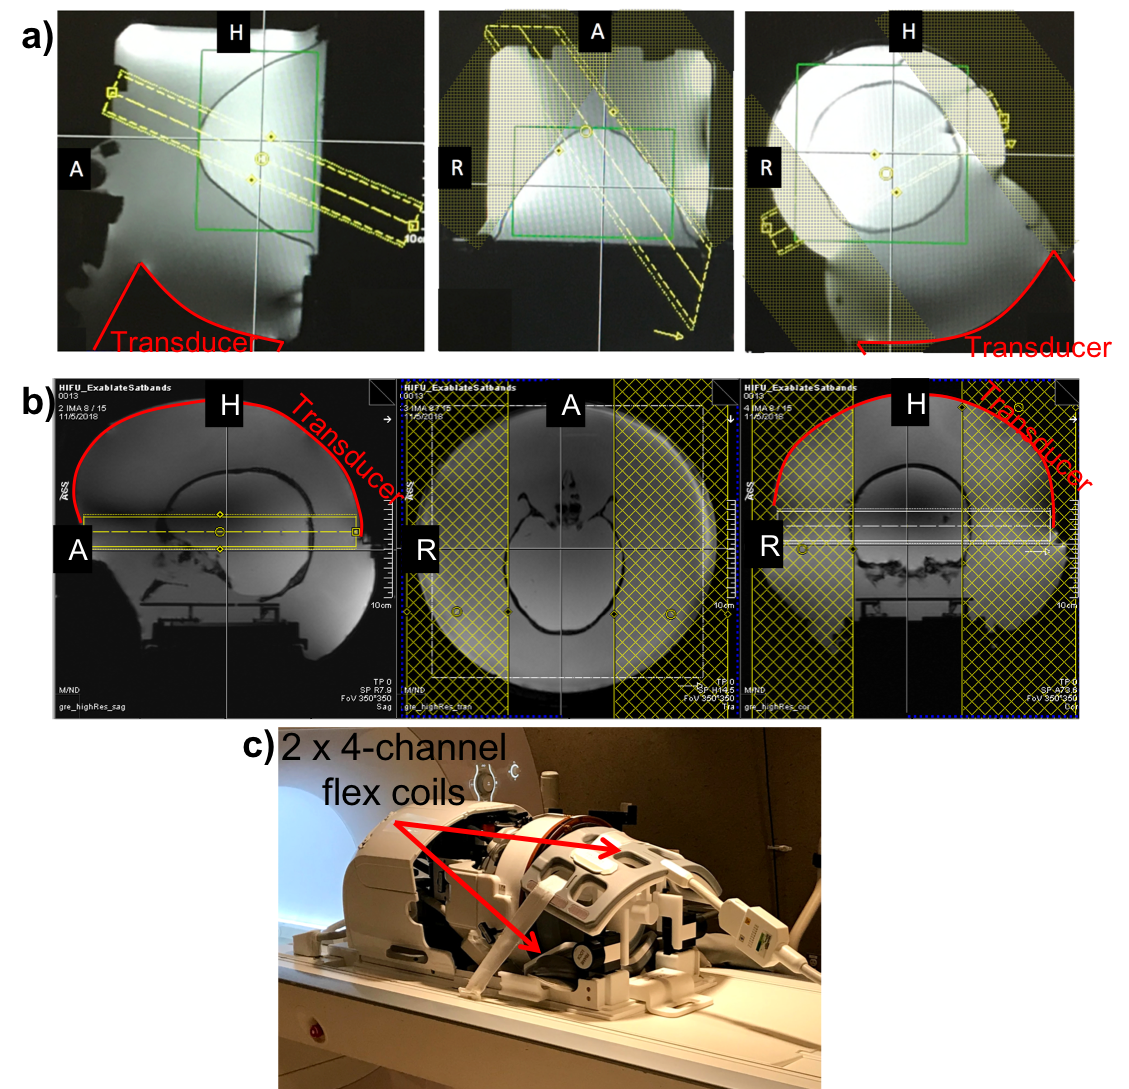
In the MUSE system, temperature measurements were acquired in a 3D slab oriented perpendicular to the transducer in a double-oblique orientation, Figure 1a. Experiments were performed in a breast-shaped gelatin phantom (4) with a volunteer freely breathing on top, as well as in-vivo in a healthy volunteer. Imaging artifacts and MRT precision without and with saturation bands were compared. The MUSE system features a dedicated 8-channel RF coil array (6-channel ladder array around the water tank with additional loops around the transducer and the top/opening).
In the Exablate system a transverse 3D slab was acquired with saturation bands placed in the phase-encoding direction, Figure 1b. Two experiments were performed in an ex-vivo gelatin-filled skull; 1) comparing a full field-of-view acquisition without saturation bands (short TR) to a 62.5% phase field-of-view acquisition with saturation bands suppressing the water signal (longer TR). This experiment was performed with the water circulation OFF. 2) Comparing the MRT precision without and with saturation bands while keeping the TR and field-of-view fixed, both with the water circulation ON and OFF. Two 4-channel flex-coils (placed anteriorly and posteriorly, Figure 1c) were used in all Exablate experiments.
All PRFS maps were calculated using alpha = -0.01 ppm/°C and single baseline subtraction followed by referenceless reconstruction by fitting a second order polynomial (5). Data was zero-filled interpolated to 1.0-mm isotropic voxel spacing. MRT precision was calculated as the standard deviation through time on a voxel-by-voxel basis, and averaged over a spatial region-of-interest.
Results
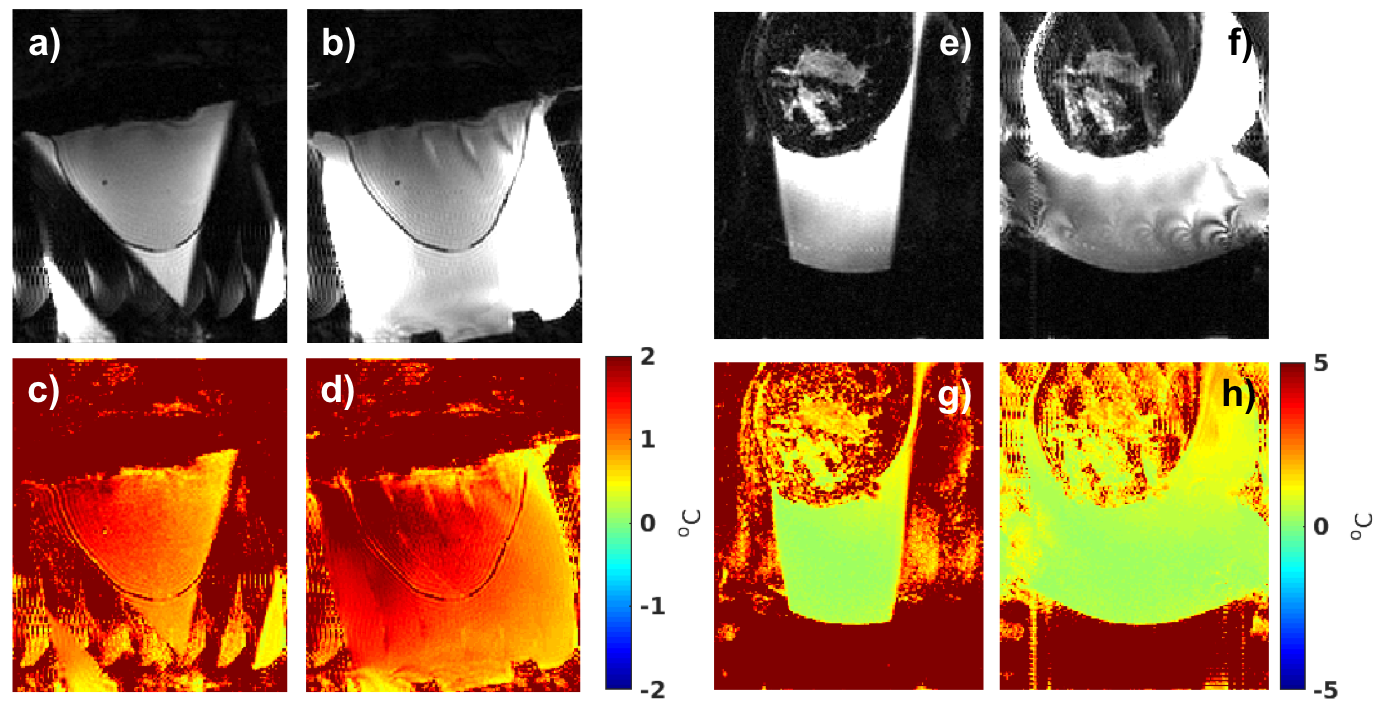
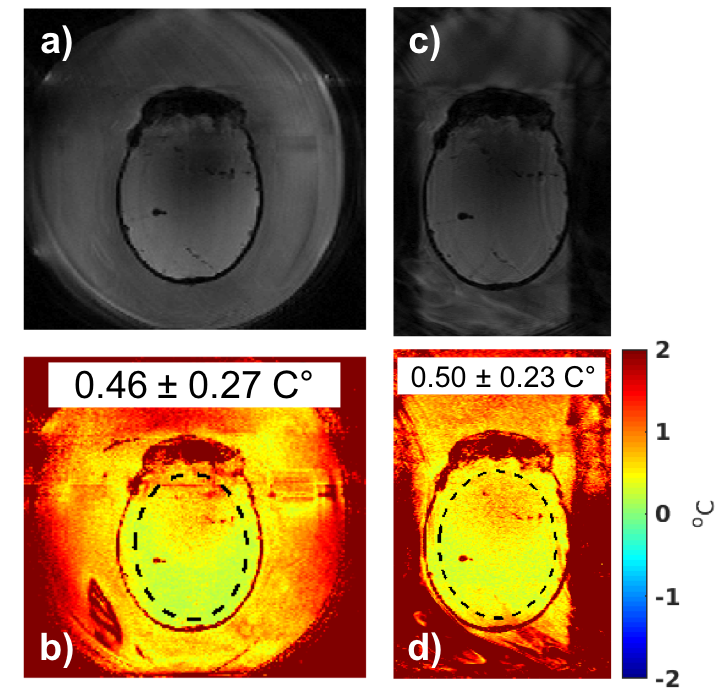
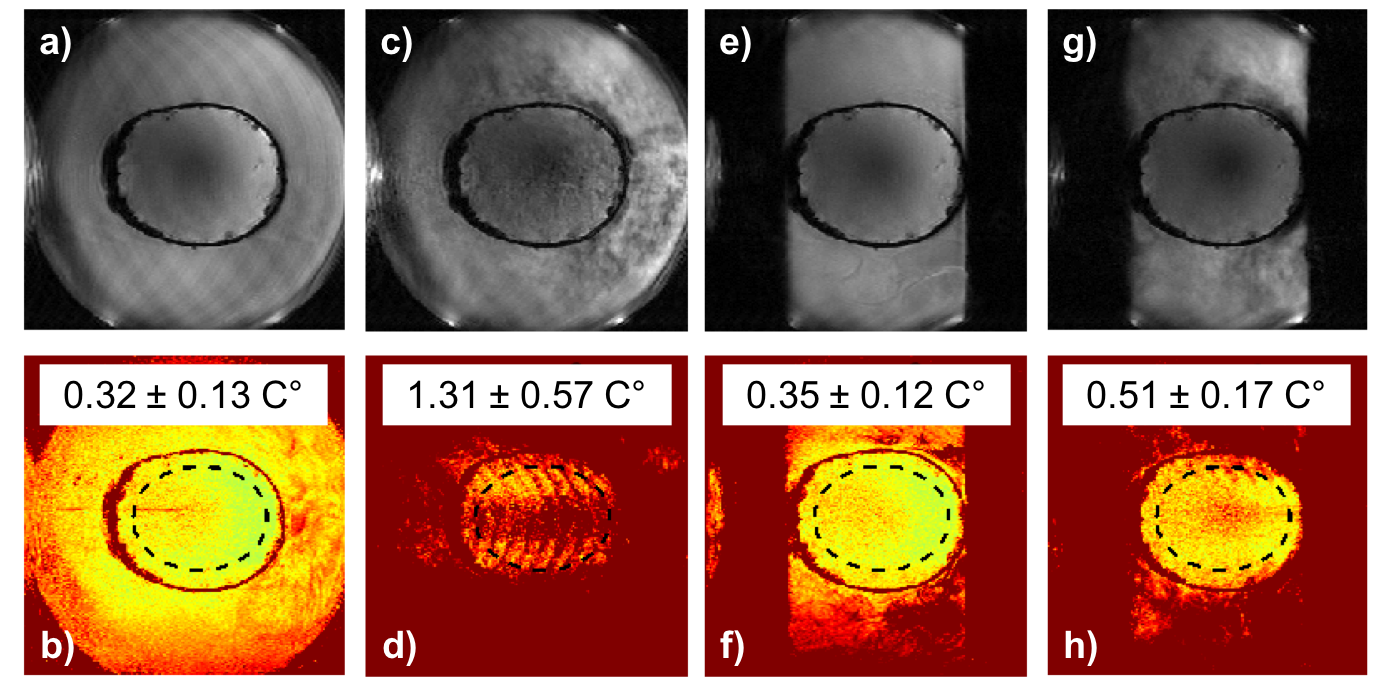
For the MUSE experiments, the magnitude images and MRT precision maps in both the phantom and the in-vivo studies in Figure 2 show decreased artifacts when saturation bands are applied. Figure 3 demonstrates that an equivalent precision is achieved with the smaller field-of-view (using saturation bands and longer TR) as compared to the full field-of-view (using shorter TR). Using the saturation bands results in a 13% shorter scan time (2.32 vs. 2.62 s). Figure 4 shows that when TR and field-of-view are fixed, the precision with and without saturation bands are equivalent when the flow is OFF, but when flow is ON the saturation bands significantly suppresses motion artifacts and improves the MRT precision.Discussion and Conclusions
In this work we have demonstrated the use of saturation bands to improve MRT performance in applications where the tissue of interest is surrounded by the coupling water bath. The use of saturation bands significantly reduces motion and ghosting artifacts in both the MUSE and Exablate Neuro systems, resulting in improved MRT precision and with the potential for shorter scan times. Here both saturation bands were applied every TR, but, since T1 of water is long, future work will investigate improved efficiency by alternatively only applying one band/TR. This way more than two bands can also be applied without increasing the scan time and the SAR.Acknowledgements
This work was supported by Siemens Healthcare, the Mark H. Huntsman endowed chair, and NIH grant R01EB013433, R01CA172787, R37CA224141, and S10OD018482.References
1. Payne A, Merrill R, Minalga E, et al. Design and characterization of a laterally mounted phased-array transducer breast-specific MRgHIFU device with integrated 11-channel receiver array. Med. Phys. [Internet] 2012;39:1552–60. doi: 10.1118/1.3685576. 2. Ghanouni P, Pauly KB, Elias WJ, Henderson J, Sheehan J, Monteith S, Wintermark M. Transcranial MRI-Guided Focused Ultrasound: A Review of the Technologic and Neurologic Applications. Am. J. Roentgenol. [Internet] 2015;205:150–159. doi: 10.2214/AJR.14.13632. 3. Deckers R, Merckel LG, Senneville BD De, Schubert G, Köhler M, Knuttel FM, Moonen CTW, Bosch MAAJ Van Den, Bartels LW. Performance analysis of a dedicated breast MR-HIFU system for tumor ablation in breast cancer patients. Phys. Med. Biol. [Internet] 2015;60:5527–5542. doi: 10.1088/0031-9155/60/14/5527. 4. Farrer AI, Odéen H, de Bever J, Coats B, Parker DL, Payne A, Christensen DA. Characterization and evaluation of tissue-mimicking gelatin phantoms for use with MRgFUS. J. Ther. Ultrasound 2015;3:9. doi: 10.1186/s40349-015-0030-y. 5. Rieke V, Vigen KK, Sommer G, Daniel BL, Pauly JM, Butts K. Referenceless PRF shift thermometry. Magn. Reson. Med. 2004;51:1223–1231. doi: 10.1002/mrm.20090.Figures