3820
Active Tracking-based cardiac triggering of MR thermometry for MRI-guided cardiac ablation1Biomedical Engineering Department, School of Biomedical Engineering and Imaging Sciences, King's College London, London, United Kingdom, 2Siemens Healthcare GmbH, Erlangen, Germany, 3MR Research Collaborations, Siemens Healthcare Limited, Frimley, United Kingdom, 4Imricor Medical Systems, Burnsville, MN, United States
Synopsis
MR thermometry can be used for MRI-guided cardiac ablations, but ECG-triggering is not always effective. We propose to use the Active Tracking (AT) functionality included in the catheter to prospectively trigger the thermometry measurements. Modules measuring the position of the AT microcoil were interleaved with a thermometry sequence, which were repeated until a trigger condition is detected. Experiments showed successful triggering in a beating heart phantom, with a temperature stability of 1.12±0.36°C. For in-vivo interventional application, respiratory motion will need to be taken into account.
Introduction
Cardiac MR-thermometry shows promise for real-time assessment of ablation lesions during MRI-guided catheter ablation of cardiac arrhythmias 1–5. Current cardiac MR-thermometry sequences are commonly based on ECG-triggered EPI acquisitions. However, the reliability of ECG-triggering decreases due to the additional RF equipment and the strong gradients associated with EPI-based sequences 4. MR-compatible ablation catheters often contain active tracking (AT) microcoils that can be used to track the catheter tip coordinates in real-time 4,5. In this study, we sought to investigate the potential of using continuously measured AT position as a surrogate of the cardiac motion for prospective cardiac triggering of the MR thermometry acquisition.Methods
AT-based triggering
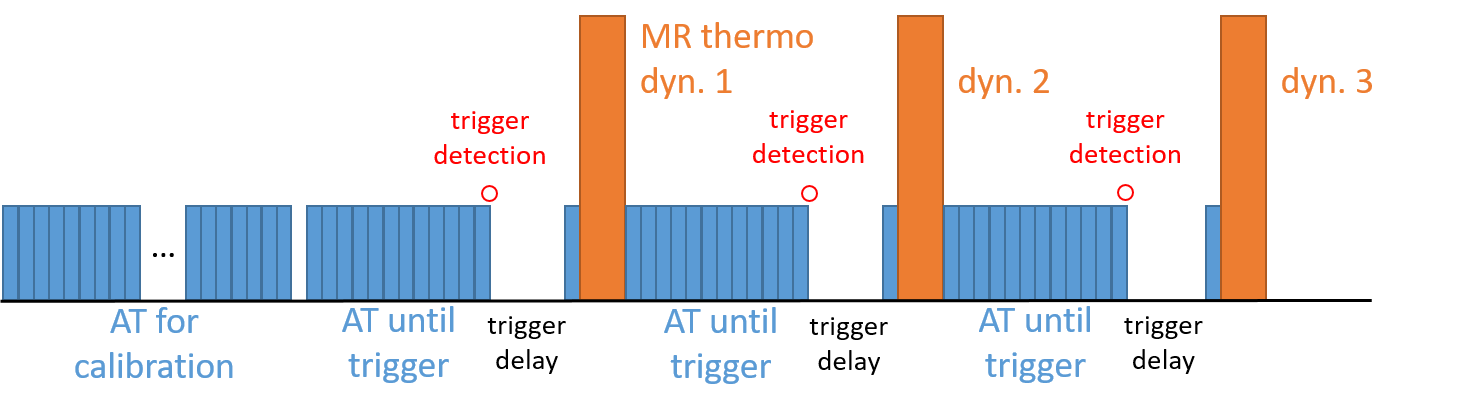
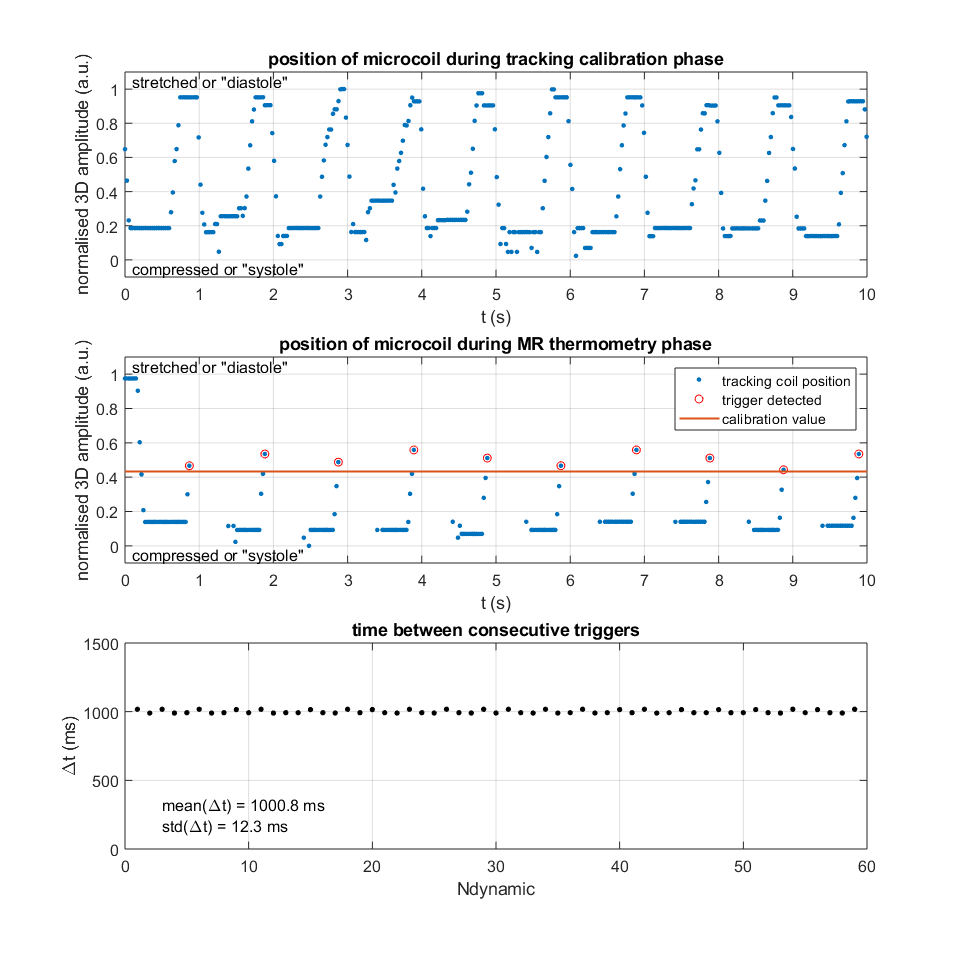
One AT module consisted of three non-selective projection acquisitions and signal dephasing, with a total duration of 25 ms. During a calibration phase at the beginning of the imaging sequence, AT modules were repeated uninterruptedly to measure the AT position over several cardiac cycles (Figure 1). The average position, representing the AT position in between the extrema, was taken as a calibration value for subsequent triggering detections.
Before each repetition of the MR thermometry sequence, AT modules were repeated until a trigger could be determined. At the end of the reconstruction pipeline of each AT module, checks were performed to see if the AT position has passed the calibrated value (microcoil moves in between extrema) and if the motion had a positive slope (microcoil moves in one specified direction). After trigger detection, a trigger delay was enforced to start imaging in a quiescent cardiac phase, followed by one AT module for optional repositioning of the imaging slice, and the actual MR thermometry imaging. Calibration and determination of the trigger were integrated into the image reconstruction environment and performed in real time.
Setup
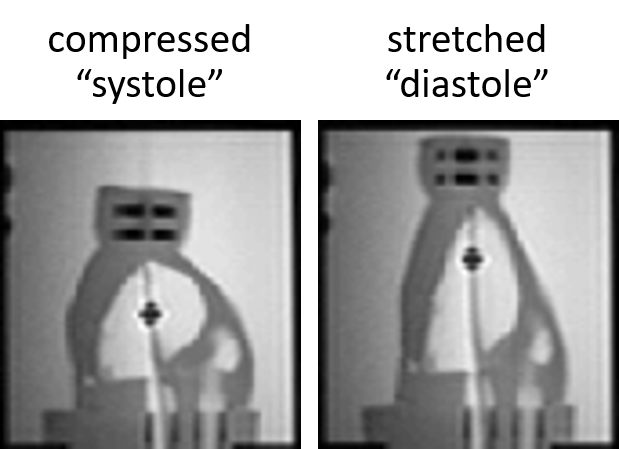
AT-triggered imaging was studied in a heart phantom that mimicked the ventricles, sitting in a tank of water (DHP-MRI, Shelley Medical Systems, Canada). The base of the phantom was fixed to the tank and the apex was connected to a pneumatically driven actuator that simulated cardiac motion through translation and rotation. One of the two available AT microcoils of an MRI-compatible RF ablation catheter (Vision-MR Ablation Catheter, Imricor Medical Systems, USA) was used for AT triggering. The catheter entered the phantom through a port on the base and was pressed to remain positioned in the apex, for guaranteed displacement during cardiac motion (Figure 2, left). Experiments were performed at 1.5 T (Magnetom Aera, Siemens Healthcare, Erlangen, Germany).
Experiment
MR thermometry was performed using the proposed prototype sequence on an apical slice (short axis orientation) in the compressed phase. AT-based triggering was used and the phantom was driven at 60 BPM. Thermometry parameters: Proton Resonance Frequency Shift method 6 with single-shot EPI, dynamics=60, TR/TE/α=70ms/16ms/60˚, FOV 240x240 mm2,voxel size=2.1x2.1mm2, slice thickness=5mm, GRAPPA=2, partial Fourier=0.75. AT parameters: α=7˚, dephasing angle=45˚ 7, module length=25ms, calibration phase=10s, trigger delay=500ms.
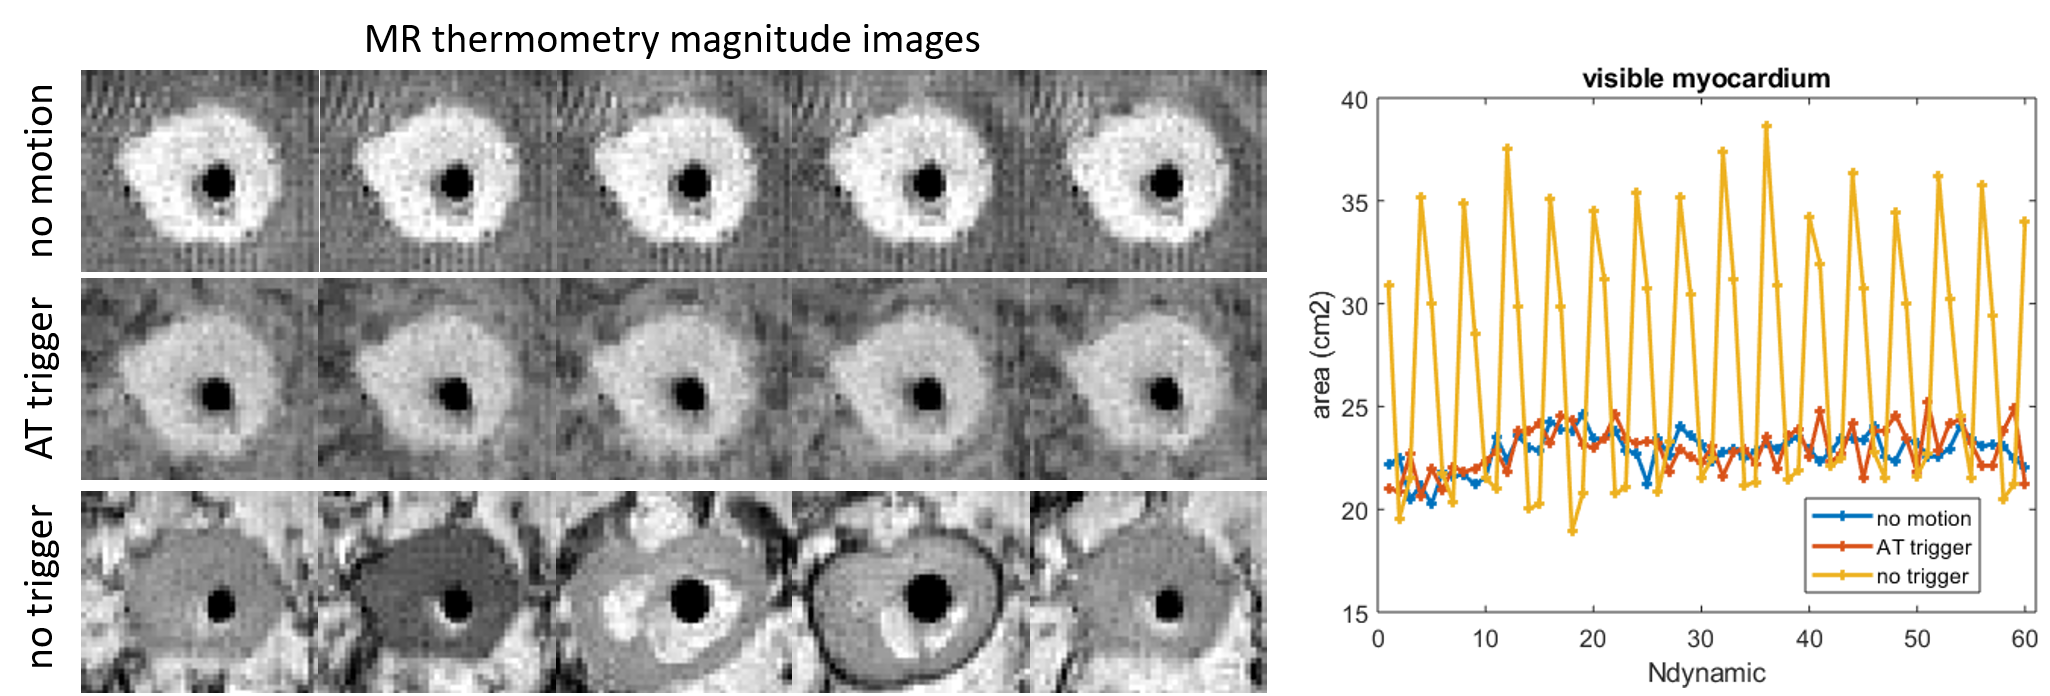
For comparison, standard ECG-triggered MR-thermometry was conducted with the static phantom in the compressed phase using a simulated ECG signal of 60 BPM. Another set of measurements was taken with the phantom beating at 60 BPM, but now triggered by a simulated ECG-signal at 80 BPM, to mimic a situation where cardiac triggering is absent or faulty.
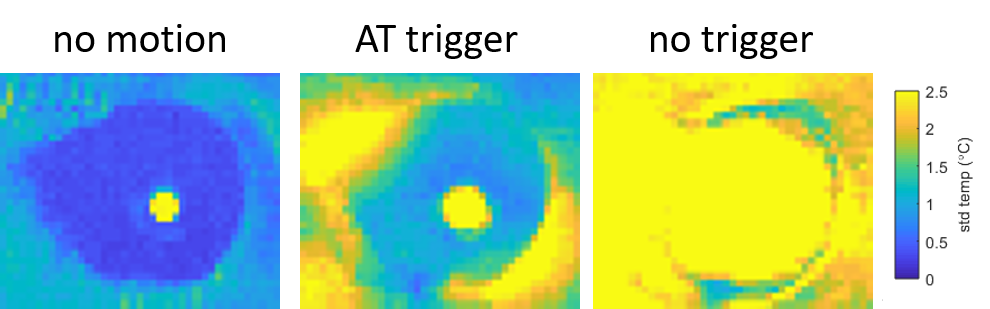
To quantify the stability of the triggered acquisition, the visible area of the myocardium was manually segmented in all images and compared over time. Temperature maps were calculated from the phase data, and temperature stability was calculated by taking the standard deviation over all dynamics.
Results
With AT-based triggering, all dynamics were measured at an interval matching the prescribed cardiac frequency (Figure 3, bottom panel): every heart beat was successfully detected. High similarity between the myocardial areas of the static and AT triggered case can be observed, as well as strongly deviant values for the untriggered experiment (Figure 4). Temperature stability of the AT triggered measurement was 1.12±0.36 ˚C, whereas the untriggered situation exceeds 2.5˚C (Figure 5).Discussion
AT for cardiac triggering was successful in a dynamic heart phantom. For translation to cardiac interventions the effects of respiration need to be mitigated as well. A different approach that takes into account respiratory motion to detect the position-based trigger will need to be implemented.Conclusion
A new method for cardiac triggering, using active tracking, has been demonstrated in a beating heart phantom and was successfully applied in the context of real-time cardiac MR-thermometry. Future work will include modelling of the respiratory motion and in-vivo validation.Acknowledgements
This work was supported by the EPSRC grant (EP/R010935/1) and the Health Innovation Challenge Fund (grant number HICF-R10-698), a parallel funding partnership between the Department of Health, and the Wellcome Trust. This work was also supported by the Wellcome EPSRC Centre for Medical Engineering at Kings College London (WT 203148/Z/16/Z) and by the National Institute for Health Research (NIHR) Biomedical Research Centre based at Guy’s and St Thomas’ NHS Foundation Trust and King’s College London. The views expressed are those of the authors and not necessarily those of the NHS, the NIHR or the Department of Health.References
1. Kolandaivelu, A. et al. Noninvasive assessment of tissue heating during cardiac radiofrequency ablation using MRI thermography. Circ. Arrhythmia Electrophysiol. 3, 521–529 (2010).
2. de Senneville, B. D. et al. Feasibility of fast MR-thermometry during cardiac radiofrequency ablation. NMR Biomed. 25, 556–562 (2012).
3. Ozenne, V. et al. Improved cardiac magnetic resonance thermometry and dosimetry for monitoring lesion formation during catheter ablation. Magn. Reson. Med. 77, 673–683 (2017).
4. Toupin, S. et al. Feasibility of real-time MR thermal dose mapping for predicting radiofrequency ablation outcome in the myocardium in vivo. J. Cardiovasc. Magn. Reson. 19, 14 (2017).
5. Mukherjee, R. K. et al. Epicardial electroanatomical mapping, radiofrequency ablation, and lesion imaging in the porcine left ventricle under real-time magnetic resonance imaging guidance—an in vivo feasibility study. EP Eur. (2017). doi:10.1093/europace/eux341
6. Rieke, V. et al. Referenceless PRF shift thermometry. Magn. Reson. Med. 51, 1223–1231 (2004).
7. Dumoulin, C. L., Mallozzi, R. P., Darrow, R. D. & Schmidt, E. J. Phase-field dithering for active catheter tracking. Magn. Reson. Med. 63, 1398–1403 (2010).
Figures