3816
Longitudinal Registration for Voxel-wise Correlation of MRgFUS Treatment Assessment Metrics1Biomedical Engineering, University of Utah, Salt Lake City, UT, United States, 2Department of Surgery, University of Utah, Salt Lake City, UT, United States, 3Department of Radiology and Imaging Sciences, University of Utah, Salt Lake City, UT, United States
Synopsis
The acute assessment of MRgFUS therapies with metrics such as thermal dose and contrast-enhanced (CE) imaging have been shown to under- or over-estimate the final ablation lesion as assessed by delayed imaging or histological outcomes. The aim of this study is to longitudinally register MRgFUS treatment images to a final lesion outcome as determined by CE-T1w imaging three days post-treatment for voxel-wise analysis of these errors. MR thermometry (MRTI), cumulative thermal dose (CTD), and acute CE-T1w images are co-registered to Day 3 CE-T1w with millimeter accuracy and assessed for their predictive value.
Introduction
In minimally-invasive thermal ablation techniques, acute assessment of the final tissue damage is imperative for determining treatment efficacy for malignancies. Current MR-based metrics for final lesion volume include cumulative thermal dose (CTD) and non-perfused volume (NPV) images. Acute metrics have both under- and over-estimated the ablation lesion volume calculated from histological images [1]. Studies have suggested that the CTD threshold for apoptosis is lower than the current standard and the necrosis threshold can vary within tissue-types [2][3]. With longitudinal image registration, these acute metrics can be compared to a final ablation lesion outcome on a voxel-wise level, allowing for more detailed analysis and the potential for predictive learning from acute MR images. In this work, MR thermometry, acute post-ablation contrast enhanced (CE)-T1w, and 3-day post-ablation CE-T1w images are longitudinally registered to determine the accuracy of CTD and acute NPV for predicting the NPV three days after treatment.Methods
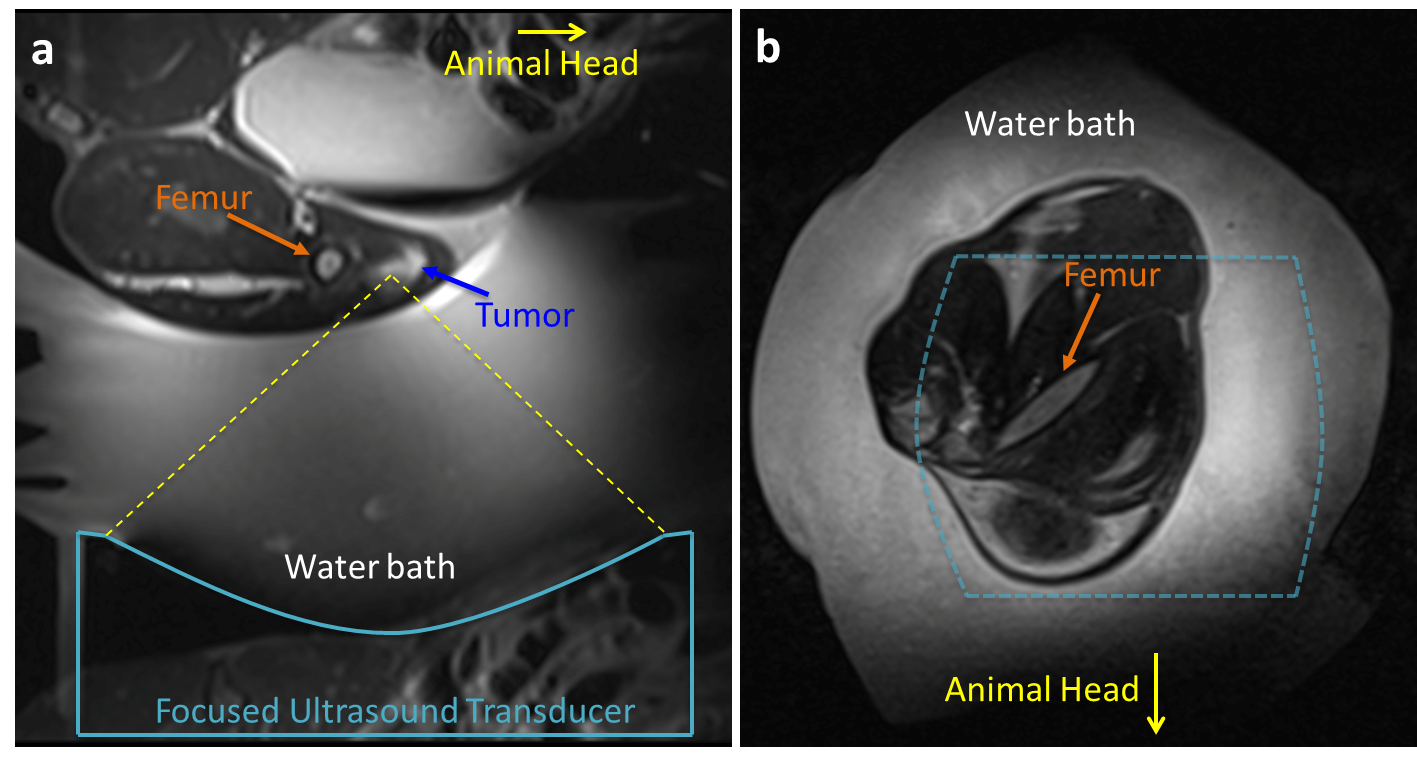
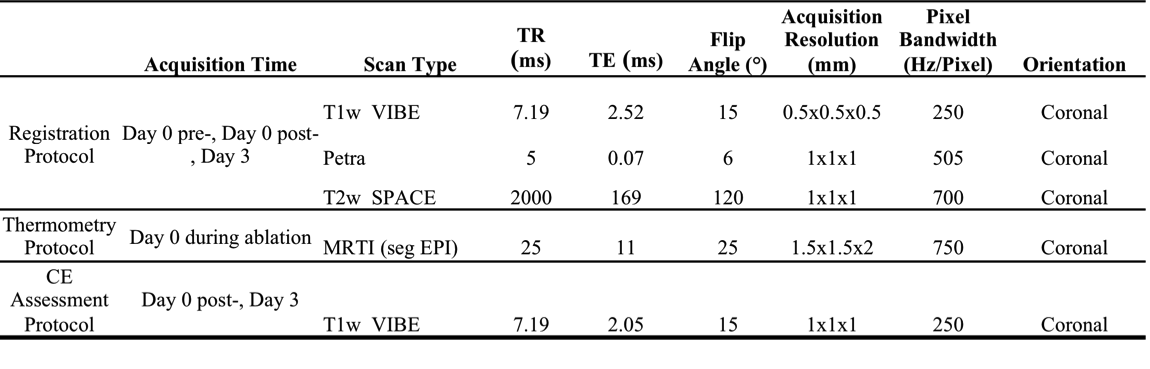
A longitudinal assessment of MRgFUS ablations was performed in New Zealand white rabbits (n=3). For an in vivo tumor model, a cell suspension of VX2 (~1x10⁶ cells in 50% media/Matrigel) was injected intramuscularly into the quadriceps muscles and grown for 1-2 weeks. MRgFUS thermal ablation of the tumors and surrounding muscle tissue was performed with a 256-element phased-array transducer (IGT/Imasonic; 10-cm focal length, 14.4 × 9.8 cm aperture, 940 kHz) inside a 3T scanner (PrismaFIT, Siemens), with real-time PRF MR temperature imaging (MRTI, Table 1). Each rabbit was positioned on its side on top a custom-built table, with the target leg partially suspended above the transducer (Figure 1). Multi-parametric MR imaging was acquired pre- and post-ablation, and a high-resolution CE-T1w (Multihance, 0.1 mmol/kg, Table 1) scan was acquired 40 minutes post-ablation (acute). Three days after treatment (Day 3), the CE-T1w scan was re-acquired with the animal in the same position.
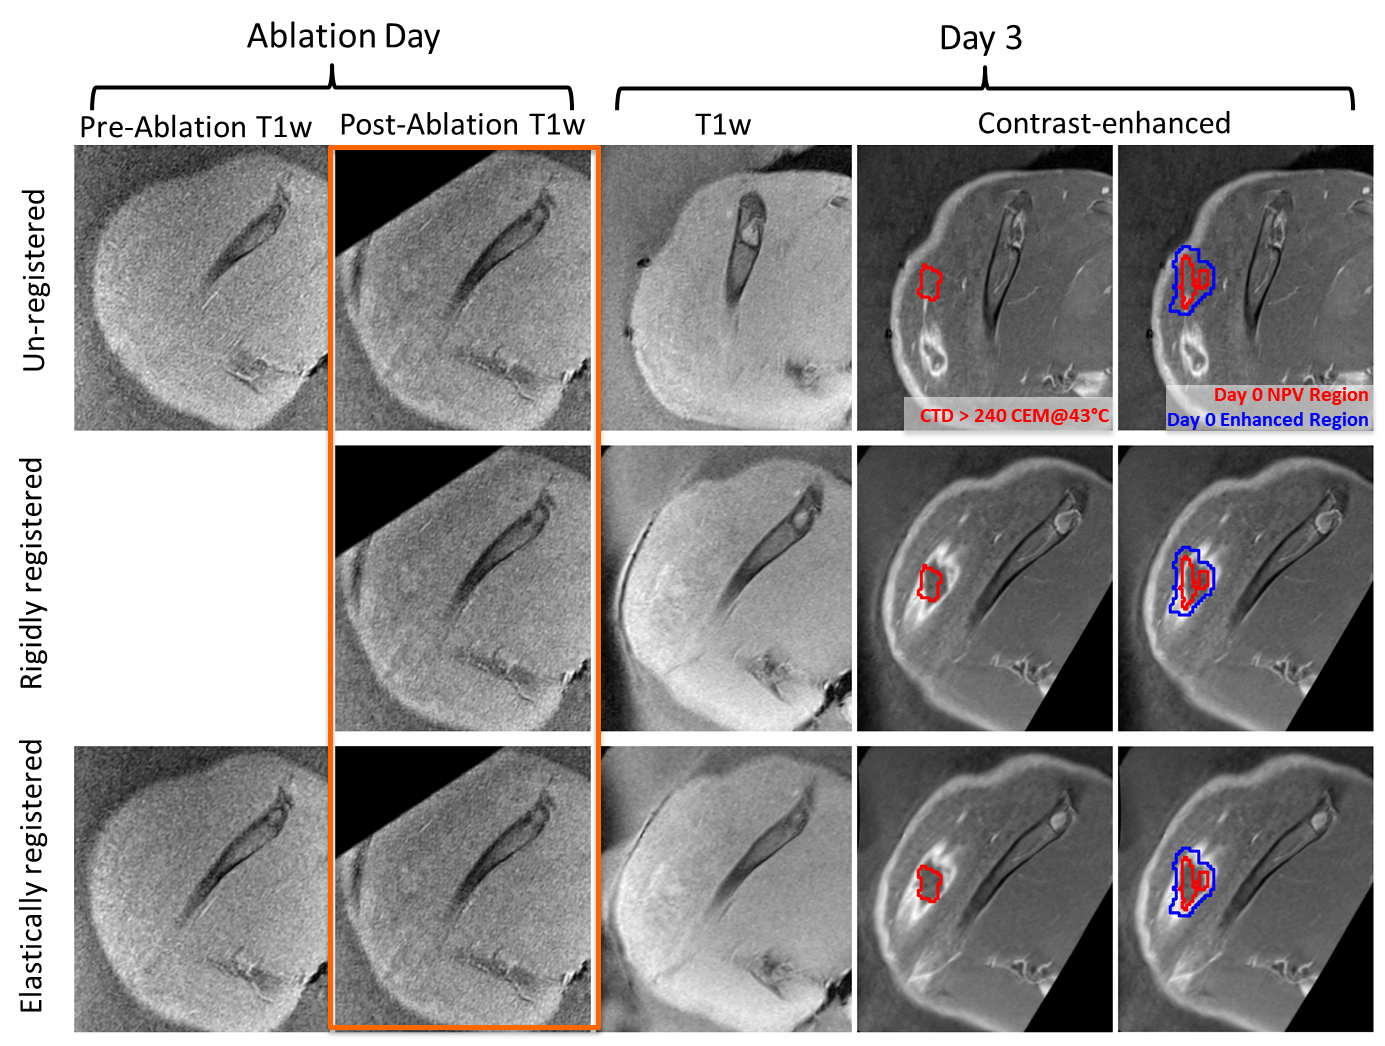
Longitudinal Registration: To register all MR scans, 0.5-mm isotropic T1w images acquired pre-ablation and on Day 3 were registered to post-ablation T1w target volume using intensity-based elastic registration [4]. Inter-day registration required a preliminary rigid registration step, using 5-6 femur landmarks in PETRA images. The resulting deformations were applied to the MRTI and Day 3 CE-T1w images to bring all images into a common space. Registration accuracy was assessed with the Euclidean distance between two registered volumes of anatomical landmarks in the quadriceps muscle that are apparent only in the T2w (1.0 mm-isotropic, n=3) images, and not in the non-contrast T1w images.
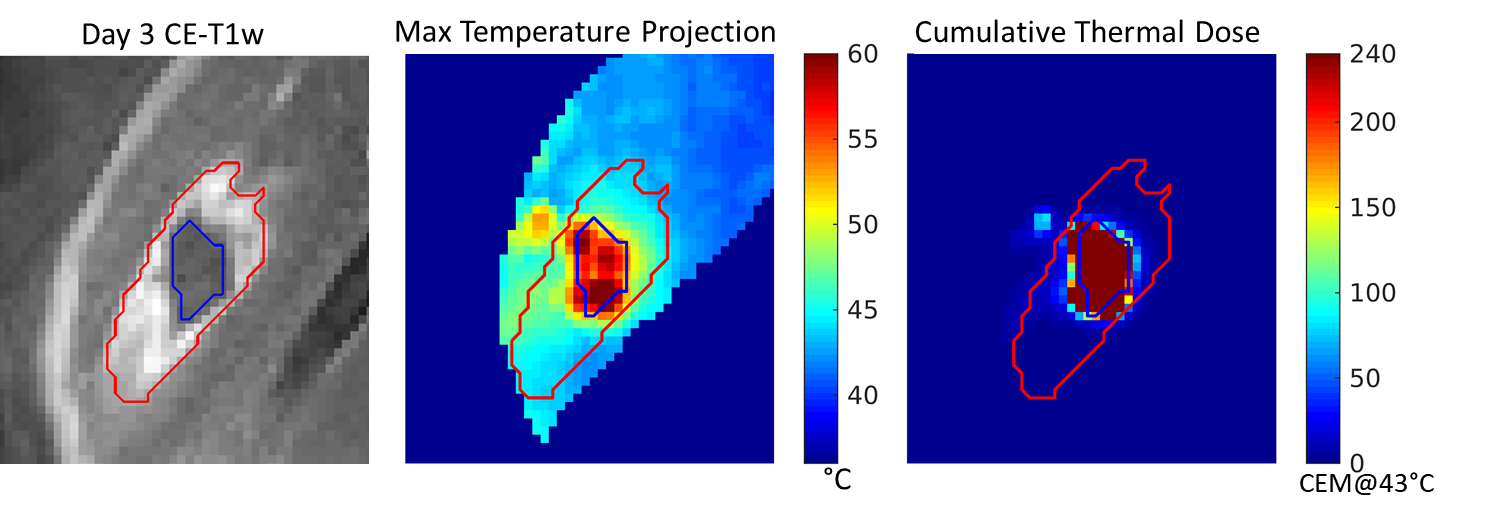
Image Processing: Acute and Day 3 CE-T1w NPV volumes were semi-automatically segmented by 1) manually drawing volume of interest (VOI) encompassing the NPV and enhancing rim then 2) automatically classifying VOI voxels with SpostCE ≥ SpreCE + 2*σpreCE as “enhancing,” and remaining voxels as “NPV”[5]. The CTD volume for each animal was calculated by summing the thermal dose of each sonication, calculated from the PRF MRTI phase images [6], [7]. CTD240 is the CTD volume thresholded at 240 CEM@43°C.
Results
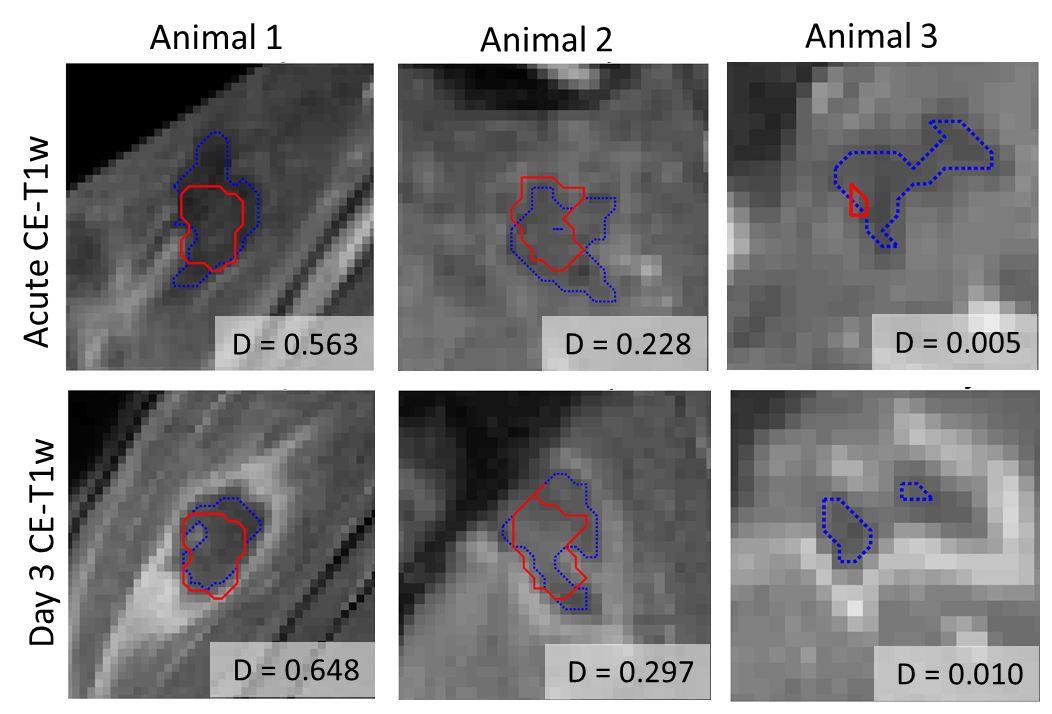
For intra-day longitudinal registration, the mean Euclidean distance between landmarks was 1.3±0.2 mm and 1.0±0.6 mm in un-registered and registered T2w images, respectively. For inter-day longitudinal registration, the mean distance was 34.7±5.0 mm and 1.3±0.5 mm in unregistered and registered images. The registration error is on the order of, or less than, voxel dimensions of the MRTI volume. An example of non-registered, rigidly registered, and elastically registered T1w VIBE volumes are shown in Figure 2, where the target image is outlined in orange. Figure 2d-e demonstrates how rigid and elastic registration improves alignment of the CTD240 and acute NPV with the Day 3 NPV. Furthermore, the Dice coefficients (D) between the CTD240 and the acute NPV (Figure 3a) were similar to the Dice between CTD240 and the Day 3 NPV (Figure 3b).Discussion and Conclusion
Longitudinal image registration of a thermal ablation study allows for voxel-wise assessment of the predictive performance of post-treatment assessment measures. An interesting finding was the persistence of Day 3 NPV in voxels which received less than 240 CEM@43°C. In animals 2 and 3, the CTD240 volume was significantly smaller than the CE-T1w image, suggesting that a lower threshold may result in irreversible cell damage in this model. With voxel-based mapping of MRTI voxels to the Day 3 NPV, a tissue-specific CTD threshold for necrosis may be derived. By longitudinally registering pre-ablation scans, changes in MR parameters can be quantified and input into a supervised predictive model for Day 3 lesion volume. Future work will include investigating optimal thresholds for CTD and incorporating additional MR contrasts for acute, non-contrast predictions of lesion extent.Acknowledgements
This work was funded by R37CA224141 and R03EB026132.References
[1] B. Z. Fite, A. Wong, Y. Liu, L. M. Mahakian, S. M. Tam, O. Aina, N. E. Hubbard, A. Borowsky, R. D. Cardiff, and E. Dumont, “Magnetic Resonance Imaging Assessment of Effective Ablated Volume following High Intensity Focused Ultrasound,” PLoS One, pp. 1–16, 2015.
[2] J. W. Wijlemans, R. Deckers, Þ. M. A. A. J. Van Den Bosch, B. A. Seinstra, M. Van Stralen, Þ. P. J. Van Diest, C. T. W. Moonen, and L. W. Bartels, “Evolution of the Ablation Region After Magnetic Resonance Y Guided High-Intensity Focused Ultrasound Ablation in a Vx2 Tumor Model,” Invest. Radiol., vol. 48, no. 6, pp. 381–386, 2013.
[3] A. Boyesa, K. Tanga, R. Chopra, and M. Bronskill, “Histological evaluation of prostate tissue response to image-guided transurethral thermal therapy after a 48h recovery period,” AIP Conf. Proc., vol. 1113, pp. 111–115, 2009.
[4] R. Bajcsy and Stane Kovačič, “Multiresolution elastic matching,” Comput. Vision, Graph. Image Process., vol. 46, no. 1, pp. 1–21, 1989.
[5] S. J. C. G. Hectors, I. Jacobs, C. T. W. Moonen, G. J. Strijkers, and K. Nicolay, “MRI Methods for the Evaluation of High Intensity Focused Ultrasound Tumor Treatment : Current Status and Future Needs,” Magn. Reson. Med., vol. 317, pp. 302–317, 2016.
[6] V. Rieke and K. B. Pauly, “MR thermometry,” J. Magn. Reson. Imaging, vol. 27, no. 2, pp. 376–390, 2008.
[7] S. A. Sapareto and W. C. Dewey, “Thermal Dose Determination in Cancer Therapy,” Int. J. Radiat. Oncol. Biol. Phys., vol. 10, no. 6, pp. 787–800, 1984.
Figures