3813
Assessing the effect of pre-focal fat on the feasibility of delivering MR guided high intensity focused ultrasound (MRgHIFU) treatment of intra-pelvic tumors1CRUK Cancer Imaging Centre, The Institute of Cancer Research and Royal Marsden Hospital, London, United Kingdom, 2Therapeutic Ultrasound, The Institute of Cancer Research, London, United Kingdom
Synopsis
Models were used to simulate the pre-focal tissue distributions encountered when treating intra-pelvic tumors with magnetic resonance guided high intensity focused ultrasound (MRgHIFU). Focal peak temperature and thermal dose volumes were considerably affected by depth and fat thickness. Exposures of 300 W for ≥20 s (≥6 kJ) were required to generate measurable 30EM dose contours 8 cm deep (6 cm pre-focal fat). The relative distributions of fat and muscle layers had minimal effect on focal heating, but influenced location of potentially damaging pre-focal heating. MRgHIFU treatments to deep-seated intra-pelvic tumors require methods for improving dose delivery at depth.
Background
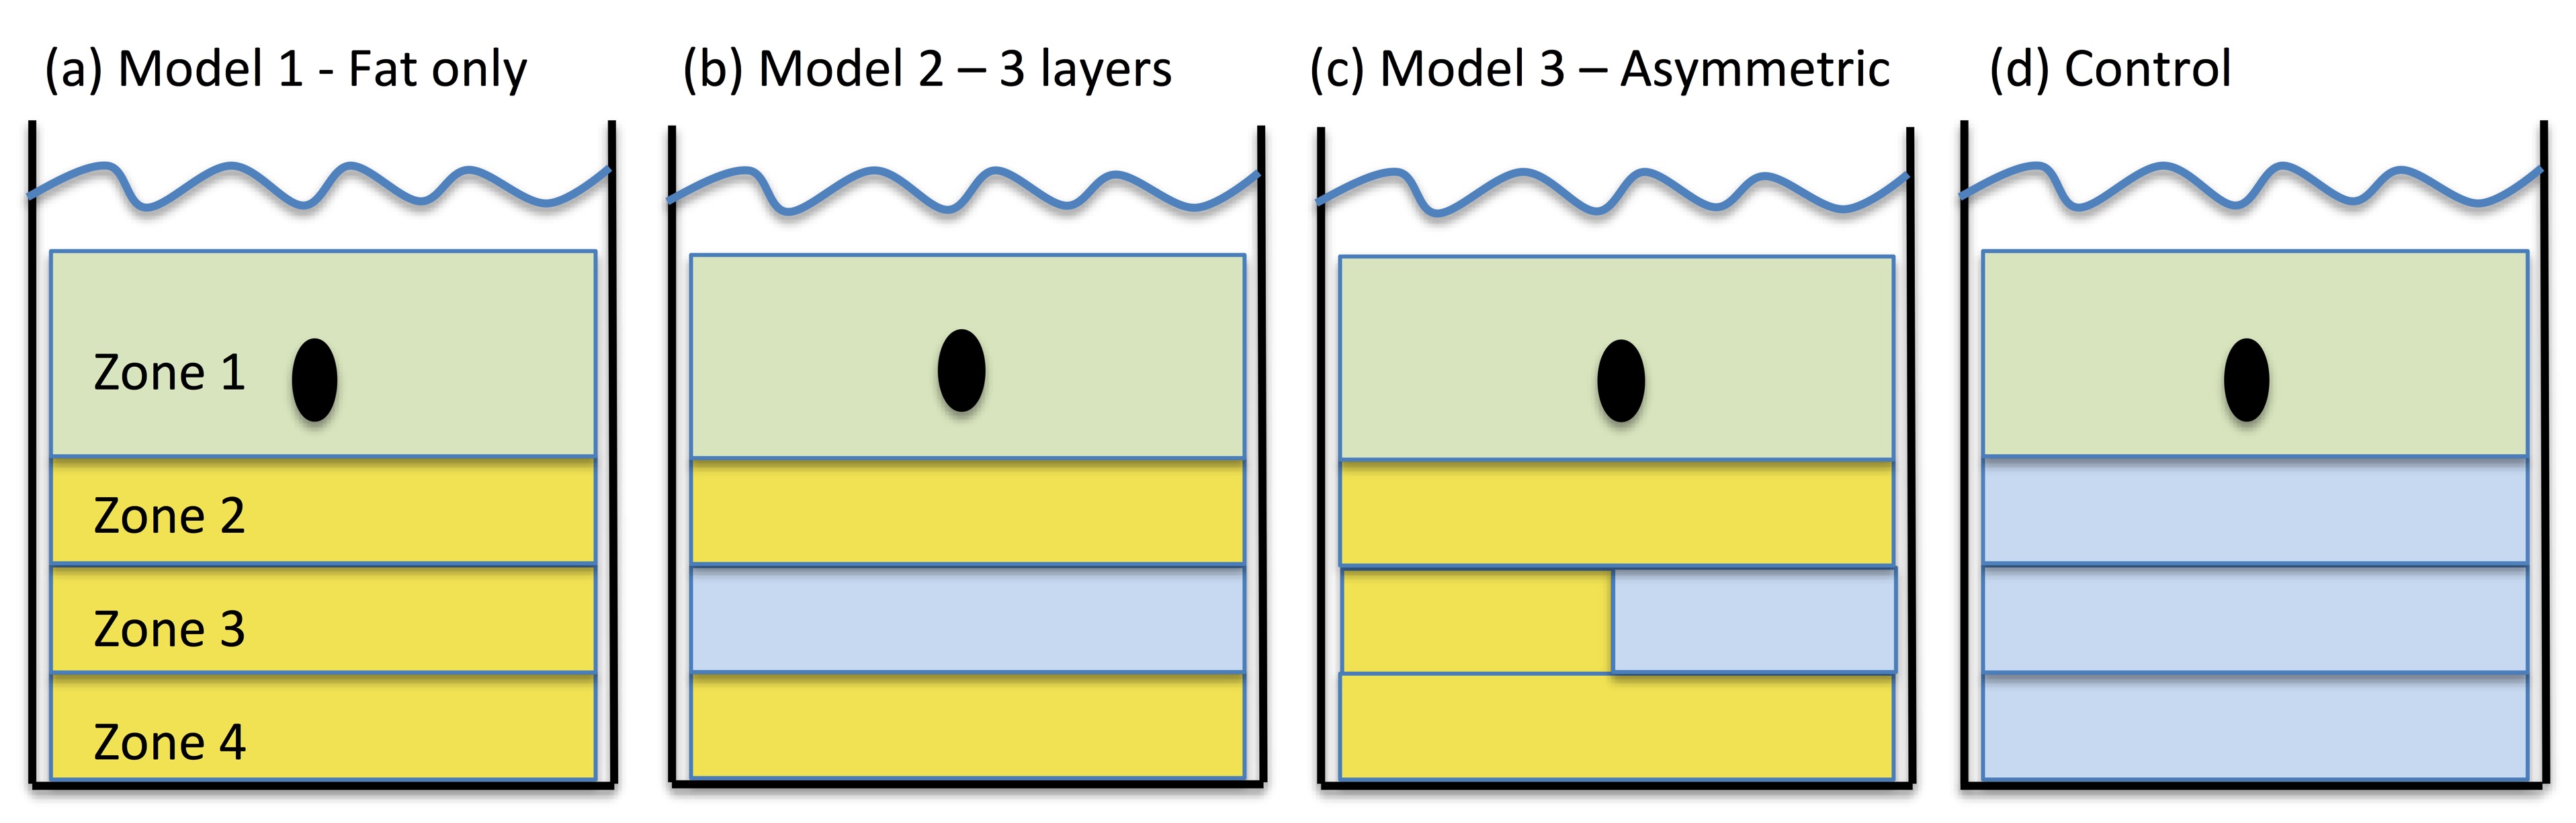
The potential accessibility of recurrent gynecological tumors to magnetic resonance guided high intensity focused ultrasound (MRgHIFU) has been demonstrated1. Most lesions were located at depth (≥7 cm), with pre-focal tissues composed of: (i) homogenous fat, (ii) subcutaneous fat, muscle and intra-pelvic fat, or (iii) asymmetrically distributed layers of fat/muscle/fat laterally, and fat alone medially. HIFU treatments of renal tumors2,3 and uterine fibroids4,5 have identified difficulty in achieving focal thermal ablation through fat layers. It is therefore crucial to establish the effect of thickness and distribution of fat layers on focal heating in order to treat deep-seated intra-pelvic tumors with MRgHIFU effectively.Purpose
To investigate the effect of pre-focal fat thickness and distribution on MRgHIFU heating within a target, by comparing temperature and thermal dose volumes in experimentally simulated tissue distributions.Methods
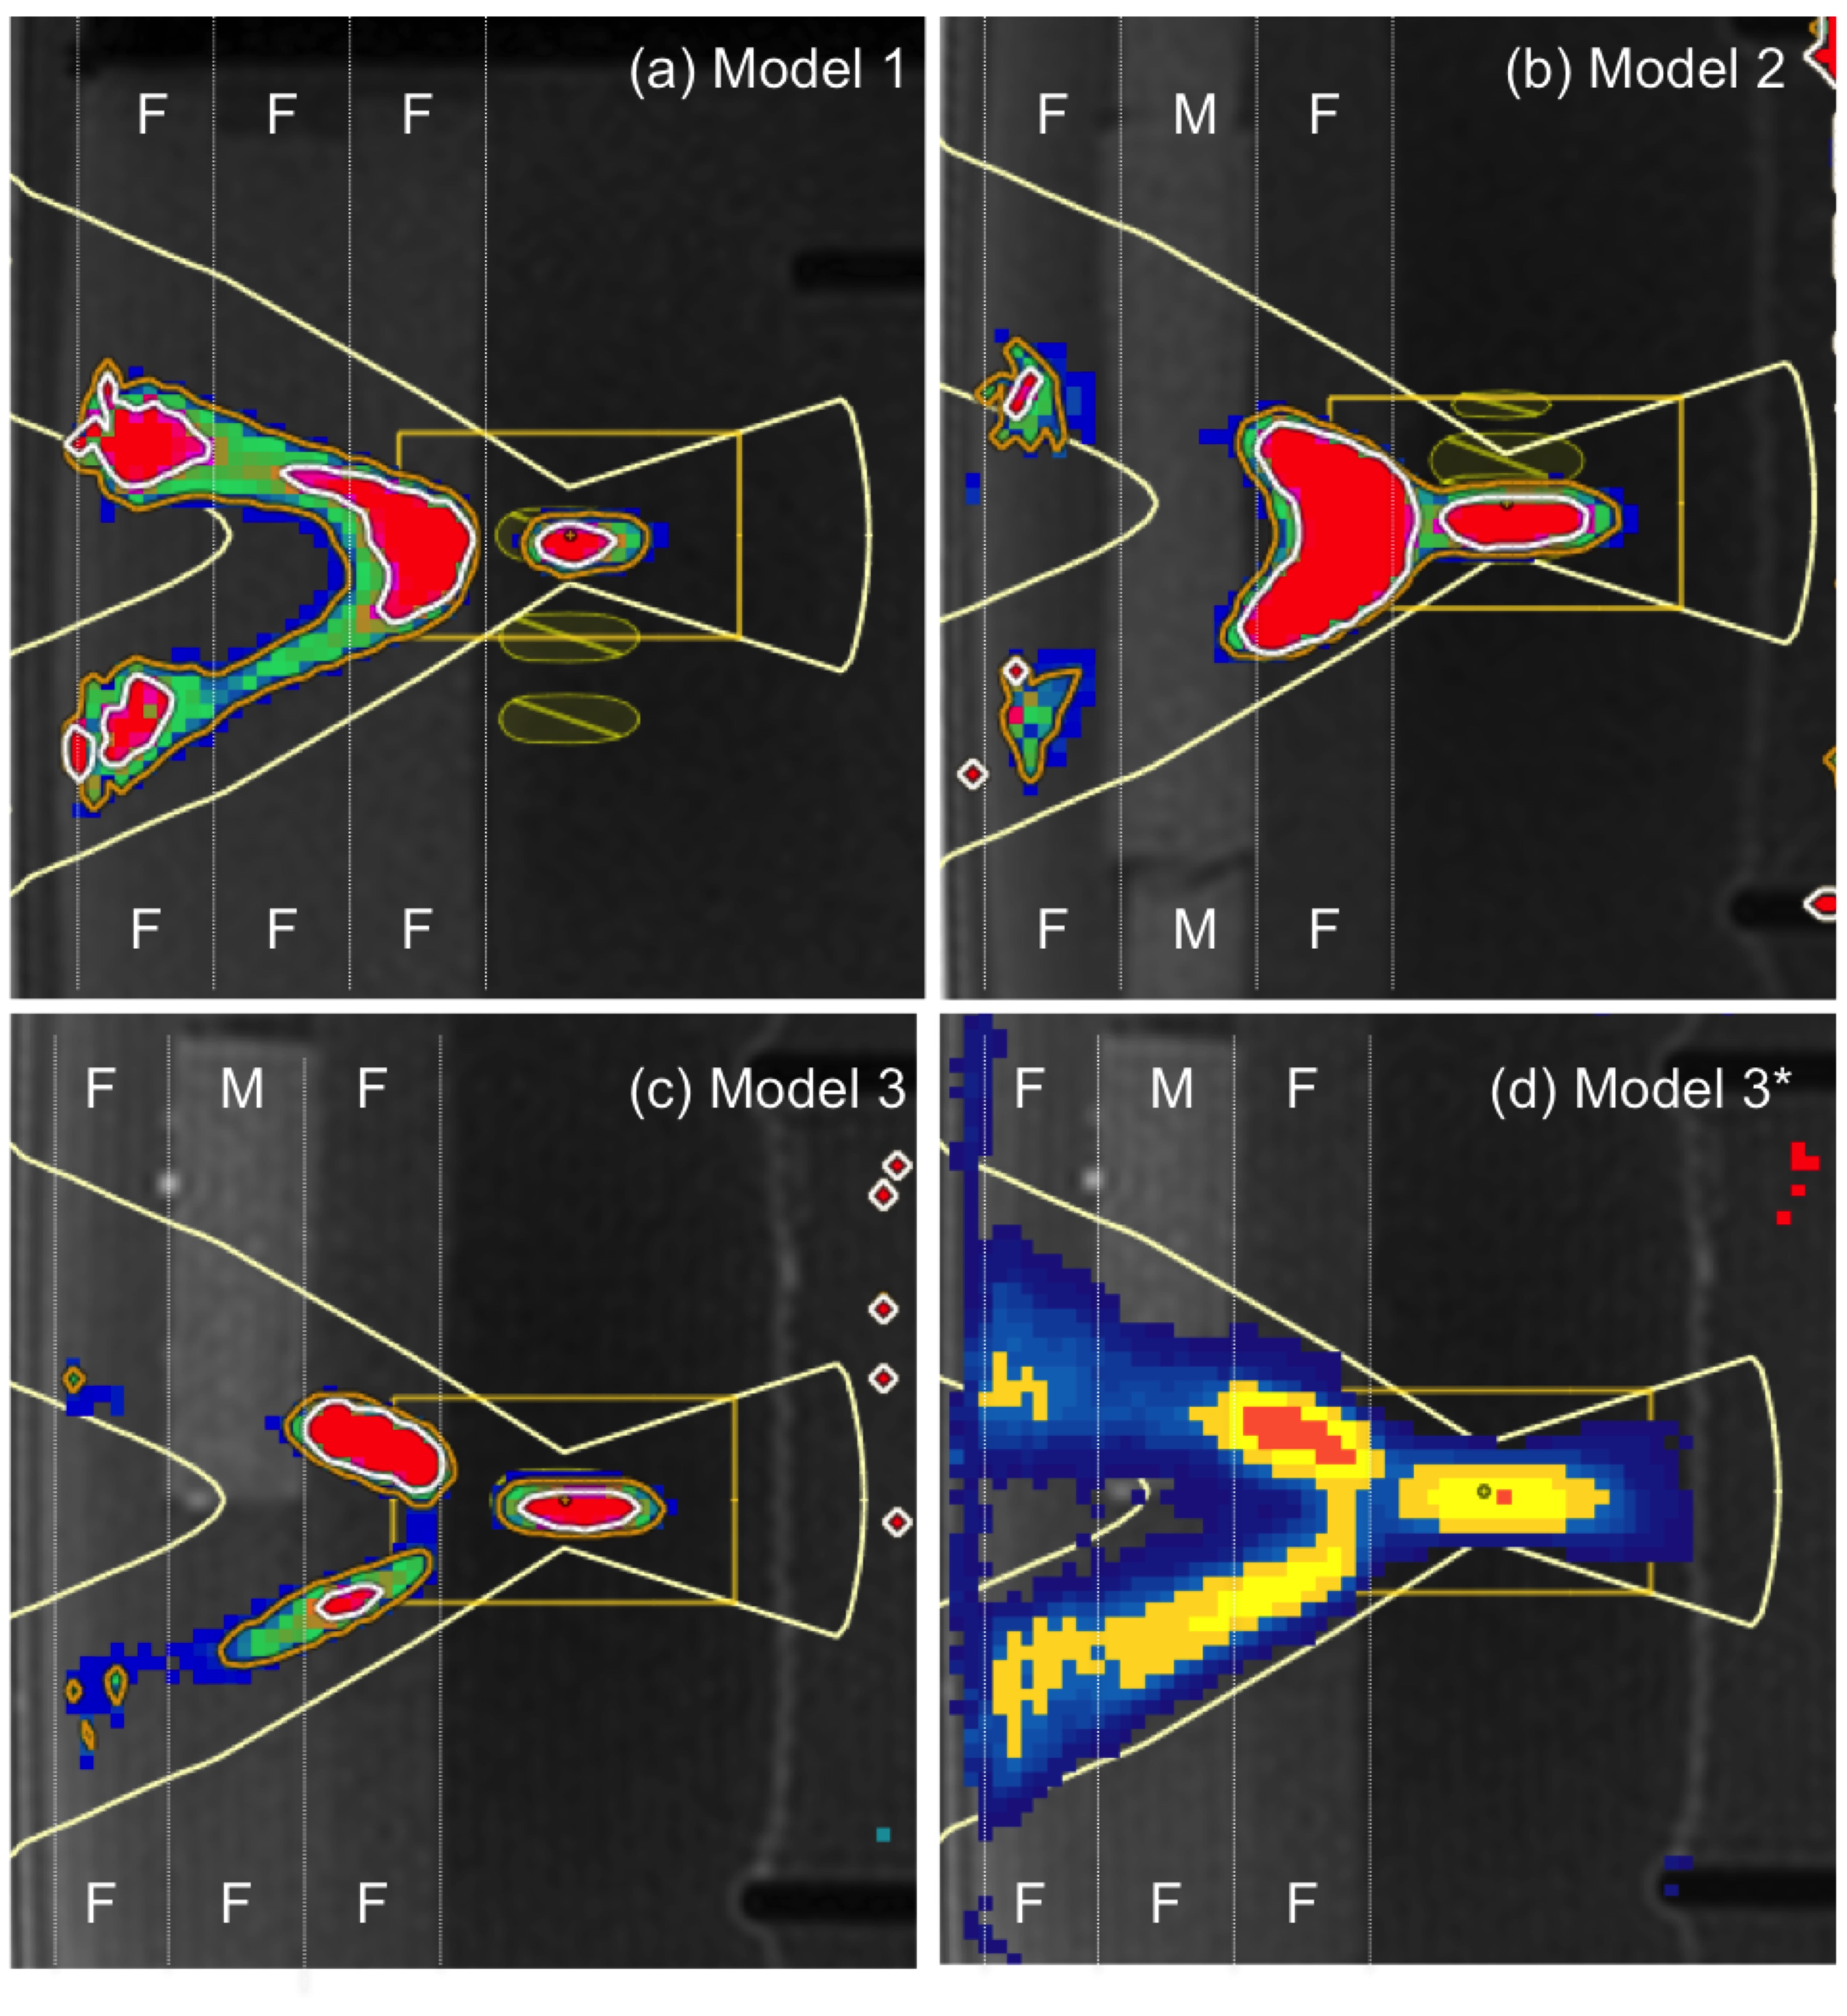
Model systems: Experimental models represented 3 tissue distributions seen clinically (Figure 1). Experiments were conducted using a Sonalleve MRgHIFU system (Profound Medical, Ontario, Canada) to deliver exposures at clinically relevant exposure levels (up to 300 W electrical power).
Tissue mimicking materials: Three 2 cm thick discs of (i) agar-silica gel6 (sound speed 1486±0.7 m/s, attenuation coefficient 1.16±0.01 dB/cm/MHz) and (ii) an agar-based material7 (sound speed 1538±1.2 m/s, attenuation coefficient 0.55±0.01 dB/cm/Hz) were used as fat and muscle mimics respectively. The target material was one 4 cm thick disc of poly-acrylamide gel8 (sound speed 1523±3.3 m/s, attenuation coefficient 0.38±0.05 dB/cm/MHz).
Measurement methods: Proton resonance frequency shift (PRFS) thermometry assessed heating in focal and pre-focal regions by measuring (i) focal peak temperature, (ii) focal thermal dose volume (V30EM: product of 3 orthogonal 30EM dose contours), and (iii) peak temperature in the near-field (Zone 4), and presence of any pre-focal thermal dose contours.
Assessing depth-dependent changes: Exposures 4, 6 and 8 cm deep were made in the target material for fat Model 1 and the control set-up, loaded with 1, 2 or 3 discs of fat or muscle mimics. Exploratory exposures using 8 mm diameter cells were made at different electrical power settings until 30EM focal thermal dose contours were generated. ≥3 different exposures at and above this exposure threshold were then delivered ≥3 times each, with ≥10 minutes cooling between exposures.
Comparing pre-focal distributions: Exposures were made 8 cm deep in the target material for Models 1, 2 and 3, loaded with 3 discs of fat/muscle mimics. After exploratory exposures, 3 sets of 300 W exposures were then delivered 3 times for durations of 20, 30 and 40 s for each Model, with ≥10 minutes cooling between exposures.
Results
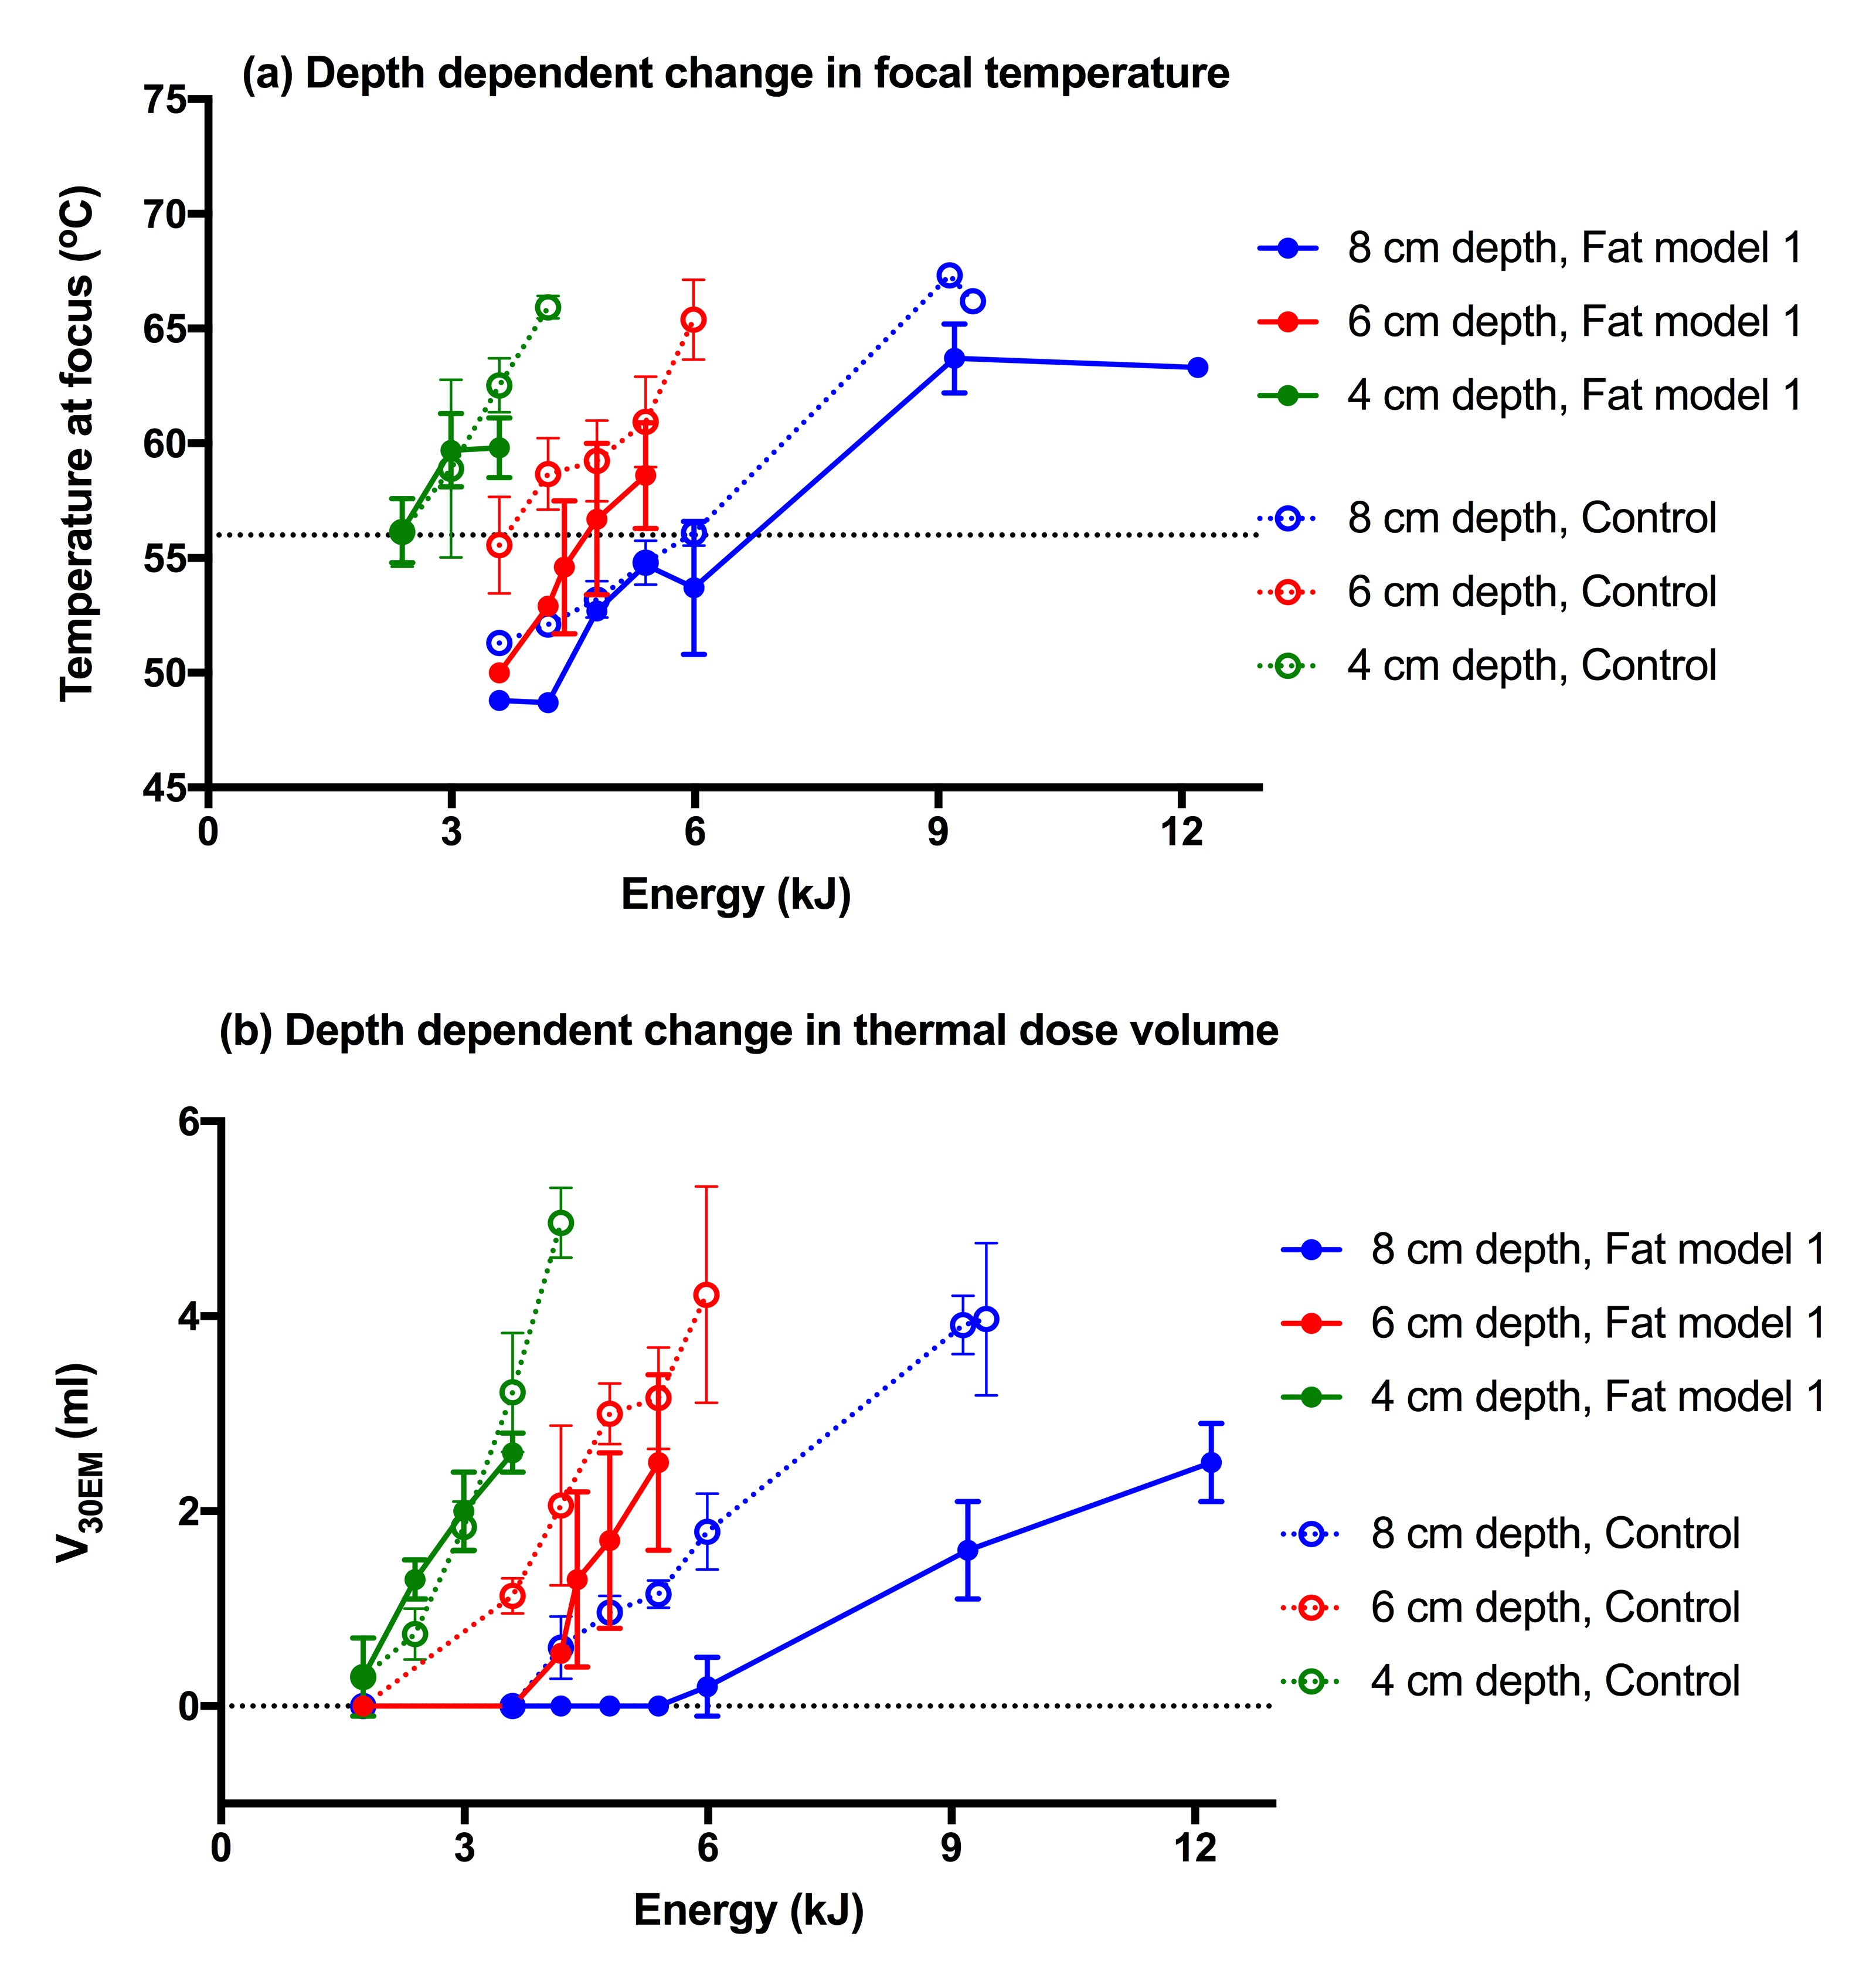
Assessing depth-dependent changes: Focal peak temperature and thermal dose volume were affected by depth (Figure 2). In the fat model, exposures of 300 W for ≥20 s (≥6 kJ) were required to generate measurable 30EM dose contours at 8 cm depth: almost double the energy required to achieve comparable thermal dose volumes at 6 cm (or at 8 cm depth in the control set-up), and almost 3 times that at 4 cm.
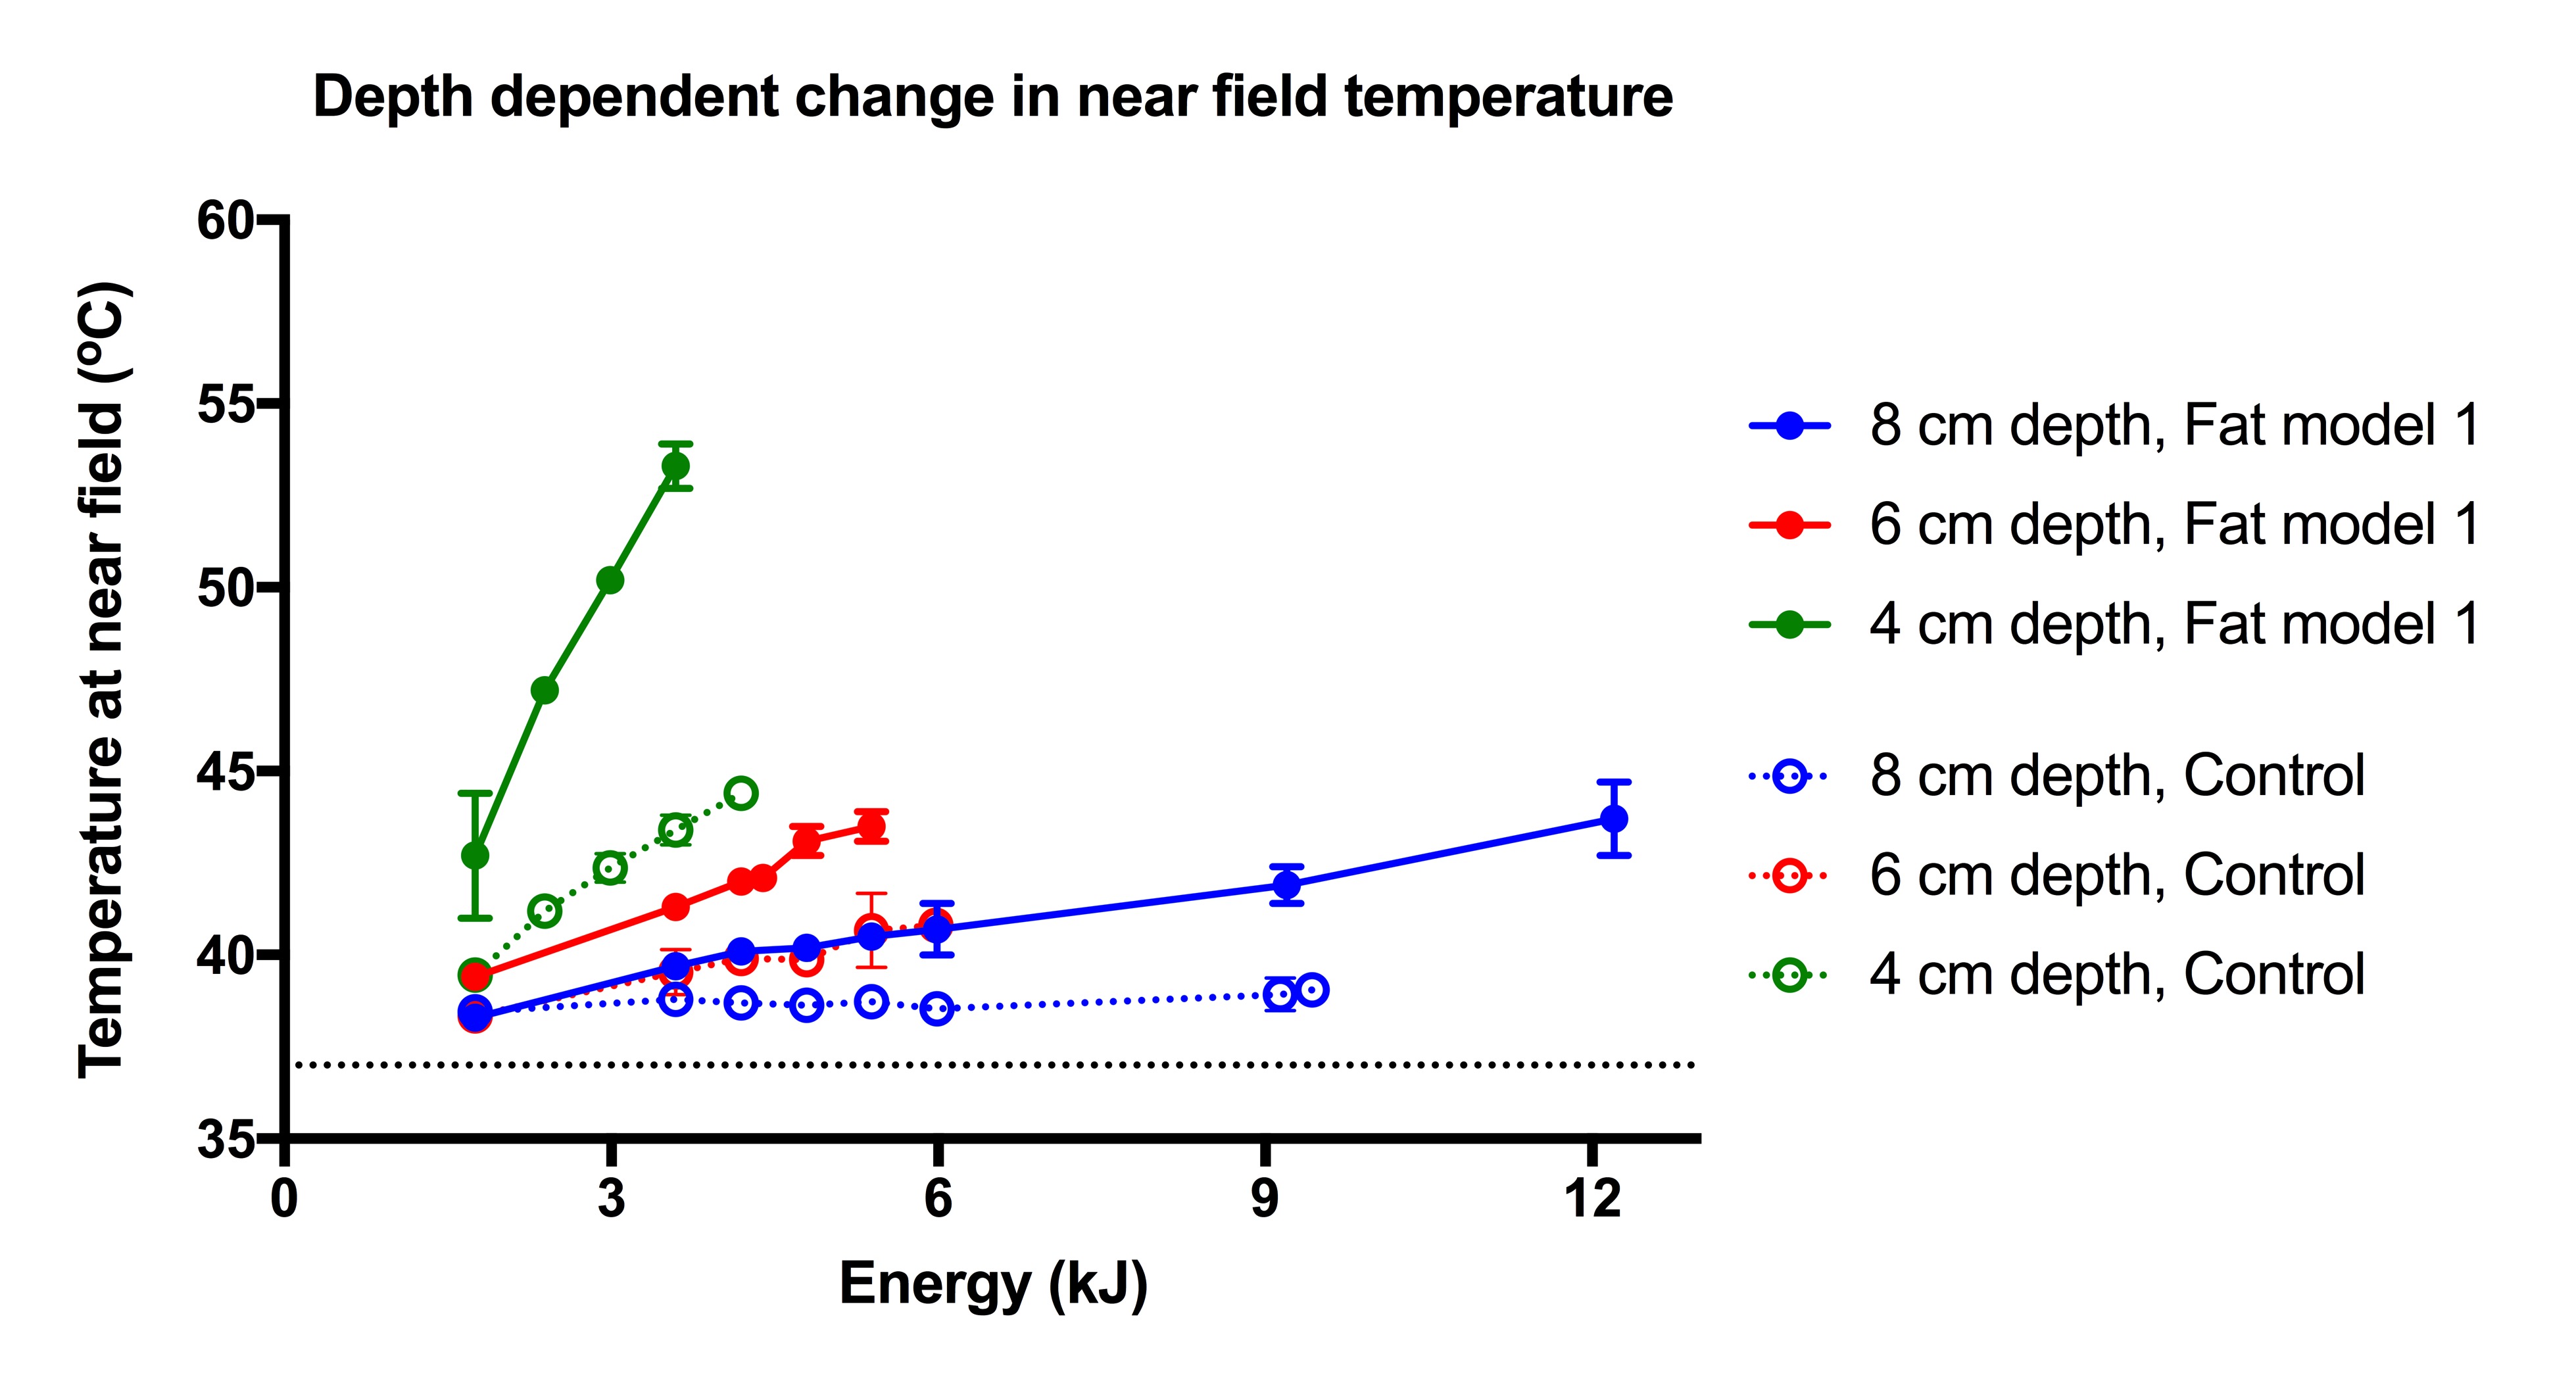
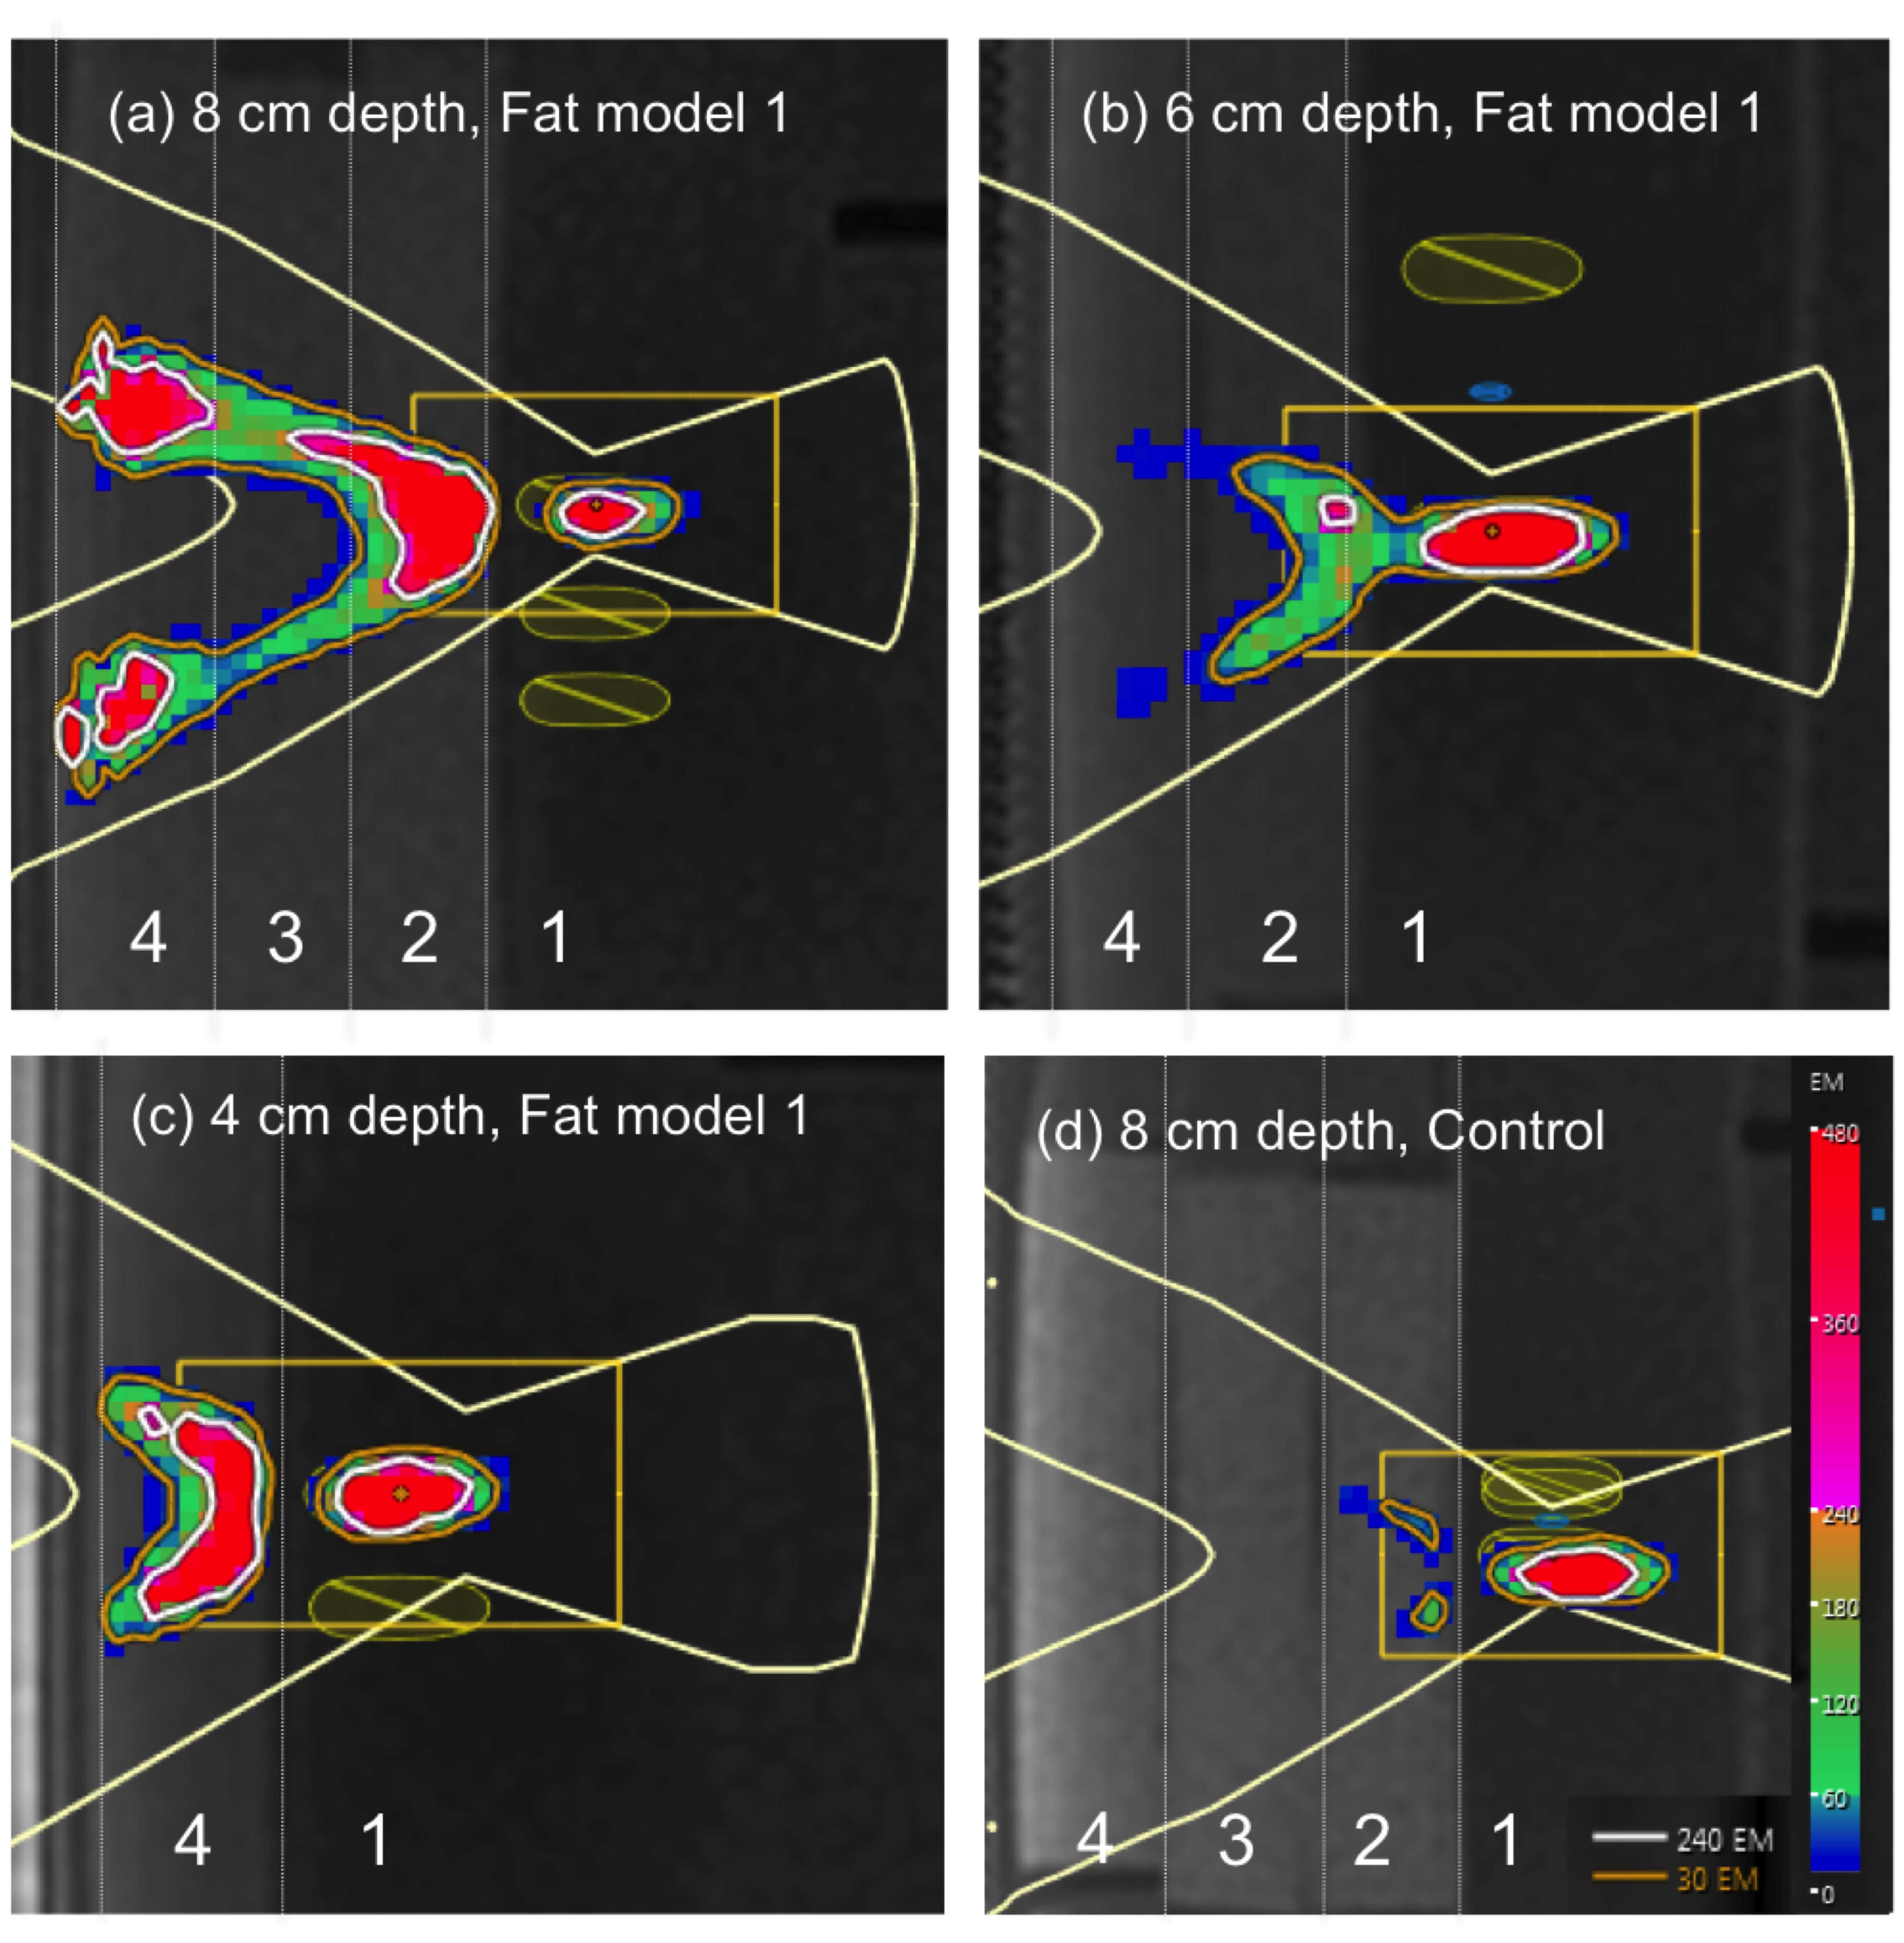
Pre-focally, near-field temperature increased with decreasing depth for the fat and control models (Figure 3), but was greater in the fat model. Differences were most striking at the shallowest (4 cm) depth. Thermal dose contours were seen for the fat model at all depths (>6 kJ at 8 cm, >5 kJ at 6 cm, >2.4 kJ at 4 cm), but were absent in the control set-up (Figure 4).
Comparing pre-focal distributions: There were only small differences in focal peak temperature between models. The energy at which thermal dose volumes became measurable (6 kJ) was the same for all models, but dose volumes were larger for Model 2 once above this threshold.
Pre-focally, thermal dose contours in the near-field were largest for Model 1 (Figure 5). The muscle-mimicking layer appeared to intensify heating in the immediate pre-focal fat region, but decrease it in the near-field region.
Discussion and Conclusion
These data highlight the challenges of achieving focal heating at depth, with maximal 300 W exposures required to achieve measurable thermal dose volumes in the fat mimicking models. The distribution of fat and muscle layers had little effect on focal heating, but influenced the location of pre-focal heating. Our models may have overestimated energy loss from attenuation, if differences between attenuation coefficients of fat and muscle mimics were greater than in-vivo2,9-12, but probably underestimated loss from focal aberration, due to the uniformity of interfaces and small sound speed differences. Greater clarity may be provided by a computational approach13. For MRgHIFU treatments to deep-seated intra-pelvic tumors, new methods may need to be established to improve dose delivery at depth.Acknowledgements
CRUK and EPSRC support to the Cancer Imaging Centre at ICR and RMH in association with MRC and Department of Health C1060/A10334, C1060/A16464 and NHS funding to the NIHR Biomedical Research Centre and the Clinical Research Facility in Imaging.References
1. Giles SL, Rivens I, De Paepe K, Morgan VAM, Imseeh G, ter Haar GR, et al., editors. #4047: MR guided High Intensity Focused Ultrasound (MRgHIFU) for treating recurrent gynecological tumors: a pilot feasibility study ISMRM; 2018; Paris.
2. Ritchie R, Collin J, Coussios C, Leslie T. Attenuation and de-focusing during high-intensity focused ultrasound therapy through peri-nephric fat. Ultrasound Med Biol. 2013;39(10):1785-93.
3. Ritchie RW, Leslie T, Phillips R, Wu F, Illing R, ter Haar G, et al. Extracorporeal high intensity focused ultrasound for renal tumours: a 3-year follow-up. BJU Int. 2010;106(7):1004-9.
4. Keserci B, Duc NM. Magnetic Resonance Imaging Parameters in Predicting the Treatment Outcome of High-intensity Focused Ultrasound Ablation of Uterine Fibroids With an Immediate Nonperfused Volume Ratio of at Least 90. Acad Radiol. 2018.
5. Mindjuk I, Trumm CG, Herzog P, Stahl R, Matzko M. MRI predictors of clinical success in MR-guided focused ultrasound (MRgFUS) treatments of uterine fibroids: results from a single centre. Eur Radiol. 2015;25(5):1317-28.
6. Partanen A, Mougenot C, Vaara T, editors. Feasibility of Agar-Silica Phantoms in Quality Assurance of MRgHIFU. ISTU; 2008; Minneapolis, MN, USA: AIP Conference Procedings.
7. National Physical Laboratory. Surface Temperature Test Phantom http://www.npl.co.uk/instruments/products/acoustics/surface-temperature-test-phantom/:National Physical Laboratory; 2018
8. Computerized Imaging Reference Systems Inc. Ultrasound QA FAQS http://www.cirsinc.com/support/ultrasound-qa-faqs:Computerized Imaging Reference Systems, Inc.; 2018
9. Cannon LM, Fagan AJ, Browne JE. Novel tissue mimicking materials for high frequency breast ultrasound phantoms. Ultrasound Med Biol. 2011;37(1):122-35.
10. Nasief HG, Rosado-Mendez IM, Zagzebski JA, Hall TJ. Acoustic Properties of Breast Fat. J Ultrasound Med. 2015;34(11):2007-16.
11. El-Brawany MA, Nassiri DK, Terhaar G, Shaw A, Rivens I, Lozhken K. Measurement of thermal and ultrasonic properties of some biological tissues. J Med Eng Technol. 2009;33(3):249-56.
12. Taniguchi DK, Martin RW, Myers J, Silverstein FE. Measurement of the ultrasonic attenuation of fat at high frequency. Acad Radiol. 1994;1(2):114-20.
13. Suomi V, Jaros J, Treeby B, Cleveland R. Full Modelling of High-Intensity Focused Ultrasound and Thermal Heating in the Kidney using Realistic Patient Models. IEEE Trans Biomed Eng. 2018.
Figures