3808
Longitudinal assessment of Focused ultrasound (FUS) induced Blood-Brain Barrier (BBB) opening in the non-human primate under 7T MRI1Interdisciplinary Institute of Neuroscience and Technology (ZIINT), Qiushi Academy for Advanced Studies, Zhejiang University, Hangzhou, China, Hangzhou, China, 2College of Biomedical Engineering & Instrument Science,Zhejiang University, Hangzhou, China, Hangzhou, China, 3School of Medicine, Department of Electrical Engineering, Chang Gung University, Taoyuan, Taiwan, Taiwan, China
Synopsis
Microbubble-mediated focused ultrasound can noninvasively induce reversible blood-brain barrier (BBB) opening in both rodents and non-human primates. However, it remains unclear whether FUS-induced BBB opening is accompanied by neuromodulation. Here we longitudinally characterized the duration and the functional effects of FUS-induced BBB opening by measuring changes in contrast-enhanced T1-weighted images (T1-WIs) and blood-oxygen-level dependent (BOLD) responses, respectively. The results show that BBB recovered at 6.5h post-FUS exposure. The blood-oxygen-level dependent (BOLD) changes during the visual stimulus pre- and post- FUS exposure didn't show similar change trend in both hemispheres. The results of fMRI-guided FUS may contribute to the development of FUS-induced BBB opening for clinical applications.
Introduction
Focused ultrasound (FUS) with the intravascular presence of circulating microbubbles (MBs) can noninvasively and locally disrupt the blood-brain barrier (BBB) as a result of ultrasonic cavitation effect.1-3 However, clinical implementation of FUS requires careful evaluation of its safety and efficacy, including the identifications of brain tissue injury and neuromodulation effect. Ultra-high field magnetic resonance imaging (MRI) has been demonstrated as a precise tool to provide BLOD change in such a local BBB disruption.4,5 The aim of this study was identifying the duration of BBB opening after FUS sonication via contrast-enhanced T1-weighted images (T1-WIs) and confirming the accompanied with neuromodulation effect by measuring the blood-oxygen-level-dependent (BOLD) responses using the visual evoked fMRI in 7T MRI.Methods
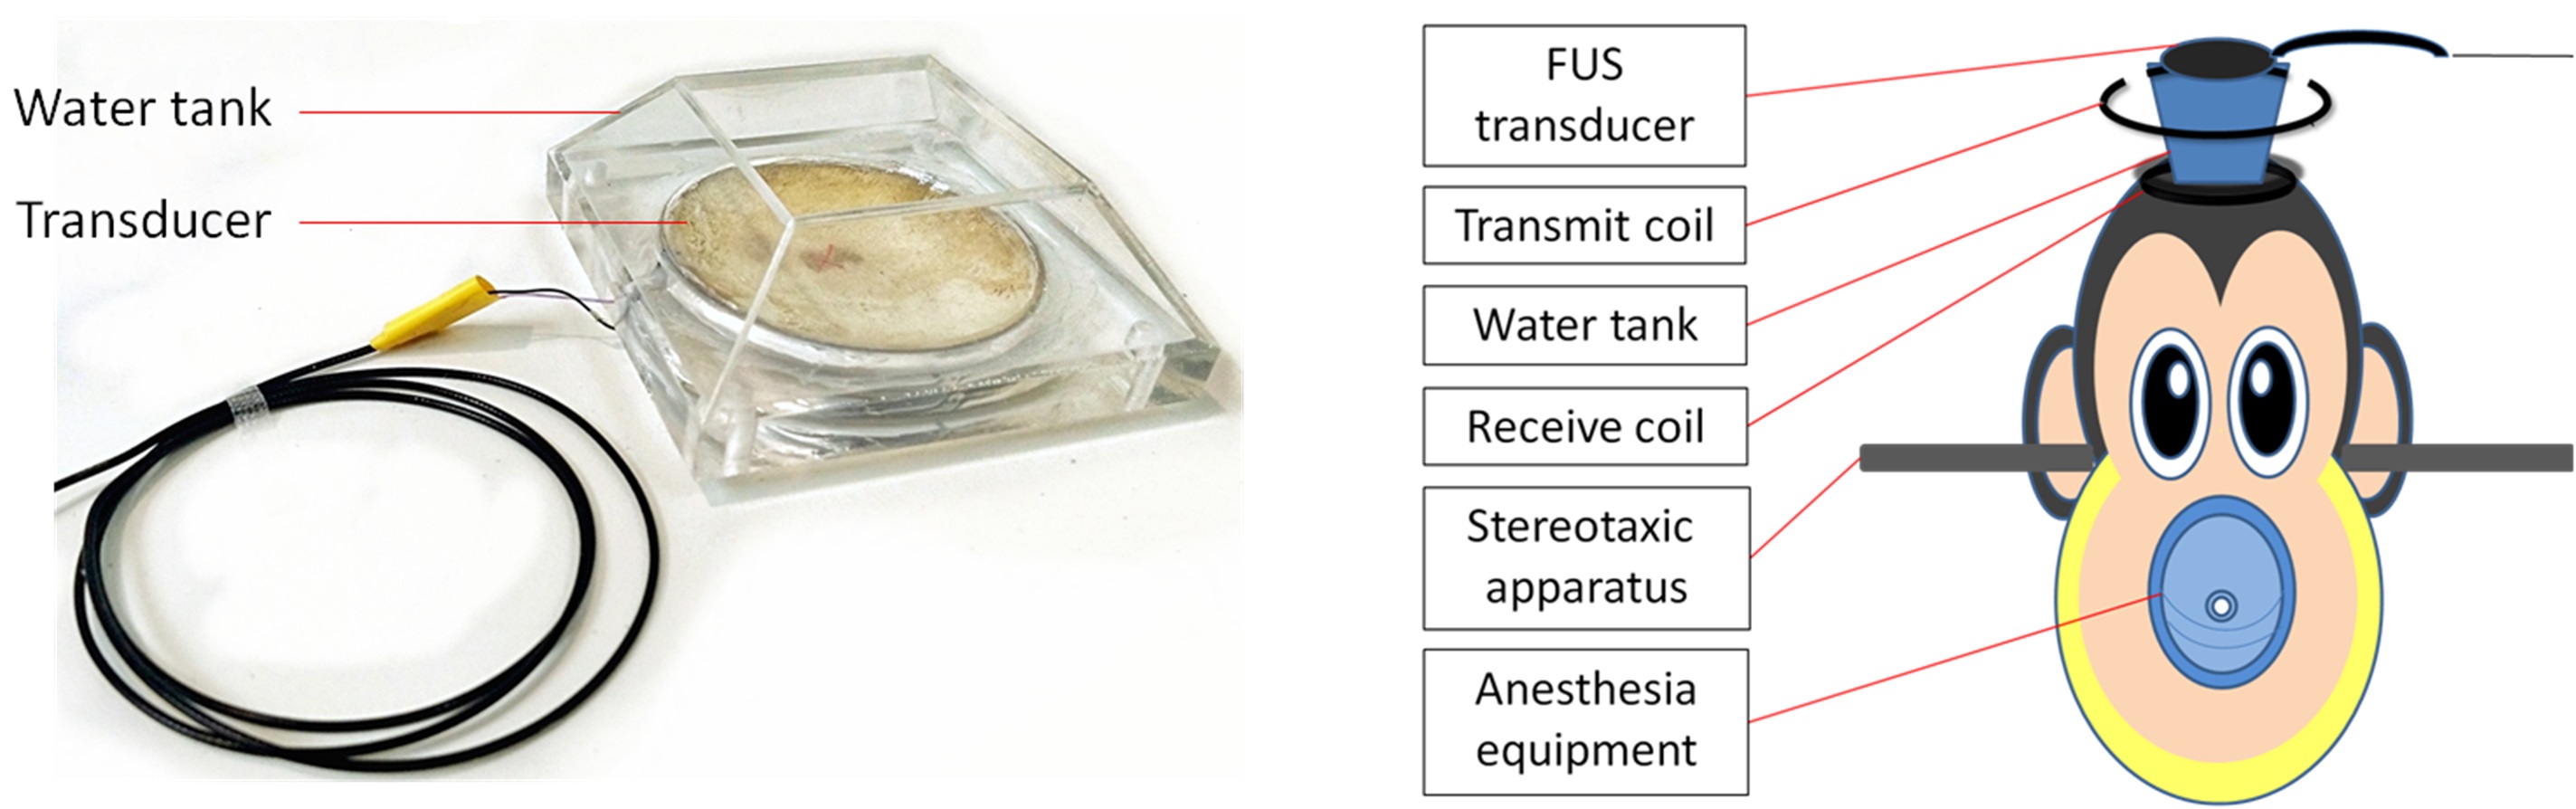
Two adult male crab-eating macaques (weight 3.8 kg and 3 kg) were studied. Animals were placed in a MR-compatible stereotaxic frame after initially anesthesia with 10 mg/kg ketamine and then were maintained a stable state of anesthesia with isoflurane (0.2-0.3%), ketamine (0.1 mg/kg*h) and vecuronium (0.1 mg/kg*h) during functional MRI data acquisition. EtCO2 of 23-27 mHg and SPO2 above 96%, and a circulated warm water pad was used to maintain rectal temperature at 37±0.5°C. Immediately after microbubble administration, the 305 kHz lab-designed MRI-compatible FUS transducer (Figure 1) applied transcranial ultrasound exposure under the following parameters: mechanical index (MI) = 0.55, sonic duration = 90 s, pulse-repetition frequency = 1 Hz, targeting at right primary visual cortex. The visual binocularly block stimulus were performed pre- and post- FUS by a Visual Stimulation System (SINORAD, China) with a block-design with 36 s initial rest, 36 s stimulation on followed by 36 s OFF. All MRI images were acquired using 7T research system (Siemens, Erlangen, Germany) for up to 48 h. The contrast-enhanced T1-WIs by a turbo spin echo (TSE) sequence (TR=2300 ms, TE=18 ms, BW=100 Hz, Voxel size: 1.5×1.5×1.5 mm3)g. The MRI contrast-agents, Gd-DTPA (Gd-DTPA, 0.3 mmol/kg), were IV injected at 0.1-h, 3-h, 6-h and 48-h post ultrasound to evaluate the BBB permeability. BOLD-fMRI data were acquired by a prototype multiband echo planar imaging (EPI) sequence (TE = 24.2 ms, TR = 2000 ms, BW =1710 Hz, voxel size = 1.5×1.5×1.5 mm3). Diffusion Weighted Imaging (DWI) sequence (TE = 63 ms, TR = 5000 ms, BW =908 Hz, voxel size = 1.5×1.5×1.5 mm3). BOLD signals were analyzed by the seed-based correlation analysis with a 2 x 2 pixel region of interest (ROI) in the visual cortex using AFNI.Results and Discussion
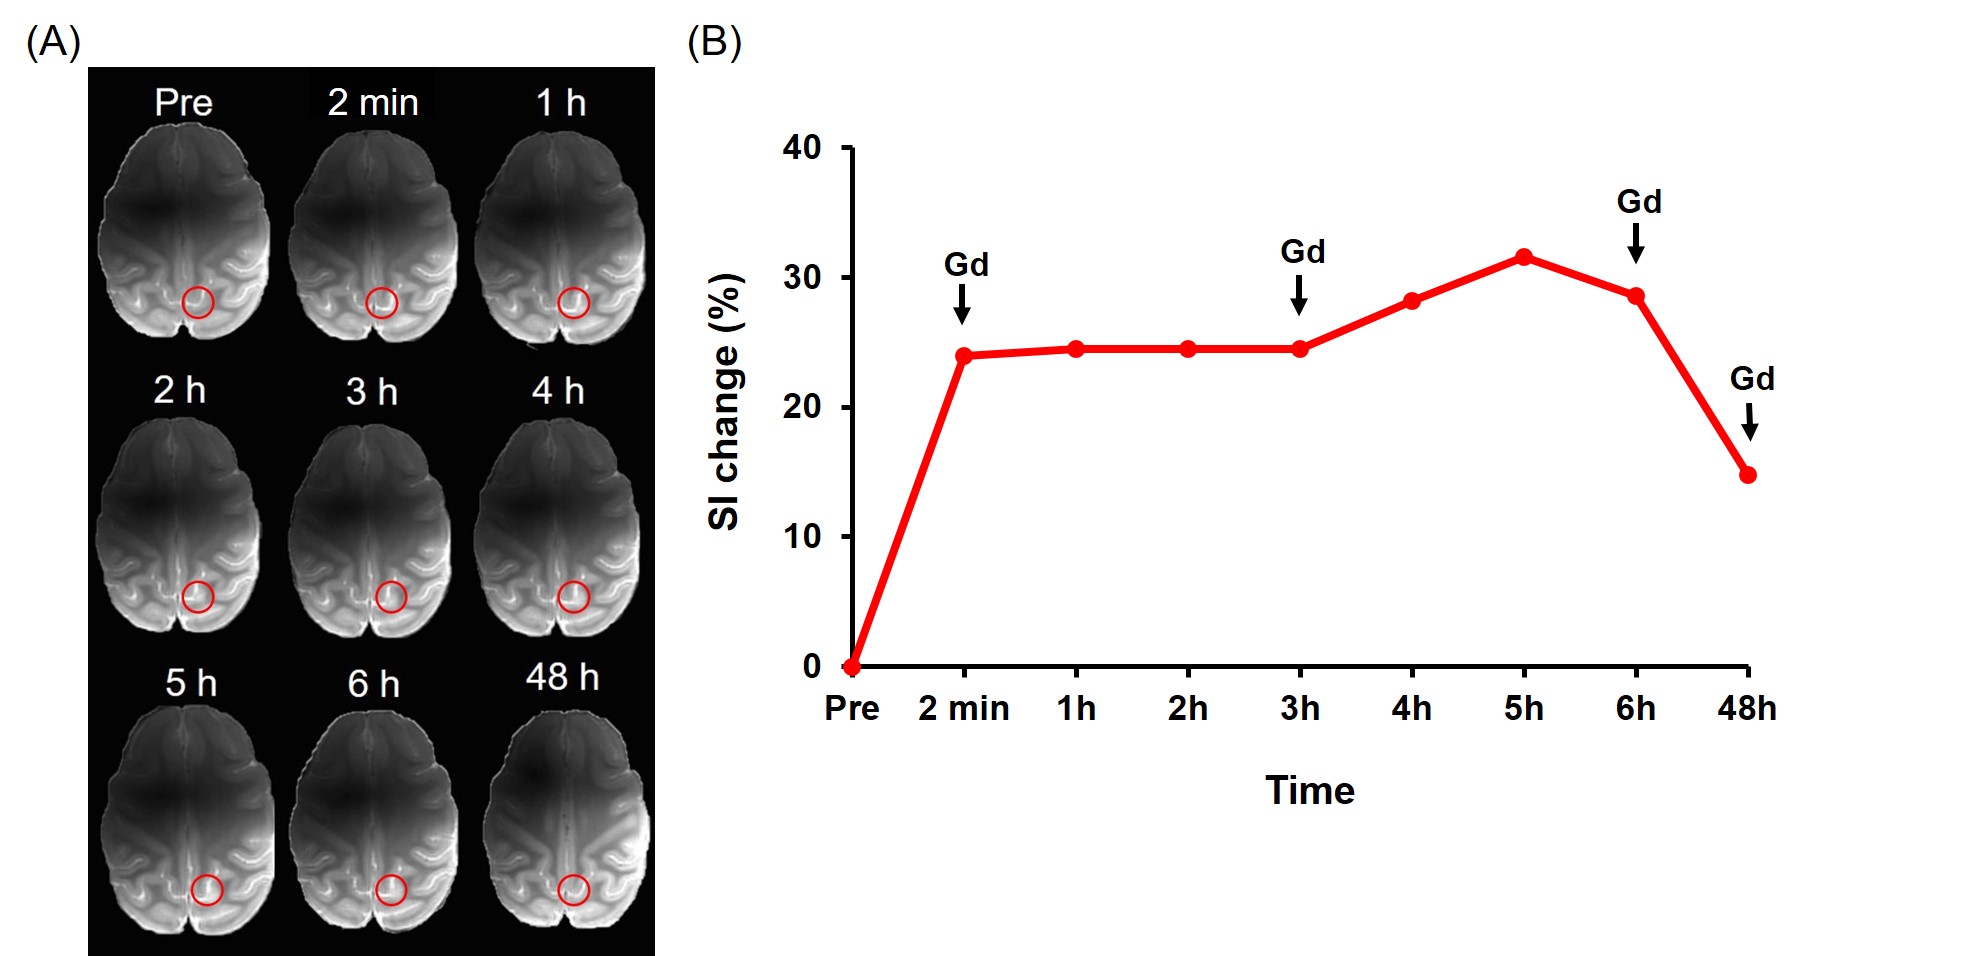
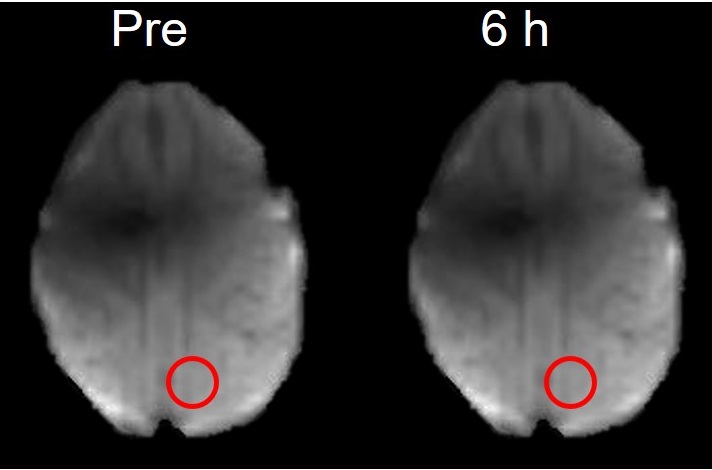
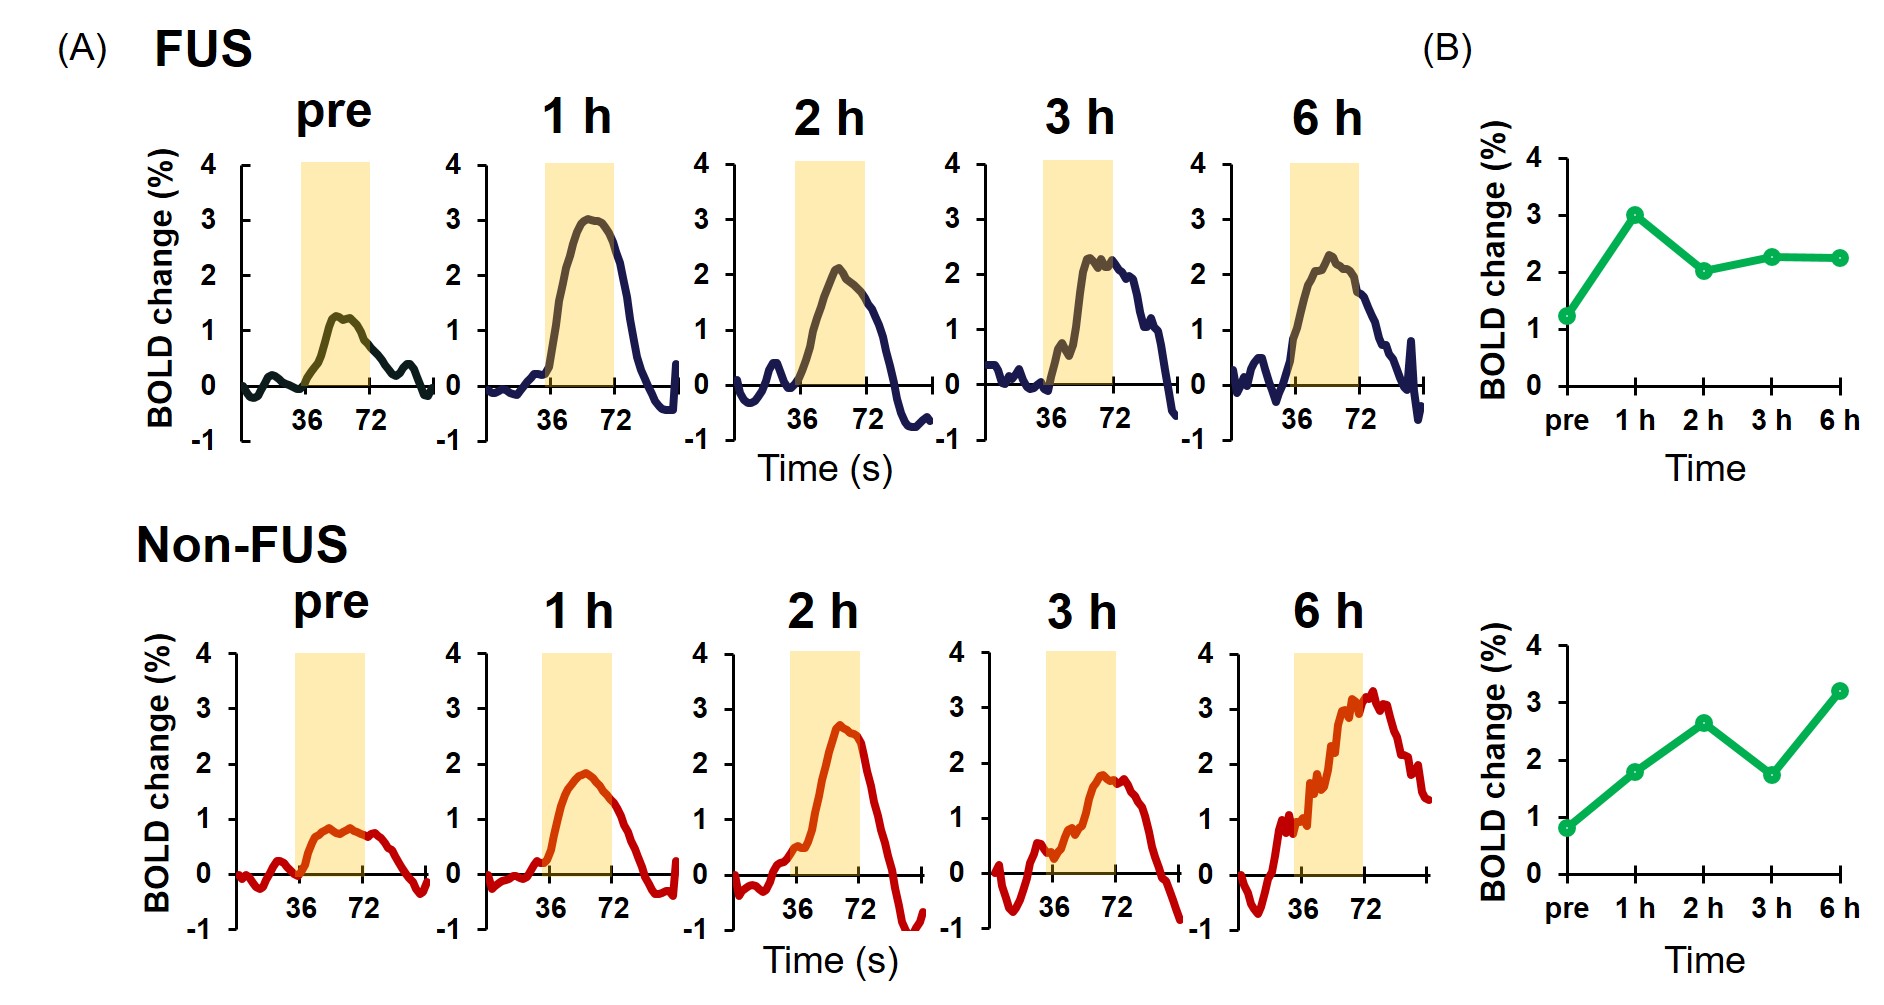
Contrast-enhanced T1-WIs at different time points revealed the local BBB opening in the right primary visual cortex (Figure 2A). Gd-DTPA leakage at the FUS exposure site was evaluated via SI changes obtained from the subtracted T1-WIs between pre- and post-FUS exposure to identify BBB-opening. The SI change significantly decreased at 5 h post-FUS exposure and show a more obvious decrease trend at 6 h after Gd injection, representing recovery of the BBB (Figure 2B). Figure 3 shows no edema in the FUS targeted area compared with the DWI images pre FUS exposure, proving that the process of BBB opening didn’t result in brain tissue injury. Figure 3 is the comparison of visual stimulus-evoked fMRI BOLD responses pre- and post- FUS-induced BBB opening in the macaque brain. According to the results of visual stimulus at different time points, the group-averaged BOLD signal change values significantly increased in both FUS and non-FUS side (Figure 4A). The light Yellow-shaded area indicates the visual stimulus duration. Figure 4B showed that the average BOLD responses peaked at 1h at FUS side while the BOLD changes continually increased at 1 h and 2 h and the maximum at 6 h at non-FUS side. The BOLD change may caused by animal physiological status even EtCO2 and SPO2 were maintained stably. The results indicated the FUS-induced BBB opening didn't cause any tissue damage and functional influence in monkey brain.Conclusion
We confirmed that MB-presented FUS exposure could successfully induce temporal and noninvasive BBB opening in monkeys monitoring by 7T MRI. It is also inferred that the BBB-opened process didn't induce additional neuromodulation. This research, together with 7T MRI, might potentially provide the basis for clinical application.Acknowledgements
This work was supported by grants from the Fundamental Research Funds for the Central Universities (2016QN81017) and the National Natural Science Foundation of China (81527901, 61673346, 81527901)
References
1. Tung Y, Fotios V, Selert K, et al. Bubble dependence of the mechanism FUS‐induced blood‐brain barrier opening in mice in vivo.[J]. Journal of the Acoustical Society of America, 2011, 129(7):395-400. 2. Lin C Y, Hsieh H Y, Chen C M, et al. Non-invasive, neuron-specific gene therapy by focused ultrasound-induced blood-brain barrier opening in Parkinson's disease mouse model. Journal of Controlled Release, 2016, 235:72-81. 3. Tung Y S, Wu S Y, Marquet F, et al. Quantification of stable cavitation dose during FUS-induced blood-brain barrier opening in mice and in non-human primates[C]// Ultrasonics Symposium. IEEE, 2013:244-247. 4. Treat L H, Mcdannold N J, Hynynen K. Transcranial MRI‐guided FUS‐induced BBB opening in the rat brain[J]. Journal of the Acoustical Society of America, 2004, 115(5):2524-2525. 5. Jenne J W, Krafft A J, Maier F, et al. The dynamic of FUS‐induced BBB Opening in Mouse Brain assessed by contrast enhanced MRI[C]// American Institute of Physics, 2010:182-185.Figures