3807
Temporal changes in multiparametric imaging features of the prostate gland following MRgFUS ablation1Department of Radiology, Stanford University School of Medicine, Stanford, CA, United States, 2Stanford University, Palo Alto, CA, United States, 3Department of Urology, Stanford University School of Medicine, Stanford, CA, United States
Synopsis
Magnetic resonance guided high intensity focused ultrasound (MRgFUS) can be used for focal therapy of prostate cancer. After treatment, these men remain in active surveillance. Effective monitoring of these men requires an understanding of the expected MRI appearance of the prostate after MRgFUS. Twenty-three patients treated with MRgFUS for focal, intermediate risk MR imaging-visible prostate cancer were followed with serial MRI for 6-24 months. We describe temporal changes in the qualitative and quantitative multiparametric imaging features of the prostate gland post-MRgFUS ablation to aid radiologists to better interpret follow-up examinations to detect residual or new disease.
Introduction
Prostatectomy or radiation therapy remain the standard treatments for high-risk prostate cancer, while active surveillance is appropriate for low-risk disease. For intermediate-risk prostate cancer, focal therapy avoids morbidity of surgery or radiation while maintaining favorable oncologic outcomes1.
MR-guided high intensity focused ultrasound (MRgFUS) is under investigation for focal therapy of men with localized, MRI-visible intermediate-risk prostate cancer. During MRgFUS, MRI is used to visualize the target using T2- and diffusion-weighted imaging, monitor therapy using MRI thermometry, and immediately assess the result using post-contrast T1-weighted imaging showing the lesion has been encompassed by the non-perfused volume (NPV) of the ablation cavity.
As in all oncologic therapies, follow-up post-MRgFUS ablation of prostate cancer is crucial. Prostate-specific antigen (PSA) levels can be challenging to interpret due to variable residual viable prostatic tissue2,3, while biopsy plays an important role but carries additional risks of morbidity4. Imaging features after focal laser ablation and cryotherapy have been described, but may vary depending on ablation modality5; specifically, there is a little information systematically describing multiparametric MR imaging features post-MRgFUS6,7. Additionally, imaging features after focal therapy may overlap with those of tumor5. Unlike these prior reviews, our study population does not include evidence of disease within the treatment zone on biopsy, allowing more reliable characterization of the normal benign imaging course6-8. Understanding this pattern is critical for accurately identifying residual or new disease and treatment complications.
The goal of this study is to assess qualitative and quantitative features of multiparametric MRI after MRgFUS.
Methods
This was retrospective study of patients enrolled in an institutional review board-approved multicenter clinical trial (ClinicalTriasl.gov Identifier: NCT01657942) of MRgFUS. Patients provided informed written consent before enrolling. 23 patients were identified meeting the inclusion criteria: (1) MRgFUS performed at our institution between February 2016 and April 2018, (2) biopsy-proven, Gleason score ≤7, organ-confined prostate cancer, (3) at least one local posttreatment MRI.
MRgFUS ablation of the prostate was performed as previously described9-11. As part of standardized follow-up protocol, serial PSA tests, symptom checklists and MRIs were obtained at 1, 6, 12, and 24 months post-treatment. At 6 and 24 months, MRI-ultrasound image-fusion-guided transrectal biopsies were obtained of the ablation zone and of any suspicious lesions; systematic biopsies were also performed.
All imaging was performed at 3T with a pelvic phased-array coil (see Table 1 for parameters). All scans were evaluated to define the region of treatment (ROT) on DWI, ADC maps, T2-weighted images, and pre- and post-contrast T1-weighted images and to assess the categorical and quantitative features presented in Table 2.
Comparisons in observation frequency across groups were performed using the chi-squared test. P<0.05 following Holm-Bonferroni correction for multiple comparisons was considered significant12.
Results
Quantitative and categorical results are summarized in Table 3 and Figure 1. There are several imaging features that emerge as part of normal post-treatment evolution. MRI depicts a non-perfused zone around the target immediately post-ablation with surrounding hyperemia, which typically retracts by 6 months. A T2-hypointense rim around the ablation zone at 1 month becomes ill-defined by 6 months. On DWI, there is a rim of high signal immediately after treatment, which also dissipates by 1-6 months. Other features, such as ADC map values within the posttreatment zone, are highly variable and are less likely to be helpful in follow-up assessment (Figure 2).
No nodular changes were identified.
Eleven patients developed a paraurethral cystic space posttreatment measuring 3x7-17x25 mm (Figure 2). There was no significant association between inclusion of the urethra in the treatment zone and development of this fluid collection (p=0.283) or transient urinary symptoms posttreatment (p=0.051). There are no imaging findings that correlate with post-treatment erectile dysfunction.
Discussion
Recurrent prostate cancer after focal therapy has been described as similar in appearance to the primary disease5,13-15. Our results indicate that heterogeneous DWI and ADC map signal that varies over time are normal posttreatment findings, adding to the challenge of detecting residual or recurrent tumor. It has also been suggested that a rapidly enhancing T2-hypointense nodule is suspicious for recurrence13. Concordantly, we saw neither T2-hypointense nor enhancing nodularity in our patients, none of whom had evidence of clinically significant cancer on follow-up biopsy.
No significant association between inclusion of the urethra in the treatment field and post-ablation fluid collections may indicate that some collections represent focal cystic necrosis, not urinomas.
While a posttreatment decrease in ablation zone and glandular volume was expected, this trend only emerged after one-month follow-up, suggesting edema and swelling persist longer than previously postulated6,7.
Conclusion
As more patients undergo focal MG-FUS therapy, understanding the normal posttreatment appearance over time is critical for identifying residual or recurrent disease. This summary may serve as a guide for radiologists interpreting follow-up examinations.Acknowledgements
No acknowledgement found.References
1. Valerio M, Cerantola Y, Eggener SE, et al. (2016) New and established technology in focal ablation of the prostate: a systematic review. Eur Urol. 2017 Jan;71(1):17-34.
2. Barret E, Harvey-Bryan K-A, Sanchez-Salas R, et al. (2014) How to diagnose and treat focal therapy failure and recurrence? Curr Opin Urol 24(3):241–246.
3. Bozzini G, Colin P, Nevoux P, et al. (2013) Focal therapy of prostate cancer: energies and procedures. Urol Oncol 31(2):155–167.
4. Welch HG, Fisher ES, Gottlieb DJ, et al. (2007) Detection of prostate cancer via biopsy in the medicare-SEER population during the PSA era. J Natl Cancer Inst 99(18):1395–1400.
5. Gaur S, Turkbey B. Prostate MR Imaging for Posttreatment Evaluation and Recurrence. Urol Clin North Am. 2018 Aug;45(3):467-479.
6. Hötker AM, Meier A, Mazaheri Y, Zheng J, Capanu M, Chaim J, Sosa R, Coleman J, Hricak H, Akin O. Temporal changes in MRI appearance of the prostate after focal ablation. Abdom Radiol (NY). 2018 Aug 1. [Epub ahead of print]
7. Westin C, Chatterjee A, Ku E, Yousuf A, Wang S, Thomas S, Fan X, Eggener S, Karczmar G, Oto A. MRI Findings After MRI-Guided Focal Laser Ablation of Prostate Cancer. AJR Am J Roentgenol. 2018 Sep;211(3):595-604.
8. A. Napoli, M. Anzidei, C. De Nunzio, G. Cartocci, V. Panebianco, C. De Dominicis, C. Catalano, F. Petrucci, and C. Leonardo, “Real-time Magnetic Resonance–guided High-intensity Focused Ultrasound Focal Therapy for Localised Prostate Cancer: Preliminary Experience,” European Urology, vol. 63, no. 2, pp. 395–398, Dec. 2012.
9. Ghai S, Louis AS, Van Vliet M, Lindner U, Haider MA, Hlasny E, Spensieri P, Van Der Kwast TH, McCluskey SA, Kucharczyk W, Trachtenberg J. Real-Time MRI-Guided Focused Ultrasound for Focal Therapy of Locally Confined Low-Risk Prostate Cancer: Feasibility and Preliminary Outcomes. AJR Am J Roentgenol. 2015 Aug;205(2):W177-84.
10. Yuh, A. Liu, R. Beatty, A. Jung, and J. Y. C. Wong, “Focal therapy using magnetic resonance image-guided focused ultrasound in patients with localized prostate cancer,” Journal of Therapeutic Ultrasound, pp. 1–7, Mar. 2016.
11. Kim CK, Park BK, Lee HM, Kim SS, Kim E. MRI techniques for prediction of local tumor progression after high-intensity focused ultrasonic ablation of prostate cancer. AJR Am J Roentgenol. 2008 May;190(5):1180-6.
12. Holm S. A simple sequentially rejective multiple test procedure. Scand J Stat 1979;6(2):65–70.
13. P. Patel, M. S. Mathew, I. Trilisky, and A. Oto, “Multiparametric MR Imaging of the Prostate after Treatment of Prostate Cancer,” Radiographics, vol. 38, no. 2, pp. 437–449, Mar. 2018.
Figures

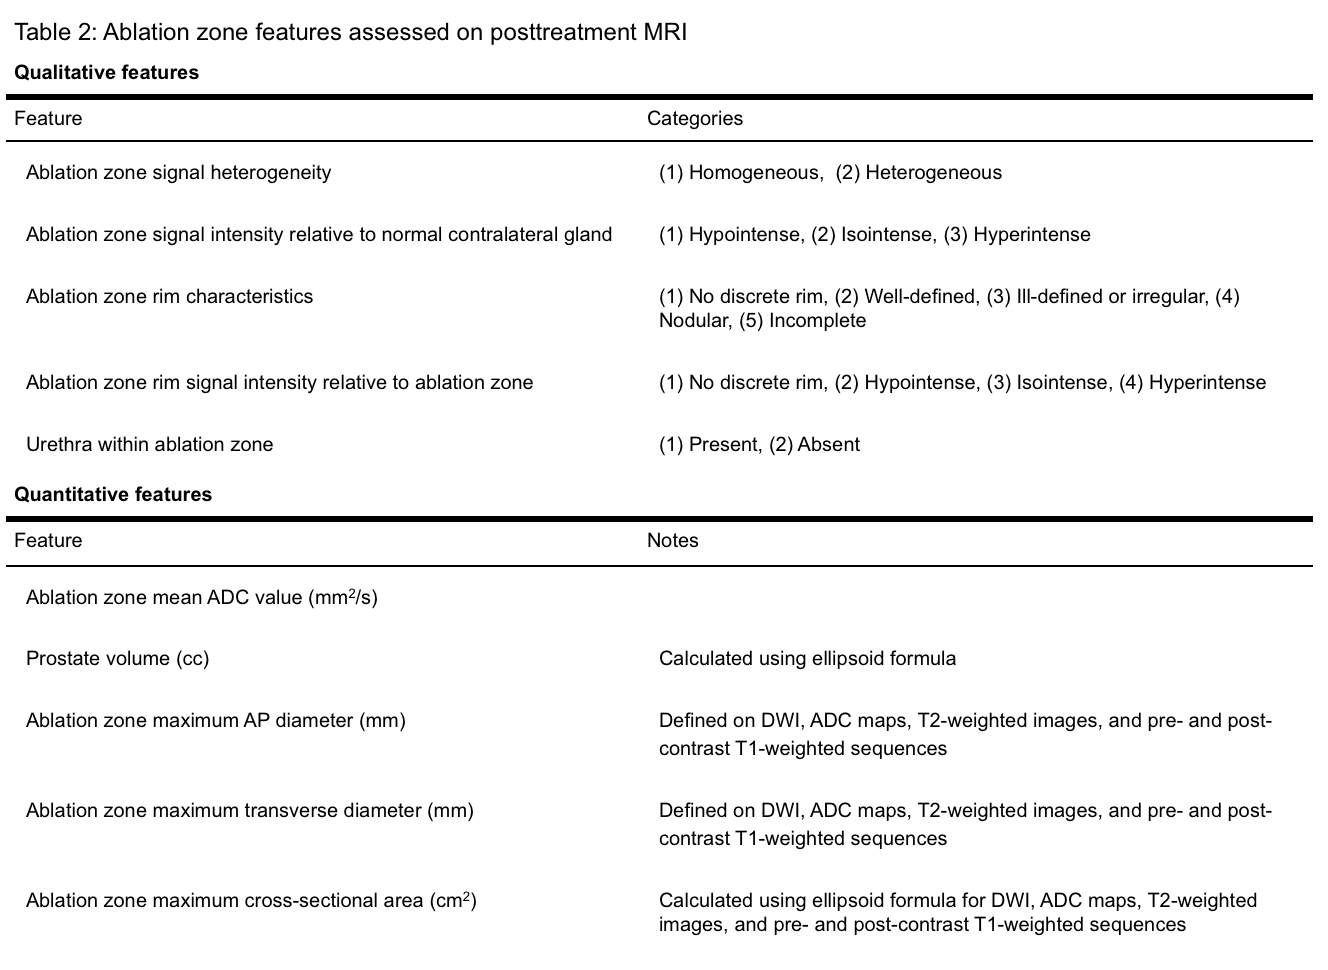


Figure 1:
Row 1: The typical lesion immediately posttreatment is heterogeneously T2-hypointense (20/21), with a hyperintense rim on DWI and low signal on ADC (20/21), hyperintensity on T1-precontrast (19/23), and nonperfused postcontrast (23/23).
Row 2: The typical lesion one month posttreatment is heterogeneously T2-hypointense with a low-signal rim (15/16).
Row 3: The typical lesion six months posttreatment is T2-hypointense (19/23), heterogeneous on DWI and ADC map (20/23), shows patchy hyperintensity on T1-precontrast (16/23), and is hypoenhancing with an irregular rim (16/23).
Row 4: The typical lesion 12 months posttreatment shows capsular retraction, resolution of T1-precontrast abnormalities (5/6), and heterogeneous enhancement postcontrast (6/6).

Figure 2.
Row 1: T1-weighted images at 0, 1, and 6 months show intrinsic T1 hyperintensity dissipating over time.
Row 2: T2-weighted images at 0, 1 and 6 months in a different patient show development of a defined, hypointense rim followed by involution and capsular retraction.
Row 3: DWI (left) and postcontrast (right) images obtained immediately posttreatment in a third patient show a rim of high signal on DWI appearing to correspond to the ablation zone margin.
Row 4: Postcontrast image immediately posttreatment (left) shows the urethra within the treatment zone. On T2-weighted images obtained 6 months posttreatment (right) a small periurethral collection had developed.