3805
Zero TE based screening for transcranial MR guided focused ultrasound1hmCINAC, University Hospital HM Puerta del Sur, Móstoles, Spain, 2GE Healthcare, Madrid, Spain, 3Neuroimaging, hmCINAC, Móstoles, Spain
Synopsis
The high acoustic impedance of the skull limits the performance of tissue ablation applications with tcMRgFUS. Skull characterization is currently based on CT. Zero echo time (ZTE) images could represent a safer alternative in this matter. CT and ZTE images were acquired in sixteen essential tremor patients that underwent tcMRgFUS. Several skull measures were obtained for both images. ZTE and CT based metrics were strongly correlated. Furthermore skull thickness and the skull density ratio were able to predict the efficiency of the treatment. In conclusion, ZTE based measures are able to determine the suitability of a tcMRgFUS candidate.
Introduction
Transcranial
magnetic resonance-guided focused ultrasound (tcMRgFUS) is a novel technique
that allows incisionless brain tissue ablation by focusing acoustic energy to deep
locations in the brain [1]. The high acoustical impedance of the skull [2] limits
the performance of this technique; therefore it is essential to characterize the
skull both for subject suitability screening and to achieve successful
ultrasound beam focusing. Current screening is based in the skull density ratio
(SDR) [3] and total available skull area, which are estimated using patient’s CT
images. Novel MR based contrasts that use zero echo time (ZTE) allow the
differentiation of bone tissues, and may thus show potential for tcMRgFUS
screening [4-5]. This work intends to validate ZTE imaging for measuring skull
properties that affect tcMRgFUS performance.Methods
Image acquisition. CT and ZTE images were acquired in a sample of sixteen patients suffering from medication-refractory essential tremor that underwent tcMRgFUS thalamotomy. The study was performed according to the Declaration of Helsinki and approved by the local Ethics Committee. All patients provided written informed consent before treatment and MRI acquisition. CT images were acquired on a Toshiba Acquilion Prime scanner [Matrix=512x512, Field of view=241x241 mm2, Slice thickness=1 mm, Convolution kernel=FC30]. ZTE images were acquired on a 3T GE scanner (Discovery 750w) [TR/TE/TI=688.612/0/0 ms, Flip angle=1º, Acquisition matrix=256x256, Field of View=256x256 mm2].
Image Preprocessing. ZTE images were corrected for intensity inhomogeneity, co-registered to the CT and inverse-logarithm scaled [5]. Skull bone masks were created by combination of thresholding and morphological operators in both CT and -log(ZTE). The transducer array was positioned targeting at the ventral intermediate nucleus of the thalamus following the coordinates defined in [6].
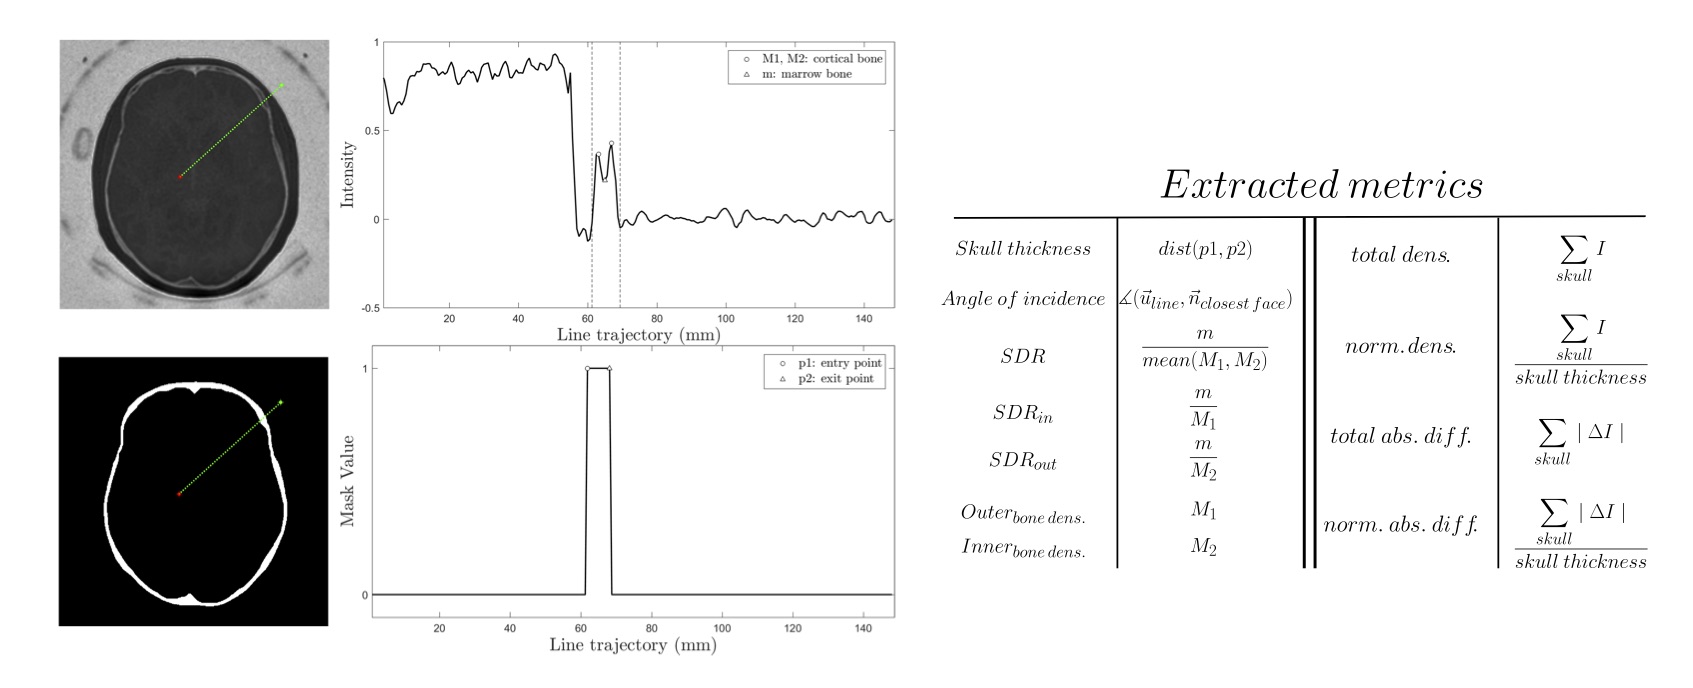
Feature extraction. Skull features were computed for each ultrasound element, drawing a line that goes from the element to the target (see Fig. 1). In addition to the “classical” features (i.e. the skull thickness, the skull density ratio (SDR) [3] and the angle of incidence), several new metrics were defined: SDRin and SDRout, inner and outer bone densities, total and normalized densities, and total and normalized absolute differences. Treatment profiles were constructed relating the maximum thermal rise at the target to the energy applied to the transducers for each sonication, exported from Exablate’s software. These were modeled using linear (𝑇𝑚𝑎𝑥=𝐴⋅𝐸+𝐵) and logarithmic (𝑇𝑚𝑎𝑥=𝐴⋅ln𝐸+𝐵) fitting. The A parameter was taken as an estimate of treatment efficiency.
Results
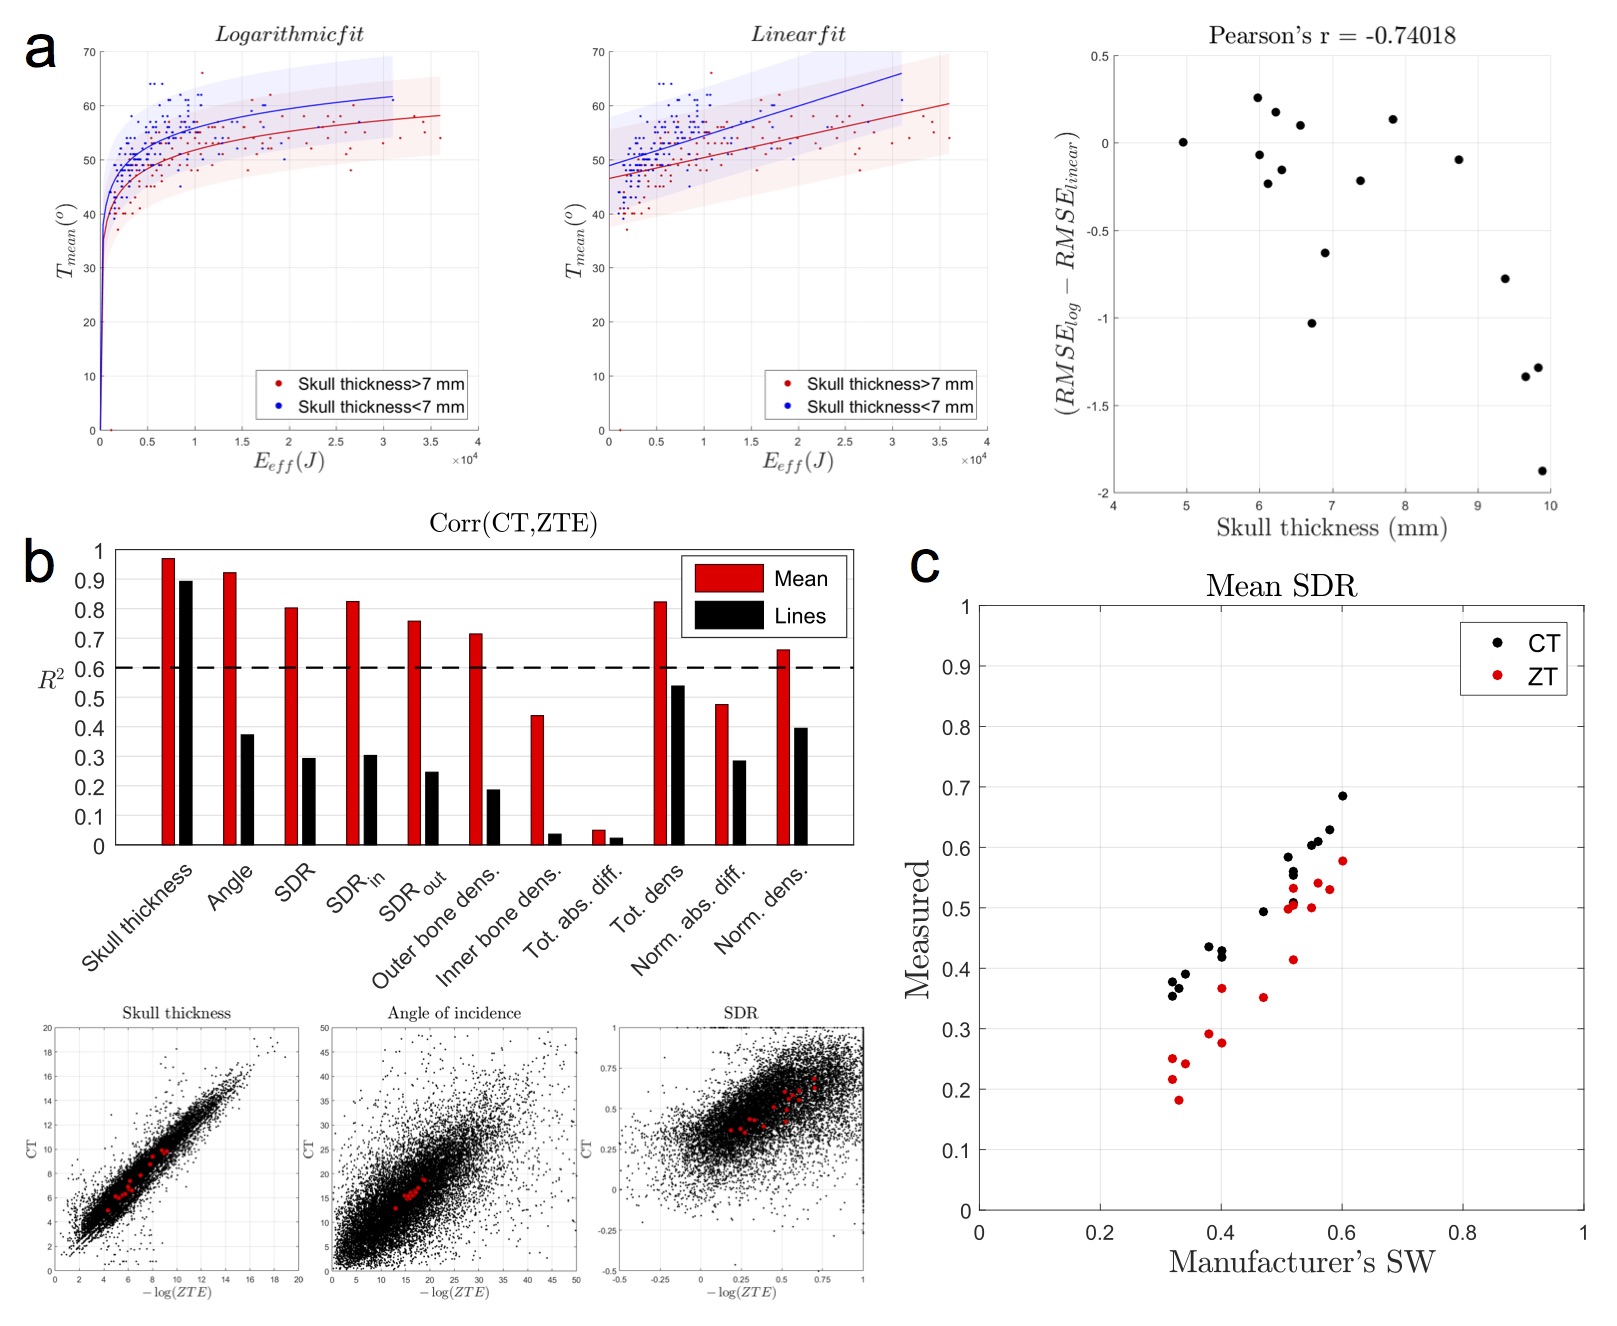
Logarithmic fitting adjusted better than linear fitting the energy-temperature curves (P=0.007). Furthermore, we found a strong negative correlation (r=-0.74, P<0.001) between the skull thickness and a measure of non-linearity of the curve (see Fig. 2A). Further analyses were carried out using only the logarithmic curve.
The estimated features obtained from CT and ZTE images were significantly correlated (R2>0.4; P<0.001), except for the total absolute difference and the metrics employed in the current screening protocol, i.e. skull thickness, angle of incidence and SDR, were strongly replicated using ZTE (see Fig. 2B). The highest similarity was obtained for the skull thickness (R2=0.97, P<0.001). High correlations were found also for the SDR and the angle of incidence (SDR: R2=0.80, P<0.001; angle: R2=0.92, P<0.001). As expected, correlations with line features were lower than with subject averages. Nevertheless classical features were still significantly correlated (Skull thickness: R2=0.89, P<0.001; angle of incidence: R2=0.37, P<0.001; SDR: R2=0.29, P<0.001). Finally, the measured SDRs were correlated to the one computed by Exablate’s workstation, showing robust correlation for both modalities (CT: R2=0.96, P<0.001; ZTE: R2=0.92, P<0.001) (see Fig. 2C).
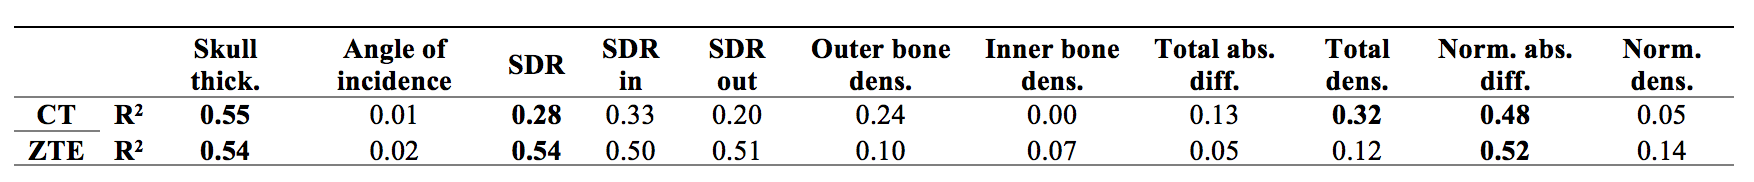
Linear regression analysis was carried out between all metrics (subject average) and the efficiency estimate (see Table 1). Skull thickness (CT: R2=0.55, P<0.001; ZTE: R2=0.54, P<0.001), SDR (CT: R2=0.28, P=0.036; ZTE: R2=0.54, P<0.001), and normalized absolute difference (CT: R2=0.48, P<0.001; ZTE: R2=0.52, P<0.001) showed significant correlation.
Discussion
In here we validated the skull characterization based on ZTE images for the screening and treatment monitoring of tcMRgFUS, proving they can successfully replicate CT-based measures, including the current gold-standard metric, the SDR. Furthermore we observed that these parameters relate with the efficiency of the treatment, affecting the shape (skull thickness) and the slope (skull thickness, SDR and normalized absolute difference) of the energy-temperature curves. The modeling of this curves before a treatment could facilitate a better treatment controllability in terms of achieved temperatures. In conclusion, ZTE based measures solely are able to determine the suitability and treatment performance of a tcMRgFUS candidate.Acknowledgements
No acknowledgement found.References
[1] Jolesz FA, McDannold NJ: Magnetic resonance-guided focused ultrasound. A new technology for clinical neurosciences. Neurol Clin 32:253–269, 2014
[2] Fry FJ, Barger JE: Acoustical properties of the human skull. J Acoust Soc Am 63:1576–1590, 1978
[3] Chang WS, Jung HH, Zadicario E, Rachmilevitch I, Tlusty T, Vitek S, et al: Factors associated with successful magnetic resonance–guided focused ultrasound treatment: efficiency of acoustic energy delivery through the skull. J Neurosurg 124:1–6, 2015
[4] Weiger M, Pruessmann KP: MRI with Zero Echo Time. 1:311–322, 2012
[5] Wiesinger F, Sacolick LI, Menini A, Kaushik SS, Ahn S, Veit-Haibach P, et al: Zero TE MR bone imaging in the head. Magn Reson Med 114:107–114, 2015
[6] Benabid AL, Pollak P, Hoffmann D, Gervason C, Hommel M, Perret JE, et al: Long-term suppression of tremor by chronic stimulation of the ventral intermediate thalamic nucleus. Lancet 337:403–406, 1991
Figures