3804
Altered resting-state functional connectivity in patients with cervical vertigo1Renmin Hospital of Wuhan University, Wuhan, China, 2GE Healthcare China, Beijing, China
Synopsis
As a pioneering work to cervical vertigo in functional connectivity perspective, in some extent, we discovered the potential specific spatiotemporal neuronal functional
mechanisms alteration, and altered functional connections were correlated to clinical scale scores. These findings might support complementary evidence for
its clinical cognition.
Introduction
Previous studies1-3 demonstrated that the cervical vertigo (CV) was mainly due to the dysfunction of the upper cervical spine, specially the sensorimotor disturbances from the cervical spine structures. However, those studies were only confined to investigate the structure and function of sympathetic vertebral plexus, vertebral artery and cervical spine. The studies focused on the potential brain elements alterations of CV which probably resulted from the damaging effects of its symptoms in view of neuroimaging were few. Through rest state-fMRI analysis methods, this article attempted to discover the potential specific spatiotemporal neuronal functional alterations that might be caused by the deleterious impacts of symptoms of CV and support complementary evidence for its clinical cognition.Methods
A ROI-based functional connectivity analysis method was implemented to two groups of subjects, 31 CV patients and 29 normal controls (NC), using the CONN4 toolbox, to explore the long-distance functional connectivity features of CV. Significant between group functional connectivity differences were found with two-sample T-tests. Meanwhile, the mReHo5 values of two groups were calculated through DPABI6 and tested with two sample T-test to investigate the local characters of brain connectomes of CV. Then, correlation analyses between each altered connectivity of CV and the Dizziness Handicap Inventory (DHI)7 score together with, the three sub-scales scores were conducted respectively, so did correlation analyses between each brain regions with altered mReHo values in CV and the four scales scores.Results
In ROI-ROI functional connectivity analyses, we obtained twelve significant between-group different functional connections (see Figure 1). Eleven of them were with bigger group mean functional correlations in CV than NC, and one in contrary (see the fourth column in Table 1). As the method of 2.5 section to determine significant increased or decreased between-group functional connections, we obtained six increased functional connections in CV, three of them with increased positive correlation compared to NC (see Table 1.A and the fifth column, Figure 2(a)). The other three were with the functional correlations positive in CV, while negative in NC, and CV group mean absolute value were more stronger than NC group (see Table 1.B and the fifth column, Figure 2(a)). Besides, we also found six decreased functional connections in CV, three of them with decreased negative correlation compared to NC (see Table 1.C and the fifth column, Figure 2(b)). Two of the rest three functional connections was negative in NC, but positive in CV. In contrary, the last was positive in NC, but negative in CV. The common point of them was that the functional correlation mean absolute value of CV group were weaker than NC group (see Table 1.D and the fifth column, Figure 2(b)).
In mReHo results, mReHo values in left Supplementary Motor Area (lSMA) of CV was significantly increased compared to NC group (voxel p<0.01, cluster p<0.05, GRF corrected). However, in bilateral Superior Frontal Gyrus (medial) (SFGmed), mReHo values were significantly decreased in CV (voxel p<0.01, cluster p<0.05, GRF corrected) (see Fig.3).
In correlation analyses, we found two decreased functional connections were correlated to clinical scale scores in CV. Specially, functional connectivity between left Middle Frontal Gyrus (lMFG) and Vermis_4_5 was positive correlated with ES score (r=0.4624, p<0.0115) (Fig.4(a)). And functional connectivity between lSMA and Vermis_3 was positive correlated with PS score (r=0.4338, p<0.0187) (Fig.4(b)). There were not correlations between the mReHo value of lSMA with any of the clinical scale scores in CV, so were the bilateral SFGmed.
Discussion
we found three highlights , firstly lMFG seemed to be act as a hub in decision executive disabilities and emotion chaos in CV. Secondly function activity between lSMA and Vermis_3 in CV was no longer coordination as NC, but restraint each other and with the progression of the disease the function degradation of postural coordination. Thirdly altered long range functional connections which involved lSMA and lSFGmed and the alteration of mReHo values of the two brain regions might interpret why CV unless able to make correct movement control. Maybe it was worth to take the two positive correlations between altered functional connections and clinical scale scores in our work as feasible neuroimage indicators for the clinical cognition of CV. As a pioneering work to cervical vertigo in functional connectivity perspective, our innovation was the endeavors to discover the potential specific spatiotemporal neuronal functional mechanisms alteration, also the attempt to support complementary evidence for its clinical cognition. And the work realized the conceives.Acknowledgements
We wish to express our gratitude to all participants for their time and effort. This work was supported by Renmin Hospital of Wuhan University. This research did not receive any specific grant from funding agencies in the public, commercial, or not-for-profit sectors.References
1.Yongchao Li, Baogan Peng. Pathogenesis, Diagnosis, and Treatment of Cervical Vertigo. Pain Physician. 2015;18:E583-E595.
2.Noh Y, Kwon OK, Kim HJ, Kim JS. Rotational vertebral artery syndrome due to compression of nondominant vertebral artery terminating inposterior inferior cerebellar artery. J Neurol 2011; 258:1775-1780.
3.Choi KD, Choi JH, Kim JS, Kim HJ.
Rotational vertebral artery occlusion: mechanisms and long-term outcome. Stroke
2013; 44:1817-1824.
4. Susan Whitfield, Alfonso Nieto. Conn: A Functional Connectivity Toolbox for Correlated and Anticorelated Brain Networks.Brain Connectivity. 2012;2(3):125-141.
5. Zang YF, Jiang TZ, Lu YL, et al. Regional homogeneity approach to fMRI data analysis. NeuroImage. 2004;22:394-400.
6. Yan, C.G., Wang, X.D., Zuo, X.N., Zang, Y.F.. DPABI: Data Processing & Analysis for (Resting-State) Brain Imaging. Neuroinformatics. 2016;14, 339-351.
7. Jacobson GP, Newman CW. The development of the dizziness handicap inventory. Arch Otolaryngol Head Neck Surg. 1990;116:424-427.
Figures
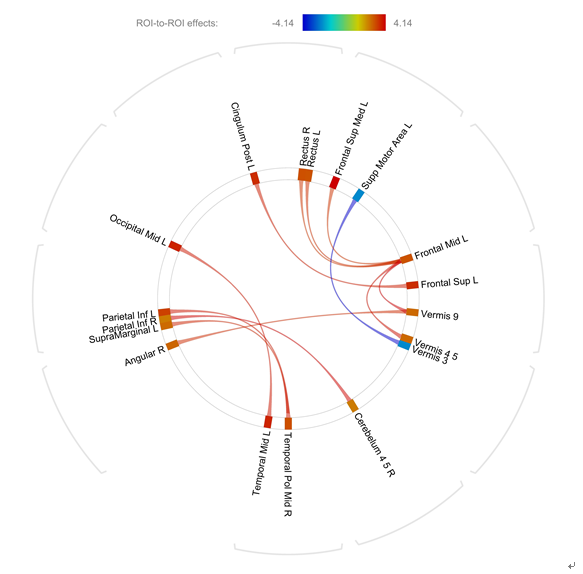
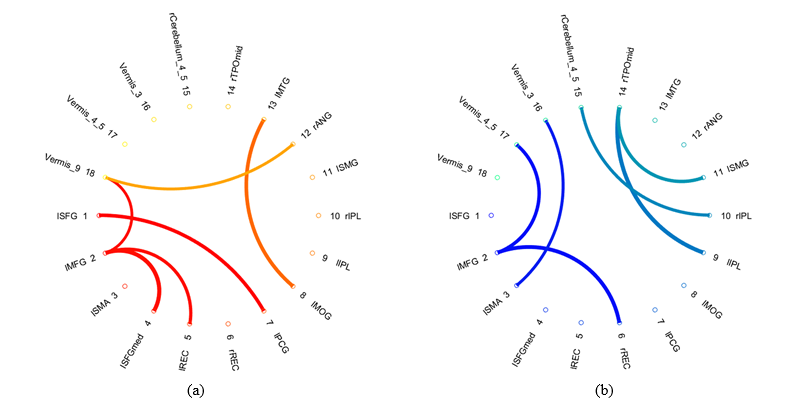
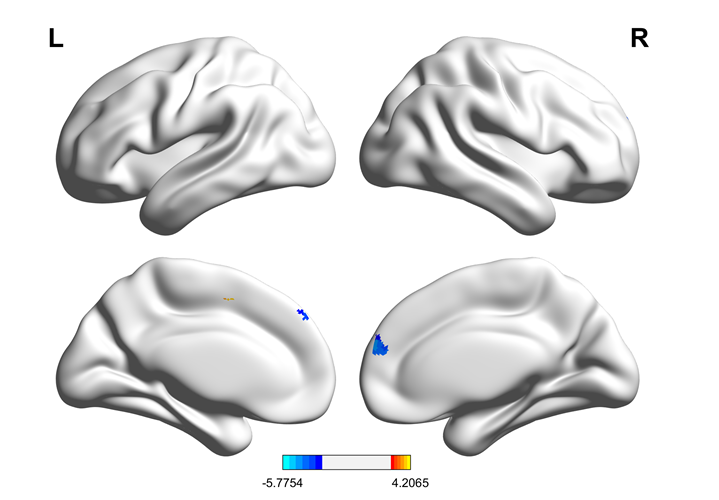
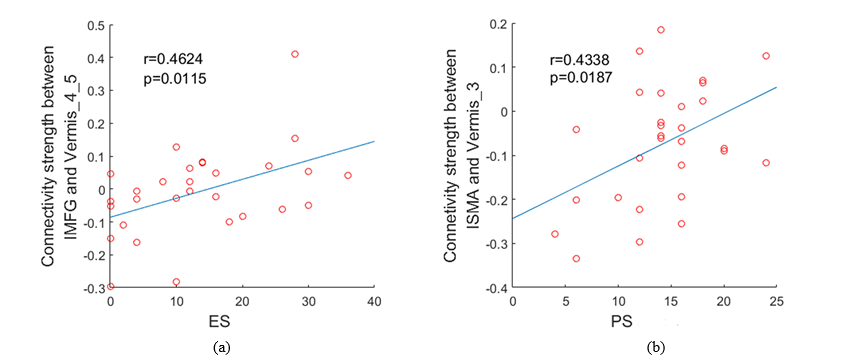
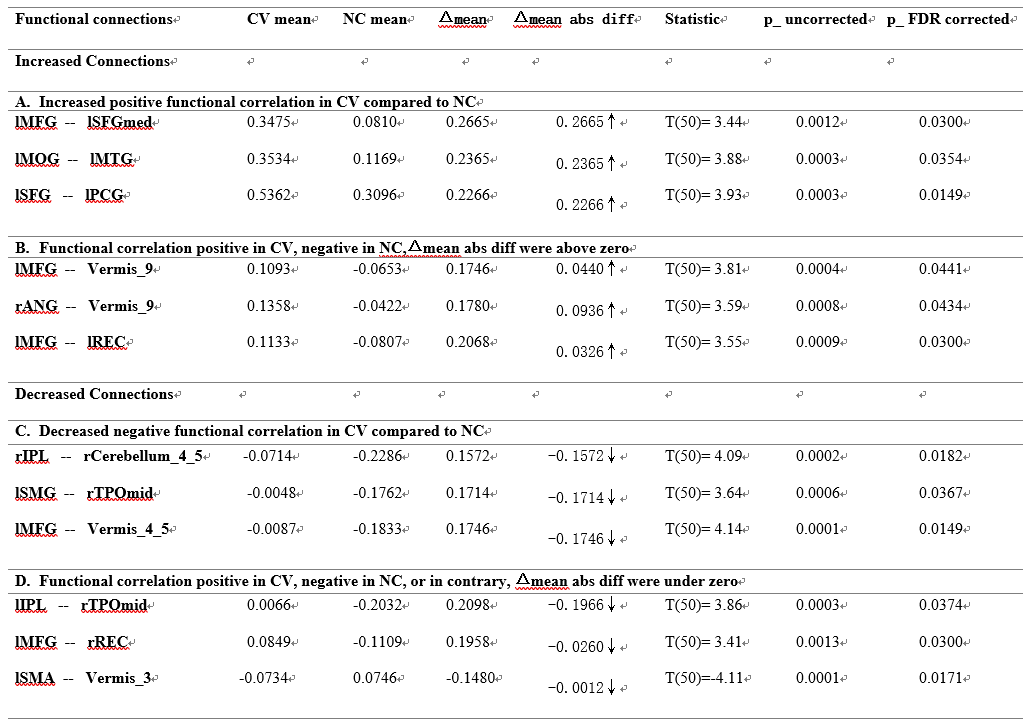
Table 1 ROI-to-ROI connectivity between two groups, two-sidedly
Notes: CV mean: CV group mean functional connectivity correlation; NC mean: NC group mean functional connectivity correlation; Δmean: Mean functional connectivity correlation differences between two groups; Δmean abs diff: Mean functional connectivity correlation absolute value differences between two groups. Abbreviations: Frontal Mid L—left middle frontal gyrus, Parietal Inf L—left inferior parietal lobule, Parietal Inf R—right inferior parietal lobule, SupraMarginal L—left supramarginal gyrus, Angular R—right Angular gyrus, Temporal Pole Mid R—right temporal pole (middle) gyrus, Temporal Mid L—left middle temporal gyrus, Occipital Mid L—left middle occipital gyrus, Cingulum Post L—left posterior cingulate gyrus, Frontal Sup L—left superior frontal gyrus, Supp Motor Area L—left supplementary motor area, Frontal Sup Med L—left superior frontal gyrus (medial), Rectus L—left rectus gyrus, Rectus R—right rectus gyrus.