3786
Subcortical and cortical fMRI assessment of auditory pathway function associated with lifetime noise exposure in normally hearing listeners1Sir Peter Mansfield Imaging Centre, School of Physics and Astronomy, University of Nottingham, Nottingham, United Kingdom, 2NIHR Nottingham Biomedical Research Centre, Nottingham, United Kingdom, 3Hearing Sciences, Division of Clinical Neuroscience, School of Medicine, University of Nottingham, Nottingham, United Kingdom, 4Manchester Centre for Audiology and Deafness (ManCAD), University of Manchester, Manchester, United Kingdom, 5NIHR Manchester Biomedical Research Centre, Manchester, United Kingdom, 6Department of Psychology, Lancaster University, Lancaster, United Kingdom, 7University of Nottingham Malaysia, Jalan Broga, Selangor Darul Ehsan, Malaysia
Synopsis
We investigated the relationship of lifetime noise exposure with subcortical and cortical auditory fMRI BOLD responses to broadband noise in 62 individuals with clinically normal audiometric thresholds. We demonstrate robust individual and group responses to a broadband noise across structures in the auditory pathway. In line with animal models, we show a significantly increased BOLD response to stimulus onset in individuals with high noise exposure compared to those with low noise exposure in all auditory structures assessed. We also show a trend towards individuals with high noise exposure exhibiting a greater sustained BOLD response.
Introduction
Permanent noise-induced damage to hair-cell synapses for high-threshold auditory nerve fibres, apparent as behavioural and electrophysiological changes in auditory processing, has been demonstrated following noise exposure in several mammalian species [1]. It is unclear whether similar patterns of altered responses can be detected in humans. We conducted a study to assess the link between lifetime noise exposure and both subcortical and cortical functional magnetic resonance imaging (fMRI) within the auditory pathway. We aimed to test the hypothesis of greater fMRI BOLD responses in a ‘high’ noise exposure group than in a ‘low’ noise exposure group. As an exploratory aim, we also investigated whether BOLD responses were associated with tinnitus or sound-level tolerance.Methods
62 individuals (age 25-40 years) with normal audiometric hearing (thresholds in each ear ≤20 dB HL over 500–8 kHz) were recruited to the study. Comprehensive assessment of lifetime noise exposure used the Noise Exposure Structured Interview [2]. To examine the effects of lifetime noise exposure, participants were recruited to ‘low’ and ‘high’ exposure groups. The cut-off between groups was pre-specified at 15 lifetime noise exposure units, equivalent to 85 dB(A) across a 50-year working lifetime (8 hours/day, 5 days/week, 48 weeks/year). Groups were actively matched for age using stratified recruitment across five age ranges as in the pre-published protocol [3]. Tinnitus and sound-level tolerance were assessed using the Tinnitus and Hearing Survey [4].
fMRI data were collected on a Philips Ingenia 3.0 T MR scanner (Philips Medical Systems, The Netherlands) with a 32-channel head coil. fMRI data were acquired using a gradient echo echo-planar imaging (GE-EPI) acquisition with 1.5 mm3 voxels; field of view, FOV=168×168 mm; echo time, TE=35 ms; flip angle 90°; sensitivity encoding (SENSE) factor 2.5; and repetition time, TR=2 s. 23 coronal-oblique contiguous slices were acquired with equidistant temporal slice spacing providing coverage of the brainstem and Heschl’s gyrus. The fMRI paradigm comprised 24 seconds of broadband noise followed by a 42-second rest, sounds were presented using the OptoACTIVE Optical MRI Communication System (Optoacoustics Ltd., Israel) system during active noise cancellation, typically reducing scanner acoustic noise to 70 dB-SPL.
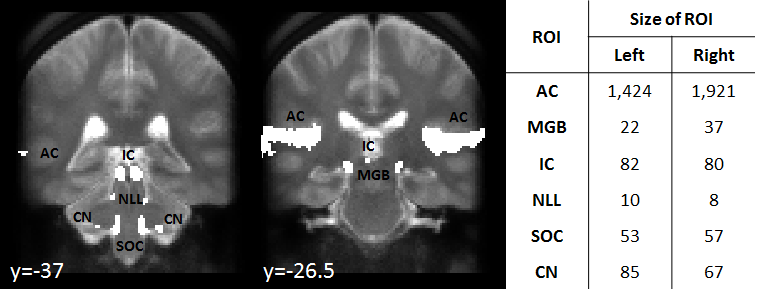
Image analysis was performed using FSL (FMRIB Software Library), SPM12, and software toolboxes coded in Matlab. Pre-processing of fMRI data comprised correction of cardiac and respiratory physiological noise [5], image distortion [6,7] and head motion. Statistical analyses were performed using a general linear model (GLM) of the responses to the transients (onset and offset) of the stimulus and the sustained BOLD response over 24 s, within the GLM the motion parameters, and white matter and cerebrospinal fluid (CSF) noise regressors were included as covariates of no interest. Resulting individual statistical parameter maps (SPMs) were normalised to MNI space [8], and a random-effects group analysis performed. A region-of-interest (ROI) analysis was performed using functionally defined auditory pathway ROIs: cochlear nucleus, superior olivary complex, nucleus of lateral lemniscus, inferior colliculus, medial geniculate body, and auditory cortex (Figure 1). ANCOVAs were performed on the beta-estimates of the onset, offset and sustained fMRI responses with factors group (between-subjects) and ROI (within-subjects), and covariate de-meaned age.
Results
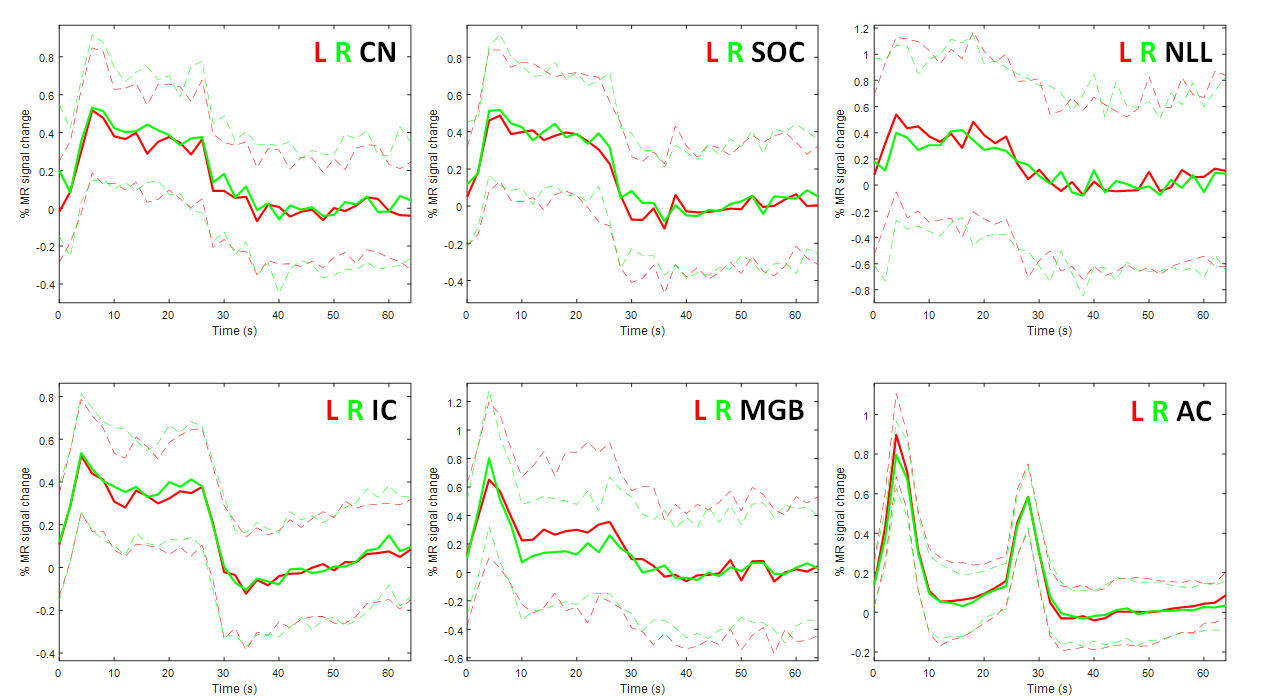
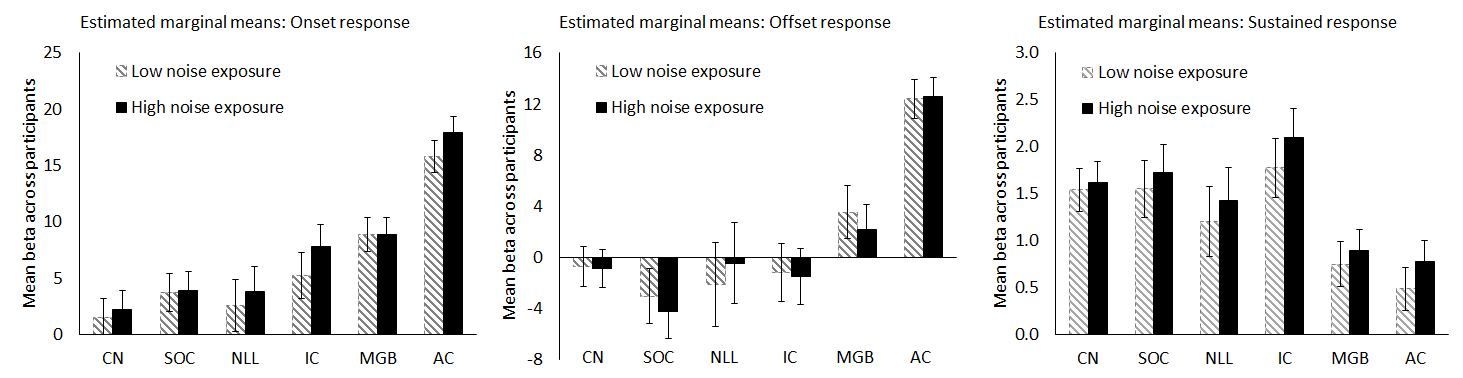
Figure 2 shows the timecourse of BOLD response across each ROI and Figure 3 shows mean ROI beta values. Transient responses were more robust than sustained responses in cortex, whereas sustained responses were more robust in subcortical regions. The amplitude of onset responses differed significantly between noise exposure groups (high>low; F=4.79, d.f.=1,59, p=0.033) and across ROIs (F=116.99, d.f.=3, 177, p<0.001), but with no interaction between group and ROI. The effect of ROI was significant for both the offsets (F=119.62, d.f.=3,177, p<0.001) and the sustained (F=59.44, d.f.=3,177, p<0.001) responses, but group was not significant in either case, despite there being a trend in the same direction. ANCOVAs showed no effect of tinnitus or sound-level tolerance on fMRI responses.Discussion
We present a comprehensive investigation into the fMRI correlates of lifetime noise exposure, tinnitus and sound-level tolerance. We demonstrate significant differences in the onset BOLD response amplitude throughout the auditory pathway. In line with literature on animal models, we show a significantly higher stimulus onset response in individuals with high noise exposure compared to low. We also show a trend towards individuals with high noise exposure exhibiting greater offset and sustained responses.Conclusion
This is the first fMRI demonstration of the physiological effects of lifetime noise exposure in humans with clinically-normal audiometric thresholds. This forms part of an MRC-funded programme to explore behavioural and neuroimaging techniques to understand damage to the human auditory system that results from lifetime noise exposure and hidden hearing loss.Acknowledgements
This work is supported by Medical Research Council (MRC) reference MR/L003589/1 awarded to the University of Manchester.References
1. Liberman MC, Epstein MJ, Cleveland SS, Wang H, Maison SF. “Toward a Differential Diagnosis of Hidden Hearing Loss in Humans”. PLoS ONE. 2016;11(9): e0162726.
2. The Noise Exposure Structured Interview (NESI): An Instrument for the Comprehensive Estimation of Lifetime Noise Exposure. Guest H, Dewey RS, Plack CJ, Couth S, Prendergast G, Bakay W, Hall DA. Trends in Hearing 2018.
3. The Physiological Bases of Hidden Noise-Induced Hearing Loss: Protocol for a Functional Neuroimaging Study. Dewey RS, Hall DA, Guest H, Prendergast G, Plack CJ, Francis ST. JMIR Res Protoc. 2018 Mar 9;7(3):e79. doi: 10.2196/resprot.9095.
4. Henry J (2015) Tinnitus and Hearing Survey: A Screening Tool to Differentiate Bothersome Tinnitus From Hearing Difficulties. American Journal of Audiology 24:66-77.
5. Glover GH, Li TQ, Ress D. Image-based method for retrospective correction of physiological motion effects in fMRI: RETROICOR. Mag Reson Med. 2000; 44:162–167.
6. Andersson JL., Skare S, and Ashburner J, How to correct susceptibility distortions in spin-echo echo-planar images: application to diffusion tensor imaging. Neuroimage. 2003;20(2):870-88.
7. Smith SM., et al., Advances in functional and structural MR image analysis and implementation as FSL. NeuroImage. 2004;23:S208-S219.
Figures