3778
The lag structure by BOLD-based blood flow tracking indicates the partial non-neuronal source of resting state functional connectivity in mouse1NeuroSpin/CEA-Saclay, Gif-sur-Yvette, France, 2Department of Psychiatry, Kyoto University Graduate School of Medicine, Kyoto, Japan
Synopsis
A BOLD-based tracking technique was applied to 11 mice to investigate the cerebral circulation. Mapping of the phase of low-frequency component, which is called as “BOLD-based lag structure” showed the typical vascular structure as previous study. Interestingly, BOLD-based lag structure in bilateral somatosensory cortex was similar with the resting state functional connectivity between the bilateral somatosensory cortex. These results indicate the feasibility of this technique in mouse model. Furthermore, our results implies the partial contamination of circulating blood flow in resting state functional connectivity in mouse model.
Introduction
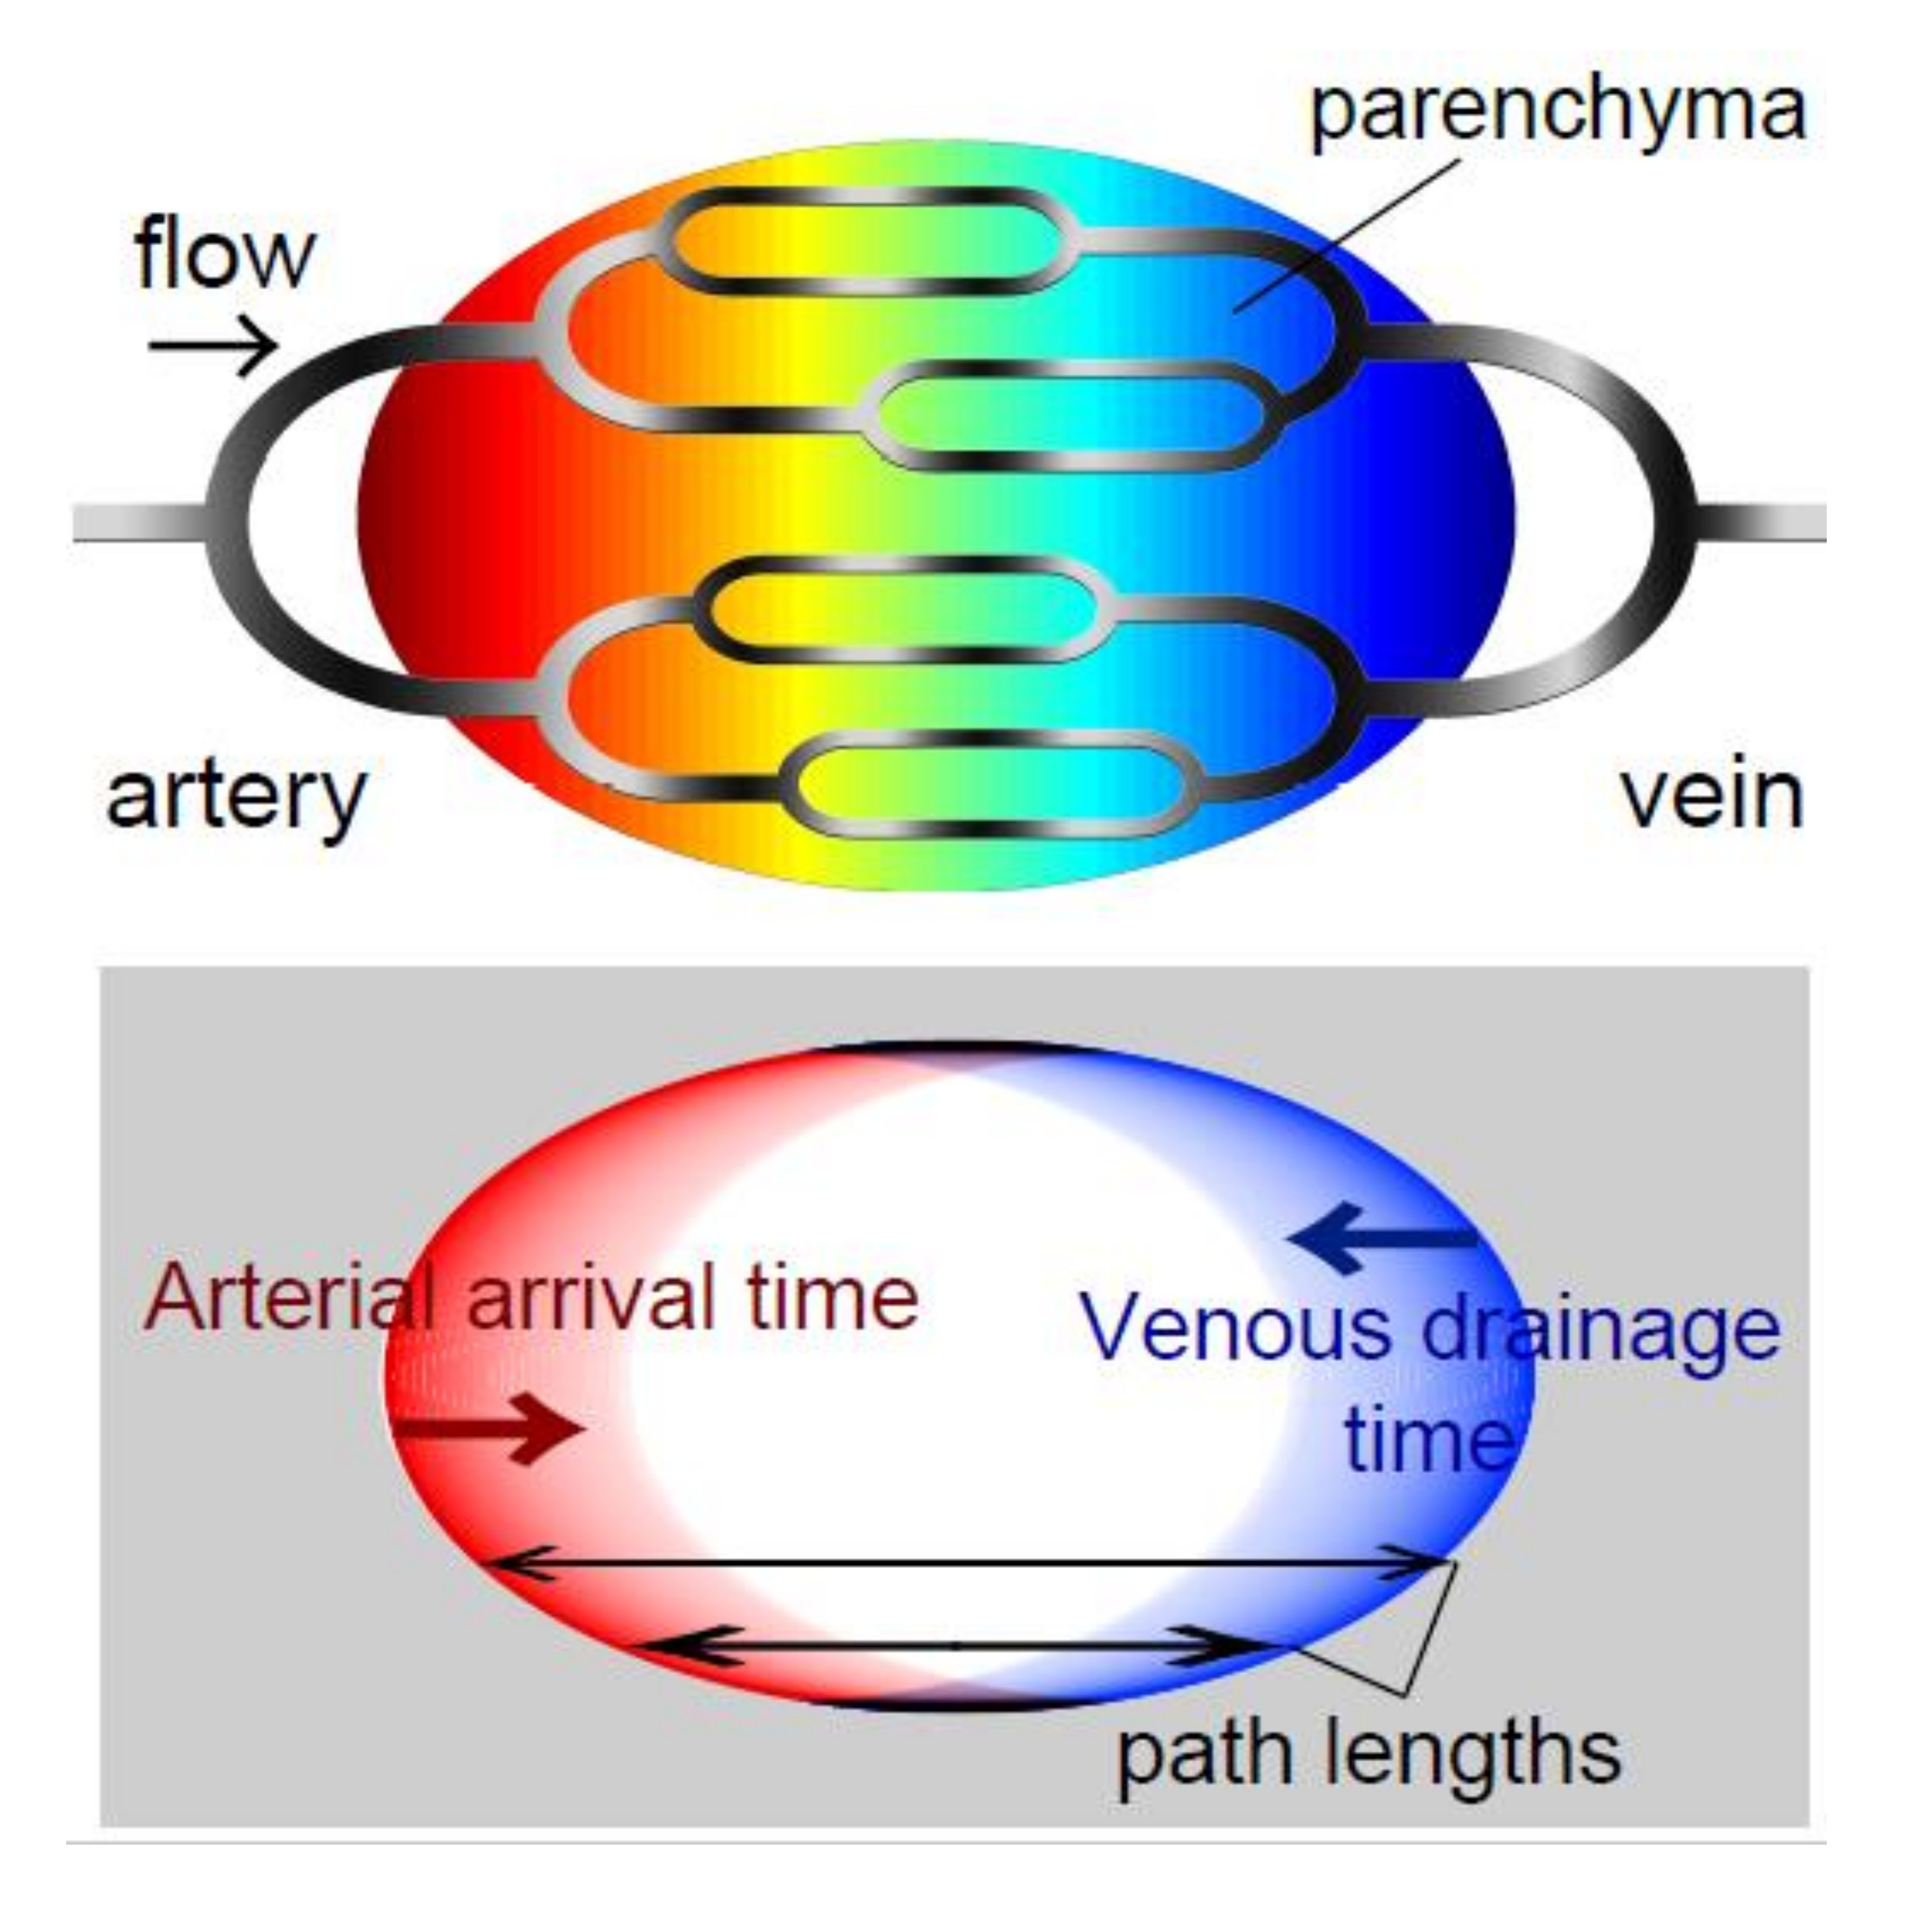
Recently, blood oxygenation level dependent (BOLD)-based blood flow tracking is becoming a promising technique for evaluating blood circulation in the brain 1,2 (Fig. 1). A reproducible spatial time-lag pattern of BOLD signals, which is called “lag structure” has the potential to provide a novel, noninvasive perfusion-related biomarker of the brain. The resting state functional connectivity (rsFC) in mouse model has been investigated at high field MRI and it has been as a biomarker of the disease 3,4. However, there has not been the study that investigated the lag structure in mouse models. The purpose of this study is (i) to assess the feasibility of BOLD-based tracking technique and (ii) to compare lag structure with rsFC in mouse model.Methods
Animals
FMRI experiment was performed on male C57BL6J mice (n = 11 for fMRI). Mice were anesthetized with isoflurane (0.5% in air including 35% of O2) and medetomidine (0.05 mg/kg/h, s.c.) throughout the scanning.
Rs-fMRI
All MRI experiments were conducted on a Bruker 11.7T scanner with a cryo-cooled mouse brain coil. FMRI images were acquired using a gradient-echo EPI sequence, TR/TE = 2,000 / 14 ms, spatial resolution = 100 x 100 x 500 µm3, 15 slices, for 10 min. The body temperature was maintained at 37 °C. The respiration rate was monitored and it was confirmed within the range of 100-150 /min. Anatomical images were acquired for spatial correction using multi-slice rapid acquisition with relaxation enhancement (RARE) with identical FOV and resolution as for fMRI.
Data processing
The images were processed with the slice timing correction, motion correction and normalization using SPM8. Following a previously reported methodology 5,6, simple seed-based lag mapping with the global mean signal reference was used. The lag structure of each animal brain was created by calculating the time shift relative to the reference signal, which yielded the maximum correlation coefficients (i.e., cross-correlation peak) for each voxel. The lag structure assumed discrete values between −4 s and +4 s at an interval of 0.1 s, in which positive values were assigned to the upstream (i.e., arterial side of the circulation) voxels and negative values were assigned to the downstream voxels (i.e., venous side of the circulation). For rsFC study, the region of interest (ROI) of left somatosensory cortex was used as seed region. the images were detrended and band-pass filtered (0.01-0.1 Hz). The correlation coefficient to the averaged time-course within the ROI was computed in each pixel in each animal. Then, Voxel-wise group analysis was performed to assess the statistical significance at the threshold of 0.001 (uncorrected).
Results and discussion
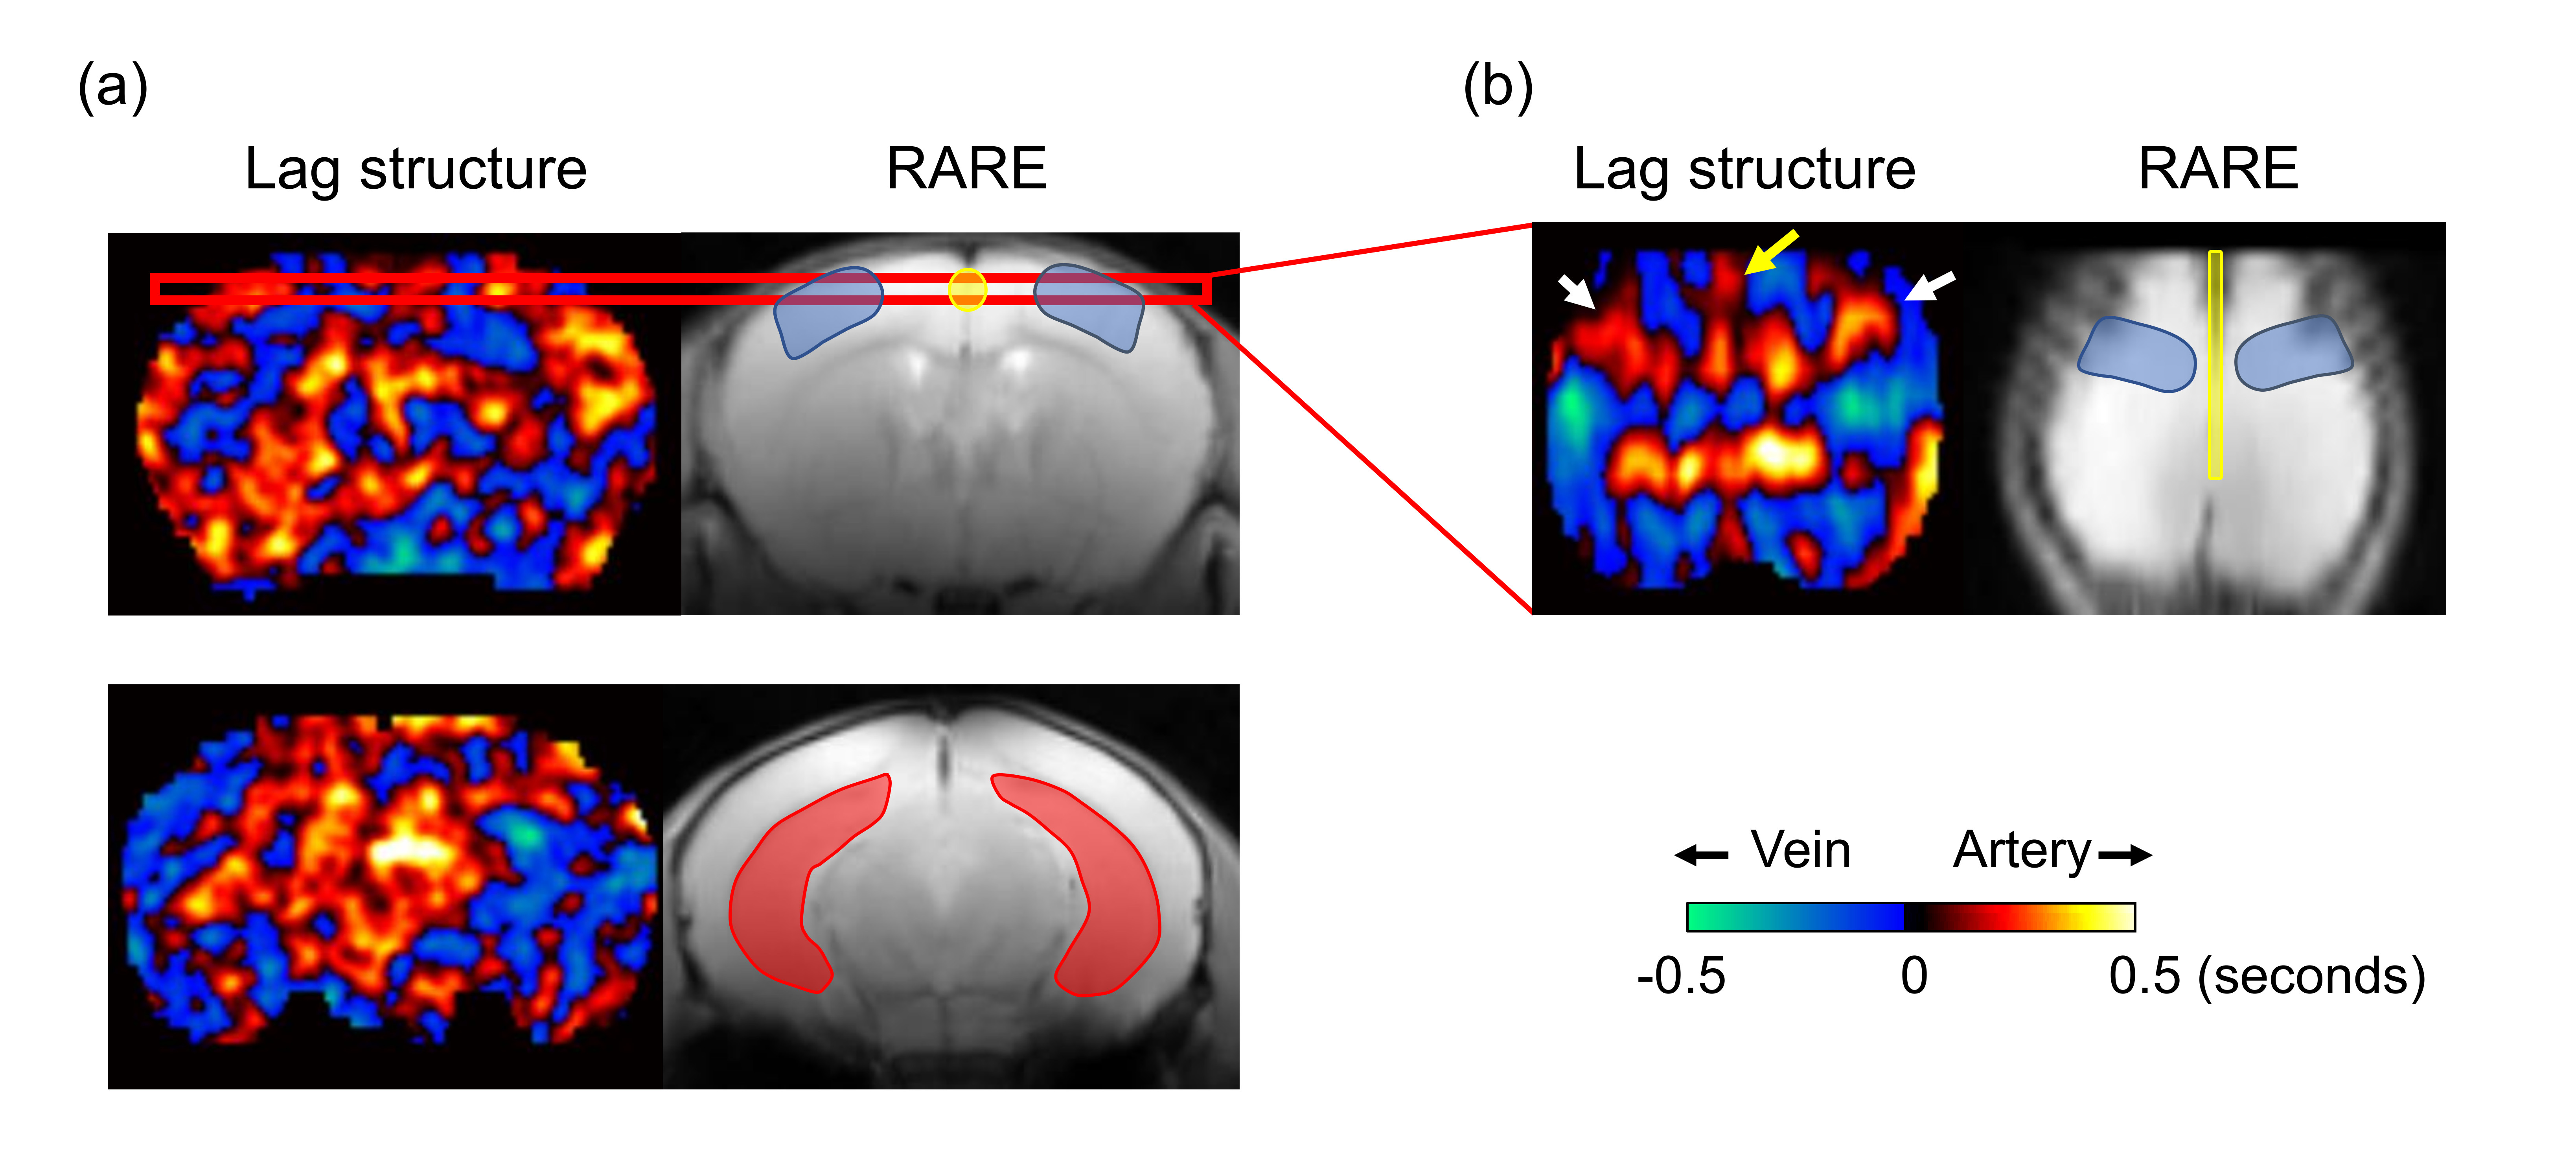
Figure 2 showed the averaged the lag structure
in 11 mice. The upstream and downstream shift was observed in the range of
0.5s. The upstream shift was observed in bilateral somatosensory cortex (white
arrows in Fig. 2). Additionally, the upstream shift was also observed in the
center of the cingulate cortex, where azygos pericallosal artery exists 7,8
(yellow arrow in Fig. 2). In contrast, the ventral hippocampus, where longitudinal
hippocampal vein exists 9, shows the intermittent
downstream shift. These results indicate that the BOLD-based lag structure
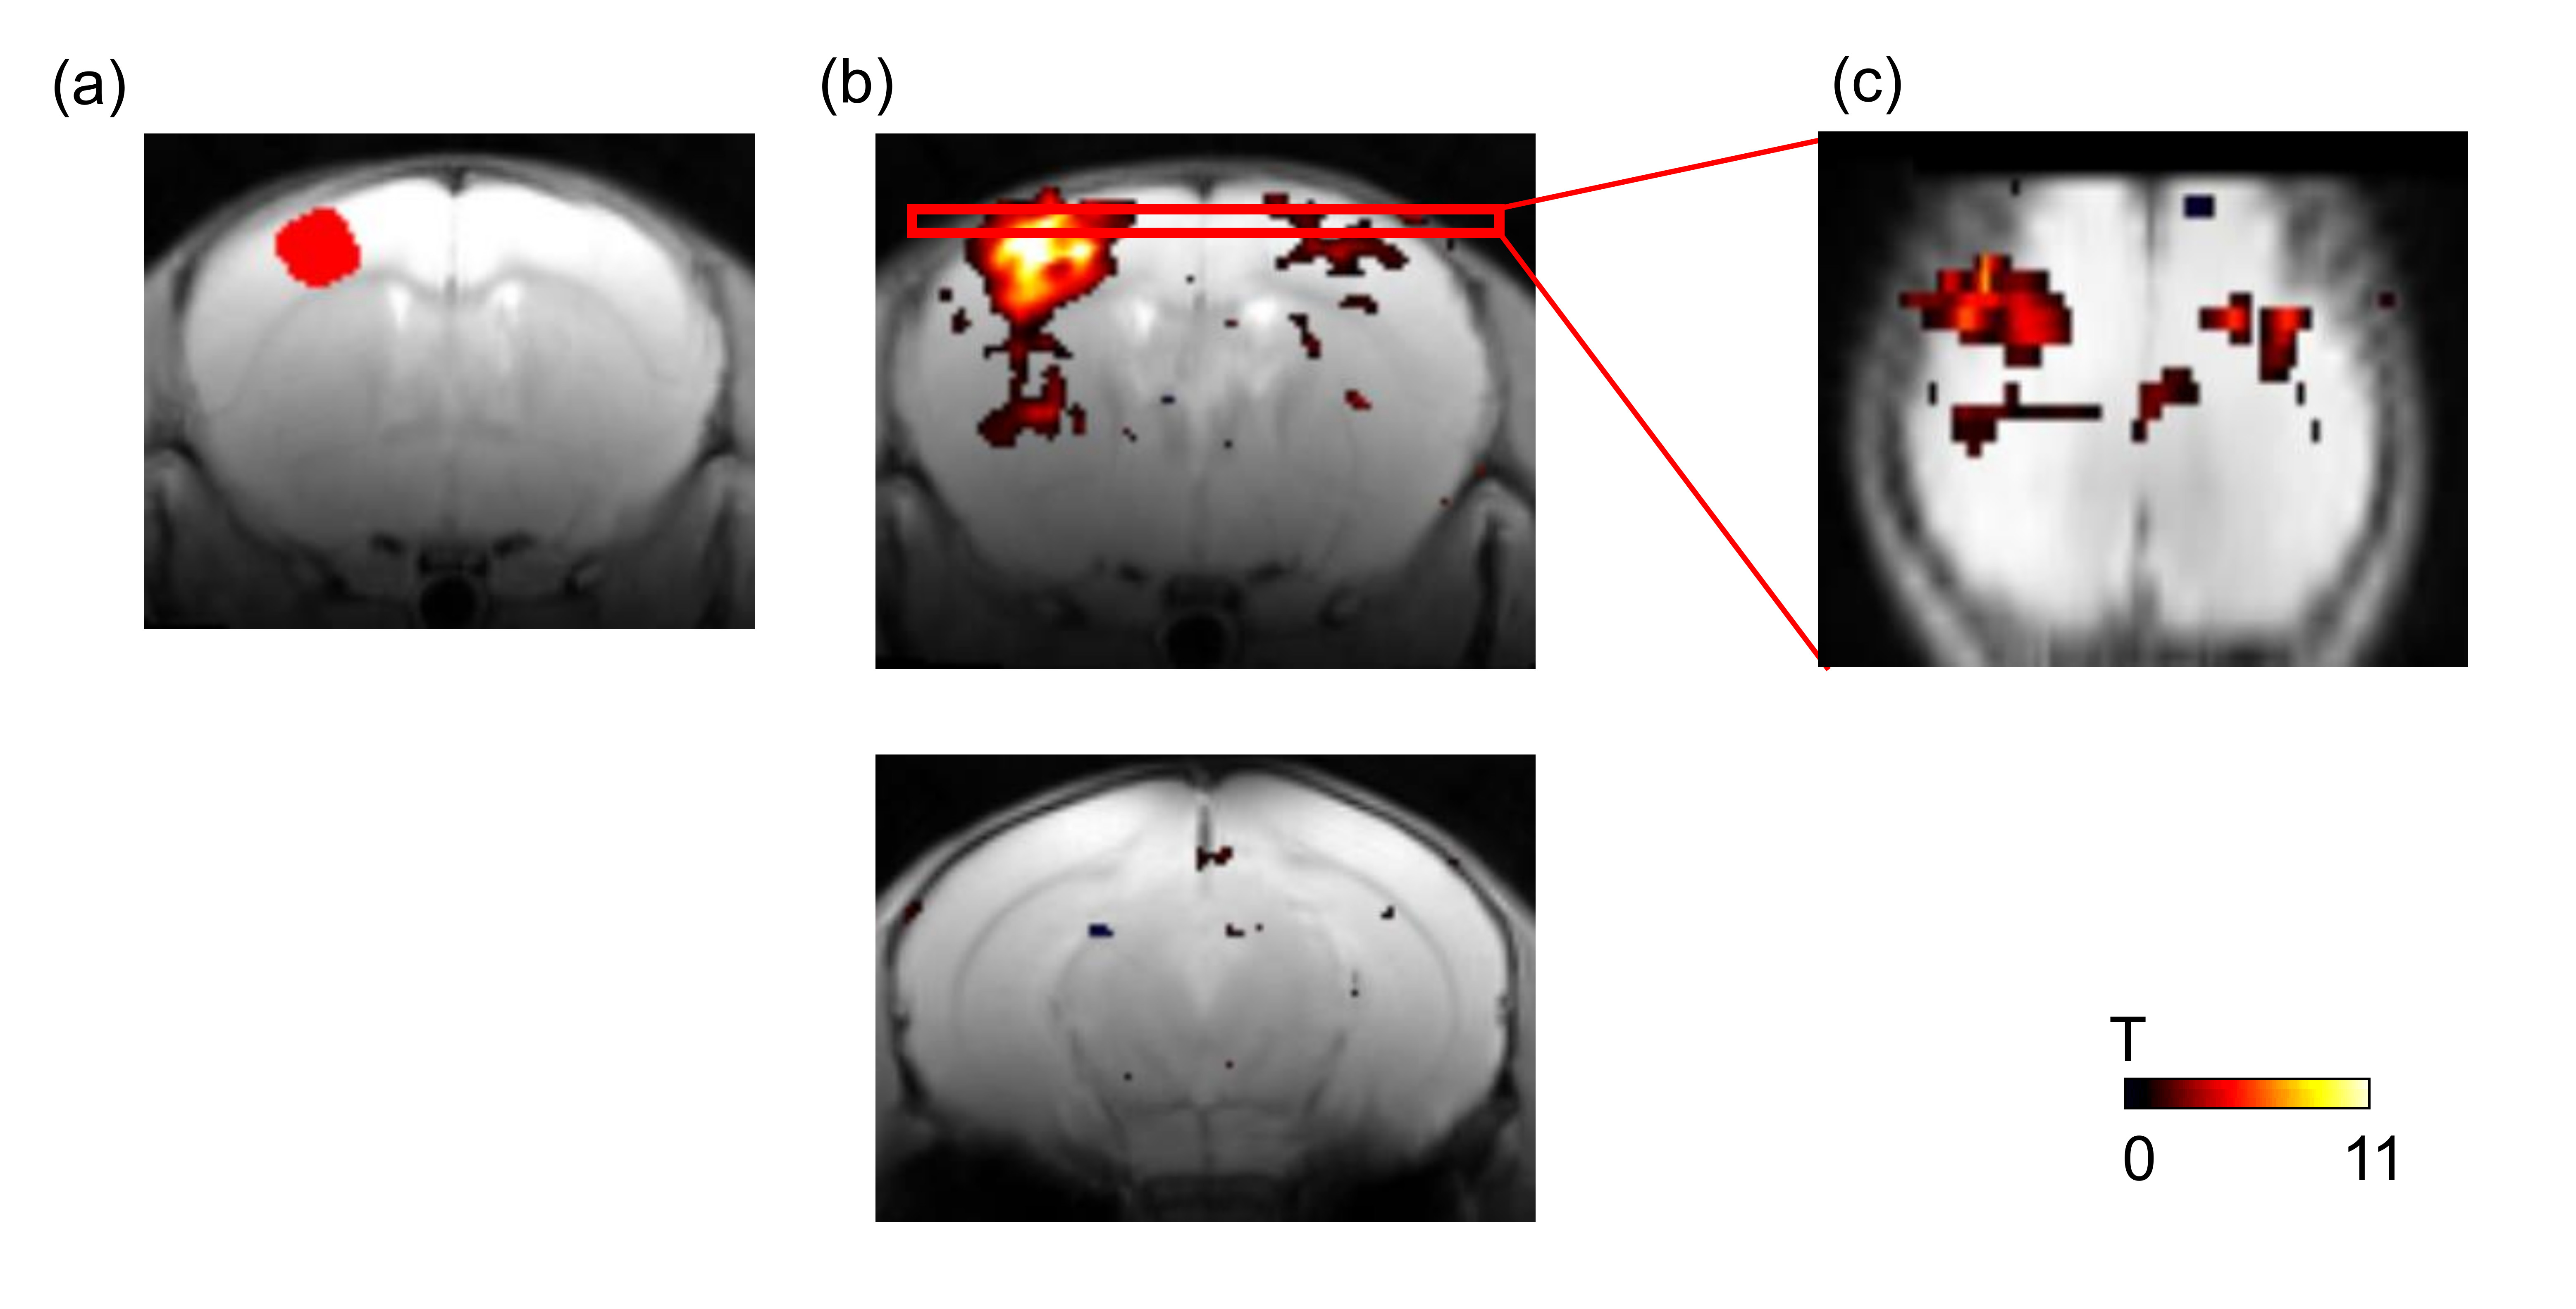
corresponds to the vascular structure. Interestingly, rsFC with left
somatosensory cortex shows the significant correlation between bilateral
somatosensory cortex, where positive shift was observed bilaterally (Fig. 3). However,
significant correlation with left somatosensory cortex was not observed in
other regions those had the upstream shift as shown in Fig. 2. These results
indicate that blood circulation partially influence the rsFC in mouse model.Conclusion
We successfully applied BOLD-based blood flow tracking technique in mouse brain. Our results indicate the feasibility of lag structure to remove the potential contamination of the non-neuronal source caused by the blood circulation from the rsFC as used in human rsfMRI 10.Acknowledgements
No acknowledgement found.References
1 Mitra A, Snyder AZ, Hacker CD, et al. Lag structure in resting-state fMRI. Journal of neurophysiology. 2014;111(11):2374-2391.
2 Tong Y & Frederick B. Tracking cerebral blood flow in BOLD fMRI using recursively generated regressors. Human brain mapping. 2014;35(11):5471-5485.
3 Zerbi V, Wiesmann M, Emmerzaal TL, et al. Resting-state functional connectivity changes in aging apoE4 and apoE-KO mice. The Journal of neuroscience : the official journal of the Society for Neuroscience. 2014;34(42):13963-13975.
4 Grandjean J, Preti MG, Bolton TAW, et al. Dynamic reorganization of intrinsic functional networks in the mouse brain. NeuroImage. 2017;152:497-508.
5 Christen T, Jahanian H, Ni WW, et al. Noncontrast mapping of arterial delay and functional connectivity using resting-state functional MRI: a study in Moyamoya patients. Journal of magnetic resonance imaging : JMRI. 2015;41(2):424-430.
6 Amemiya S, Kunimatsu A, Saito N, et al. Cerebral hemodynamic impairment: assessment with resting-state functional MR imaging. Radiology. 2014;270(2):548-555.
7 Ghanavati S, Lerch JP & Sled JG. Automatic anatomical labeling of the complete cerebral vasculature in mouse models. NeuroImage. 2014;95:117-128.
8 Dorr A, Sled JG & Kabani N. Three-dimensional cerebral vasculature of the CBA mouse brain: a magnetic resonance imaging and micro computed tomography study. NeuroImage. 2007;35(4):1409-1423.
9 Xiong B, Li A, Lou Y, et al. Precise Cerebral Vascular Atlas in Stereotaxic Coordinates of Whole Mouse Brain. Frontiers in neuroanatomy. 2017;11(128).
10 Aso T, Jiang G, Urayama SI, et al. A Resilient, Non-neuronal Source of
the Spatiotemporal Lag Structure Detected by BOLD Signal-Based Blood Flow
Tracking. Frontiers in neuroscience. 2017;11(256).
Figures