3777
Electrical conductivity as a potential mean to decouple the hemodynamic response from fMRIRita Schmidt1
1Neurobiology, Weizmann Institute of Science, Rehovot, Israel
Synopsis
MR electrical properties imaging offers new means for probing physiological information in-vivo. The interest for fMRI lies in the dependence of electrical conductivity on structural macroscopic changes and on ionic concentration changes. In-vivo electrical conductivity acquisition has the potential to provide the means to decouple the hemodynamic response from fMRI. Changes in electrical conductivity can be measured using phase changes in a spin-echo experiment. We compared BOLD fMRI with phase changes in SE-EPI using basic visual task paradigm at 3T MRI, which showed faster time response and more localized spatial activation. Further study is required to analyze possible contributing factors.
Introduction
MR Electrical Properties Tomography (EPT) offers new means for probing physiological information by measuring the tissues’ electrical properties1,2. Although it was first introduced in 19911, it has recently gained renewed interest. This method relies on measuring the RF field distribution in MRI, from which the electrical properties of biological tissue can be estimated. In-vivo electrical properties offer important biochemical and physiological information, such as ionic concentration changes from the measured conductivity, and metabolic concentration from the measured permittivity3-6. It was also shown that the electrical conductivity can measure structural changes, similarly to diffusion contrast7. Mapping electrical conductivity can serve as a new tool for structural and functional brain studies. The interest for functional MRI research lies in the dependence of electrical conductivity on structural macroscopic changes and on ionic concentration changes3 (the source of which can be changes in the blood volume fraction, but also due to local electric synaptic activity). Achieving in-vivo fast electrical conductivity acquisition has the potential to provide the means to decouple the hemodynamic response from the MR imaging, which is the current drawback of BOLD fMRI. Changes in electrical conductivity can be measured using phase changes in a spin-echo experiment2. We compared BOLD fMRI results with phase changes in SE-EPI using a basic visual task paradigm at 3T MRI- examining the time response and the spatial activation.Methods
. It can be shown by the Maxwell equations that a local change in electrical conductivity (Δσ) will result in a local phase change of the RF magnetic field (Δϕ). To assess this, we performed 3D electromagnetic (EM) simulations of the B1+ field (using CST Microwave Studio, Darmstadt, Germany). Figure 1 shows the simulated effect of a 10% change in conductivity in the visual cortex region. In a spin-echo experiment the changes in phase related to T2*, B0, and susceptibility are canceled, thus mainly measuring the RF phase component8 (ϕtransceive≈ϕtransmit+ϕreceive≈2ϕtransmit , ϕtransceive is the measured phase that include transmit, ϕtransmit, and receive, ϕreceive, components). These phase changes (in a spin echo sequence) were demonstrated here experimentally in water tube phantoms by varying their conductivity (controlled by NaCl concentrations). FMRI experiments in five human volunteers were performed with a visual stimulus of a flickering (8Hz) checkerboard: 4 OFF and 3 ON sets of 30 and 60 seconds, respectively (5min total scan duration). The experiment included GRE-EPI for BOLD analysis and SE-EPI for magnitude and phase. Note that subtracting the phases of consecutive scans eliminates undesired eddy-current effects. Thus eliminating the need to scans twice with opposite gradients signs, as in other methods8. We used an in-plane phase fit to remove unrelated global phase changes. Possible sources of these global phase changes in SE-EPI are breathing and motion which can affect the RF coil coupling. Although expected to be very small, such effects can have significant impact on the local phase change we are looking for.Results
Figure 1 shows EM simulations of the human brain, demonstrating the effect of Δσ on Δϕ in the visual area, with approximate sensitivity of 0.1[rad·m/S]. Figure 2 shows a phantom experiment, demonstrating a linear relationship between the change in the electrical conductivity and the phase change measured in a spin-echo experiment. Figure 3 shows a significant increase in the correlation coefficient (r) between the phase change and the functional stimulus after removing a global Δϕ from the images. Figure 4 shows t-score maps calculated from BOLD scans (magnitude), and from SE-EPI scans (magnitude and phase). As can be seen, the phase changes show positive and negative t-score values in the visual area, which demonstrate more complex spatial correlation than seen in the magnitude images. However, comprehensive analysis of the above requires imaging with higher resolution. The absolute t-score (|t-score|) overlay is displayed in Fig.4 to visualize the spatial region that correlates with the functional activation. Finally, the time response in BOLD and phase changes in SE-EPI was compared. Figure 5 shows that faster response of the phase changes in SE-EPI compared to the BOLD experiment.Conclusions
In this study, we demonstrated a correlation between a functional brain task and the phase change in a spin-echo experiment. It can be seen that the activated region in the SE-EPI phase method is more localized than in the BOLD method and that the time response is faster. However, further research is required to better understand the sources of the measured phase changes in a spin-echo experiment.Acknowledgements
No acknowledgement found.References
[1] Haacke, E. M., et.al. (1991) Physics in Med and Biol, 36(6), 723–734 [2] Katscher, U., Comput and Math Methods Med, 2013, 1–11, [3] Hancu I., et.al. (2015) Magn. Reson. Med. 73(5): 2025-2029,[4] Hancu I., et.al. (2018)doi.org/10.1002/mrm.27453, [5] Konn D. et. al (2003) Magn. Reson. Med. 50:40–49, [6] Cassara A. M. et. al. (2008) NeuroImage 39 :87–106,[7] Tuch D.S. et.al. (2001) Proc. Natl. Acad. Sci. USA 98(20): 11697–11701, [8] van Lier A. L.H.M.W. et.al. (2012) Magn. Reson. Med. 67:552–561Figures
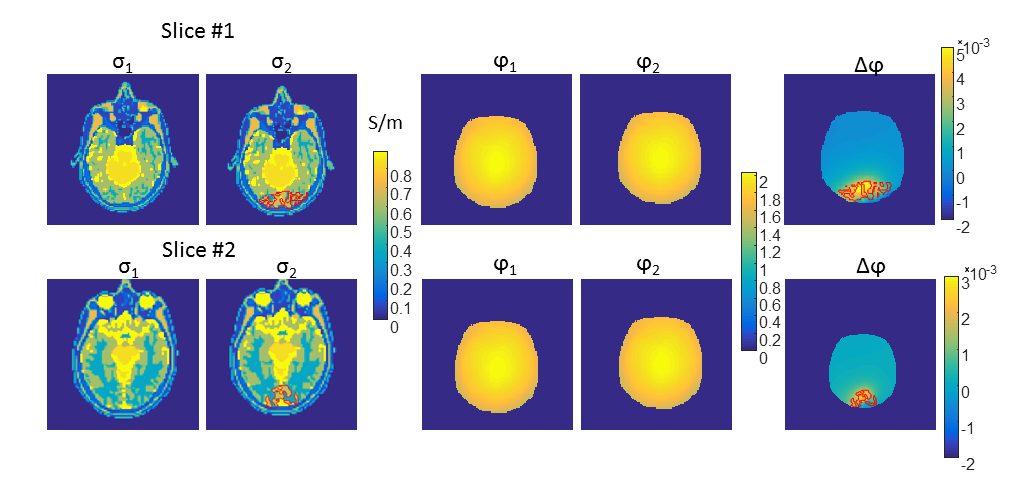
Figure 1: EM simulation of a local change in the
electrical conductivity. Local change of
10% was added to the electrical conductivity of the grey matter in the visual
area (shown by red overlay). The images for two adjacent slices in the brain
include - from left to right - electrical conductivity before (σ1)
and after (σ2) the local change, the RF phase maps before (ϕ1) and after (ϕ2)
the local change and the deviation in the phase (Δϕ).
The EM simulations included a quadrature birdcage
coil and human model “Duke” from the Virtual family15. “Duke” mesh resolution is 2.5x2.5x2.5 mm3.
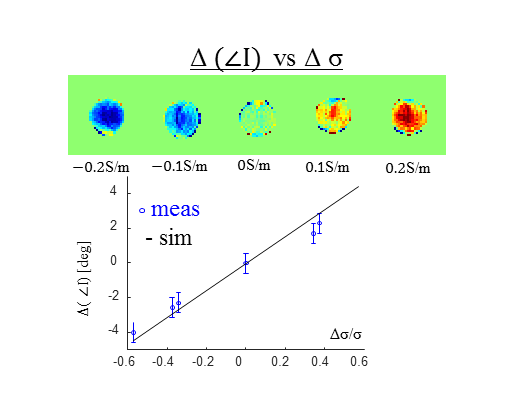
Figure 2: Phantom experiment with varying electrical
conductivity. Top – images of the phase change
-Δarg(I) (I-the
measured signal) versus electrical conductivity
change. Bottom – plot of the average phase change versus average conductivity
change. The experiment was performed using TSE scan with the following scan
parameters:TR/TE 2000/12 ms, FOV 200x200 mm2, thickness 5 mm,
spatial resolution 128x128.
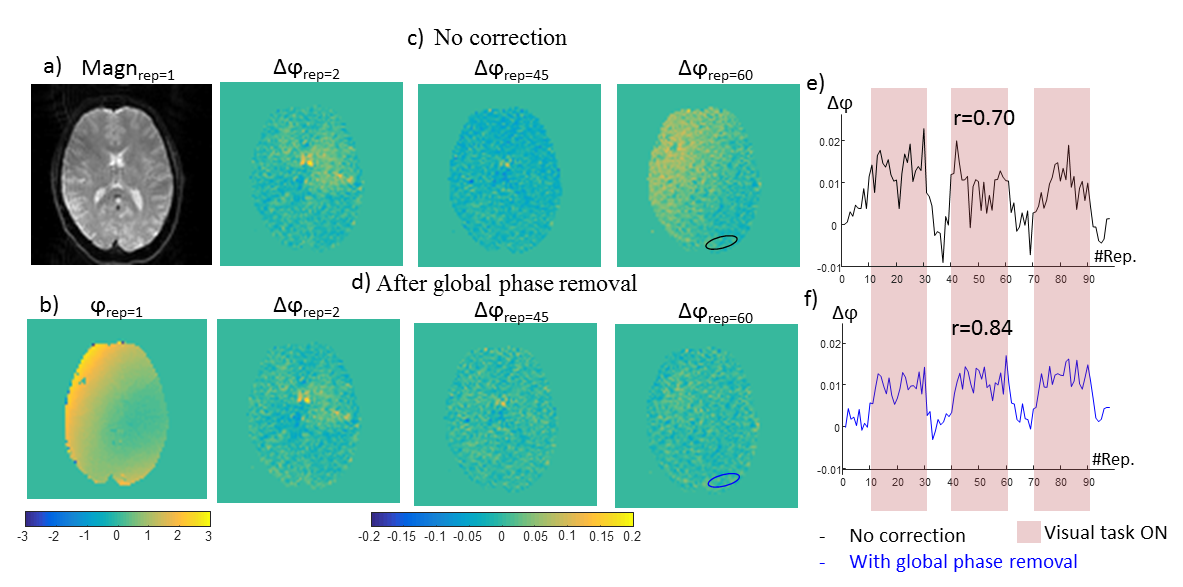
Figure
3: Signal phase change analysis versus the visual task. a) and b) Magnitude and
phase (ϕ) maps of the first scan. Three representing images of
the Δϕ (for repetitions #2, #45 and #60) without (c) and with global phase removal (d). e) and f) show signal phase change for tscore>1.5
in a region of interest (shown by an overlay) without and with the phase
correction, respectively. Correlation coefficient versus task is shown. Scan parameters of SE-EPI were TR/TE 3000/48 ms, FOV 200x200 mm2,
slice thickness 5 mm, spatial resolution 2.5x2.5 mm2.
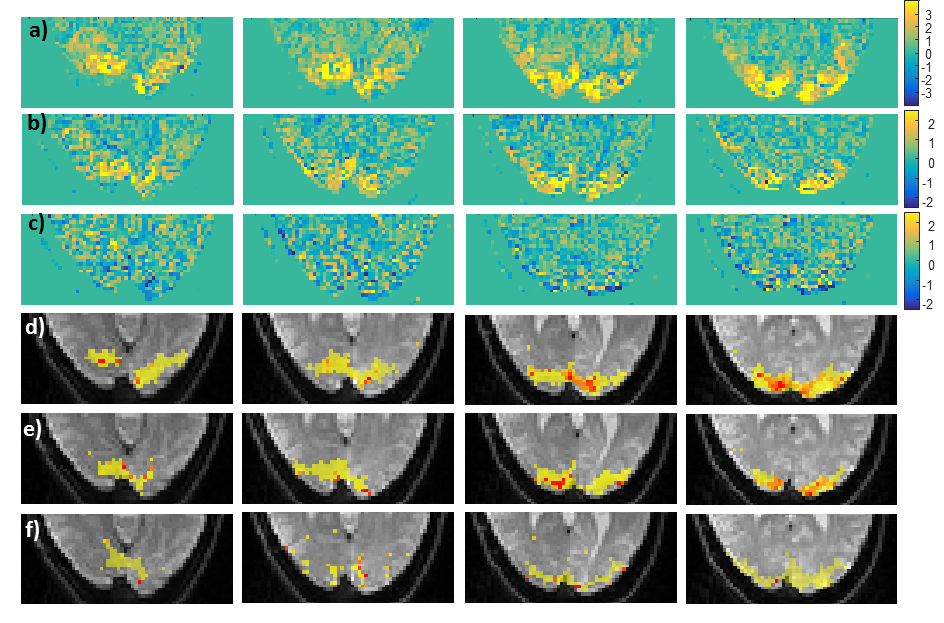
Figure
4: T-score maps calculated for (a) BOLD, (b) SE-EPI
magnitude, and (c) SE-EPI phase experiments. (4 slices are shown.) d)-f) show
the |t-score| as an overlay on the SE-EPI magnitude images for (d) BOLD, (e) SE-EPI
magnitude, and (f) SE-EPI phase. d) and
e) (magnitude cases) show |t-score| >3 and f) phase case shows |t-score|>2. BOLD scan parameters were
TR/TE 3000/30 ms, FOV 200x200 mm2, slice thickness 5 mm, spatial
resolution 2.5x2.5 mm2. SE-EPI scan parameters were TR/TE 3000/48
ms, FOV 200x200 mm2, slice thickness 5 mm, spatial resolution
2.5x2.5 mm2.
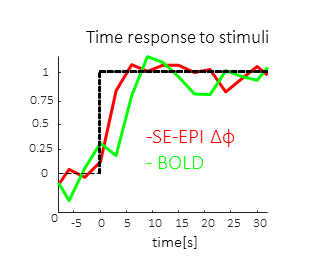
Figure
5:
Comparison of the time response to the stimuli for voxels shown in Fig.4,
BOLD (green) and phase-change in SE-EPI (red).