3775
On the detection of resting-state correlations at high-frequencies under hyper- and hypo- capnic conditions1Neurology, University of New Mexico, Albuqueruque, NM, United States, 2University of New Mexico, Albuqueruque, NM, United States, 3Mind Research Network, Albuqueruque, NM, United States
Synopsis
In this study, we investigate the detection of resting-state fluctuations at higher frequencies using changes in global blood flow using hyper- and hypo- capnic conditions. A new adaptive TR approach enables higher sensitivity for detecting the resting-state fluctuations at higher frequencies through optimized TR that is tailored to the individual cardiac and respiratory rates. We were able to detect major resting-state networks (sensory motor, default-mode, and auditory) at frequencies between 0.45-0.8 Hz in normo-, hyper-, and hypo- capnic conditions.
Introduction
Probing the resting-state connectivity at higher frequencies relative to the conventional low frequency range (< 0.15 Hz) has gained considerable interest in the recent past, particularly with the advent of highly accelerated fMRI acquisition techniques. Several recent studies1-5 have reported correlations in resting-state fMRI data at higher frequencies up to ~5 Hz in major resting-state networks, including our own using multi-slab Echo Volumar Imaging (MEVI)2. However, further investigation into the underlying biophysical mechanism(s)6,7 is necessary to fully characterize the origin of these correlations. In our previous studies, the focus has been attaining maximum possible temporal resolution which enables unaliased sampling of physiological noise components and their harmonics – which hampered the sensitivity to detect low-amplitude resting-state correlations. In this study, we implemented an adaptive-TR approach by tailoring the sampling-rate to the instantaneous cardiac and respiratory rates, thus aliasing the physiological noise components into the frequency ranges that are not of interest during hyper- and hypo- capnic conditions. This approach has resulted in higher sensitivity for mapping resting-state correlations at higher frequencies by modulating the global blood flow with CO2 inhaled hypercapnia, and hyperventilation induced hypocapnia – which result in significant changes of the hemodynamics response function (HRF) amplitude and time course with minimal changes in neural activation8,9.Methods
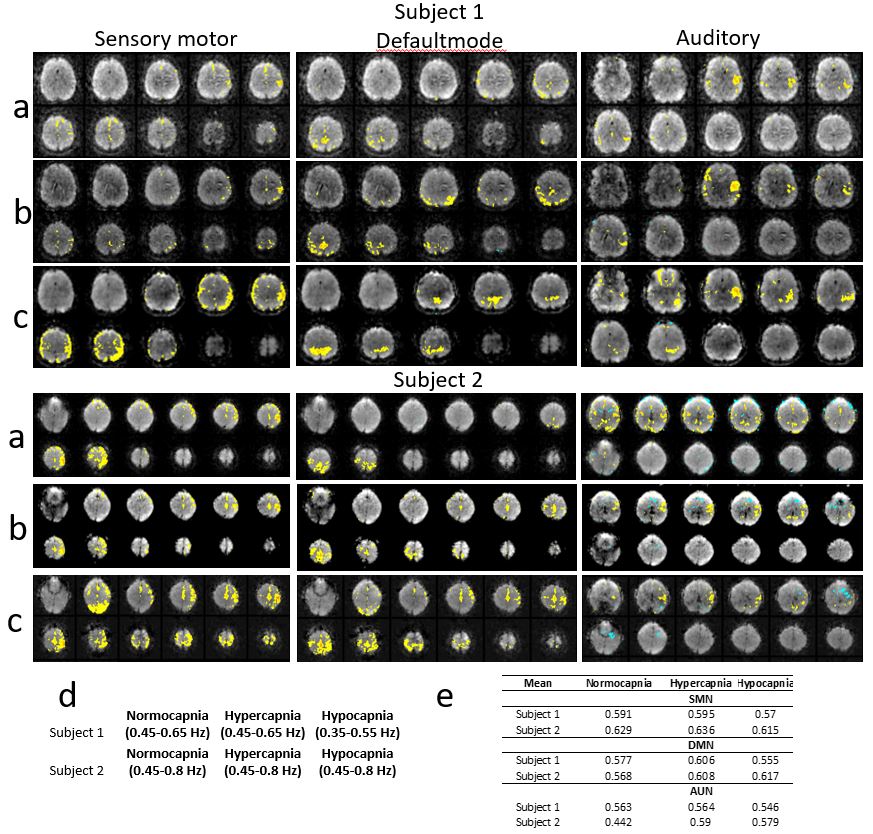
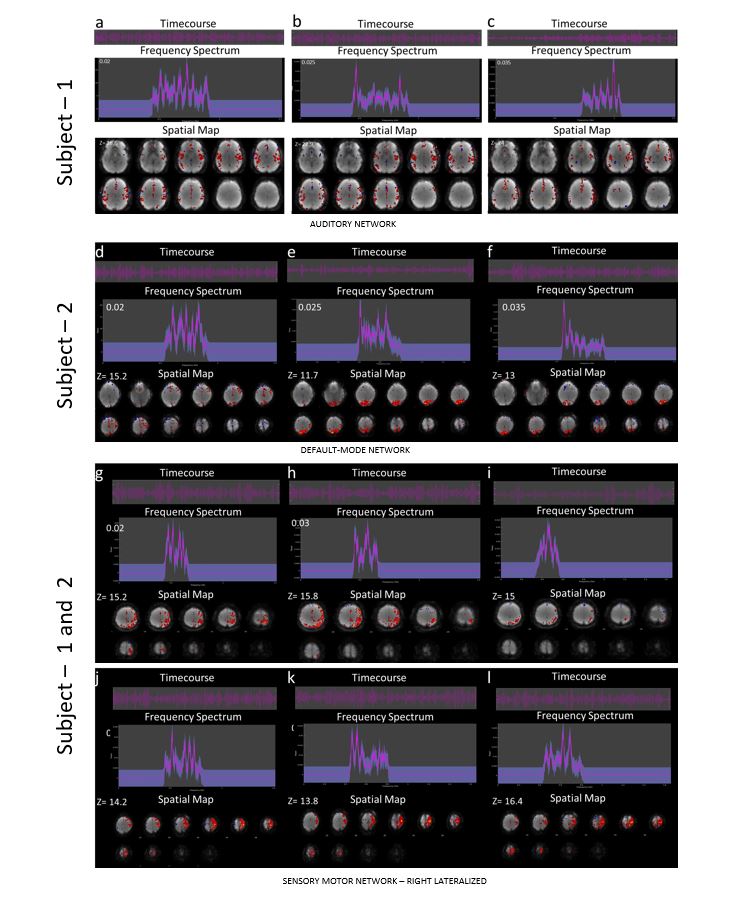
Resting-state fMRI scans (eyes open) during (a) normocapnia (pETCO2: 40+/-2mmHg), (b) capnometry controlled hypercapnia (pETCO2: 55+/-5mmHg) induced by inhaling 16 liters/min air mixed with 2-2.5 liters/min of CO2, and capnometry controlled hyperventilation to induce hypocapnia (pETCO2: 19-25mmHg) were performed in 4 healthy male adults (22–40years) on a 3T scanner equipped with 32-channel array coil. Institutionally approved informed consent was obtained. FMRI data were acquired using Multi-Slab Echo Volumar Imaging (MS-EVI) (TR/TE:301-330ms/32ms , Voxel: 4mm isotropic, Matrix:48x48x8x4, GRAPPA3, scan time: 6:07min) and MB8-EPI (TR/TE: 136/33ms, Voxel: 3mm isotropic, Matrix: 64x64x8x2, scan time: 6:05min). Cerebral blood flow (CBF) was measured using multi-slice pseudo-continuous arterial spin labelling (pCASL)10 (TR/TE: 4040/13ms, voxel size: 2.5x2.5x2.5mm, 20 slices with 20% gap, acquisition time: 1:24 minutes11). Data were motion corrected before applying high-order (~200) band-pass FIR filtering using -60dB stop bands, a 0.5 Hz transition band, and passband ripple of 1dB was used to remove low frequency connectivity, respiratory and cardiac pulsatility (their harmonics) at the full width at 10% of peak maximum. The changes in respiratory and cardiac frequencies during hyper- and hypo-capnic conditions were compensated by narrowing the passband to the overlap frequency range with normocapnic data. Seed-based resting-state connectivity analysis was performed using TurboFIRE12,13 and custom MATLAB software. Processing steps included rigid body motion correction, and spatial smoothing with a 5mm Gaussian filter. Seeds were selected manually in auditory (AUN), sensorimotor (SMN), and default mode networks (DMN). Sliding window (15s) correlation analysis was performed with running mean. A spatially constrained cluster analysis identified the maximum and mean correlations within each of the seed regions. Spatial independent component analysis (sICA) was performed using GIFT software (https://mialab.mrn.org) with 30 independent components across the hyper- and hypo-capnic conditions and subjects. Processing steps included motion correction, bandpass filtering, and 5mm spatial Gaussian filter.Results
Our earlier studies focusing on the maximizing-TR resulted in relatively lower sensitivity for detecting the resting state fluctuations at high-frequencies with higher noise content due to higher accelerated factors (results not shown). With the adaptive-TR, seed based connectivity analysis (Figure 1) showed increase in the meta-mean correlation amplitudes in hyper- and hypo- capnic conditions relative to normocapnia in sensorimotor, default mode, and auditory networks in both the subjects. The corresponding cluster analysis results show comparable correlation amplitude in hyper- and hypo- capnic conditions. Spatial independent component analysis (Figure 2) further confirms the presence of high-frequency correlations in the data with the detection of auditory, default-mode, and lateralized sensorimotor networks. The sICA analysis showed up to 90-95% noise components in all the three subjects including residual motion and physiological noise.Discussion
Our previous observation of high frequency correlations in normocapnic condition now extends to hyper-, and hypo-capnic conditions. The adaptive-TR method provides a compromise between sensitivity of mapping high frequency correlation with unaliased sampling of cardiac and respiratory signals. Movement related artifacts may still confound observed correlations, particularly during hypocapnia, despite best efforts to minimize head movement. The sensitivity of mapping high-frequency correlations as a function of sampling rate (136ms–400ms) across MBEPI, MSEVI, and MB-EVI acquisition methods is currently under progress.
Conclusion
This study confirms our previous findings of normocapnic resting-state correlations at higher frequencies under hyper- and hypo-capnic conditions using both seed-based and data-driven approaches. The adaptive TR technique facilitates tailoring of sampling rates to enhance sensitivity of mapping resting-state correlations.Acknowledgements
This research was supported by 1R21EB022803-01. We gratefully acknowledge Victoria Bixler and Amanda Gurule for their assistance with MR operations. Special thanks to our research participants.References
[1] S. Posse, E. Ackley, R. Mutihac, J. Rick, M. Shane, C. Murray-Krezan, M. Zaitsev, and O. Speck, "Enhancement of temporal resolution and BOLD sensitivity in real-time fMRI using multi-slab echo-volumar imaging," Neuroimage, vol. 61, pp. 115-130, May 15 2012, 3342442.
[2] C. Trapp, K. Vakamudi, and P. S, "On the detection of high frequency correlations in resting state fMRI," NeuroImage, 2017.
[3] H. L. Lee, B. Zahneisen, T. Hugger, P. LeVan, and J. Hennig, "Tracking dynamic resting-state networks at higher frequencies using MRencephalography," Neuroimage, vol. 65, pp. 216-222, Jan 15 2013.
[4] R. N. Boubela, K. Kalcher, W. Huf, C. Kronnerwetter, P. Filzmoser, and E. Moser, "Beyond Noise: Using Temporal ICA to Extract Meaningful Information from High-Frequency fMRI Signal Fluctuations during Rest," Front Hum Neurosci, vol. 7, p. 168, 2013, 3640215.
[5] Y.-H. A. Chu, Jyrki; Raij, Tommi; Kuo, Wen-Jui; Belliveau, John W.; Lin, Fa-Hsuan, "Resting-State fMRI at 4 Hz," in Annual Meeting of the ISMRM, Salt Lake City, 2013, p. 41.
[6] J. E. Chen and G. H. Glover, "BOLD fractional contribution to resting-state functional connectivity above 0.1 Hz," Neuroimage, vol. 107, pp. 207-218, Feb 15 2015, 4318656.
[7] P. K. Valur Olafsson, and Thomas Liu, "Multi-Echo Independent Component Analysis (ME-ICA) of High Frequency Resting-State fMRI Data," in Annual Meeting of the International Scoiety of Magnetic Resonance in Medicine, Toronto, 2015, p. 2053.
[8] S. Posse, L. J. Kemna, B. Elghahwagi, S. Wiese, and V. G. Kiselev, "Effect of graded hypo- and hypercapnia on fMRI contrast in visual cortex: Quantification of T-2* changes by multiecho EPI," Magnetic Resonance in Medicine, vol. 46, pp. 264-271, Aug 2001.
[9] L. J. Kemna and S. Posse, "Effect of respiratory CO(2) changes on the temporal dynamics of the hemodynamic response in functional MR imaging," Neuroimage, vol. 14, pp. 642-649, Sep 2001.
[10] W. C. Wu, M. Fernandez-Seara, J. A. Detre, F. W. Wehrli, and J. Wang, "A theoretical and experimental investigation of the tagging efficiency of pseudocontinuous arterial spin labeling," Magn Reson Med, vol. 58, pp. 1020-1027, Nov 2007.
[11] D. C. Alsop, J. A. Detre, X. Golay, M. Gunther, J. Hendrikse, L. Hernandez-Garcia, H. Lu, B. J. MacIntosh, L. M. Parkes, M. Smits, M. J. van Osch, D. J. Wang, E. C. Wong, and G. Zaharchuk, "Recommended implementation of arterial spin-labeled perfusion MRI for clinical applications: A consensus of the ISMRM perfusion study group and the European consortium for ASL in dementia," Magn Reson Med, vol. 73, pp. 102-116, Jan 2015, PMC4190138.
[12] S. Posse, F. Binkofski, F. Schneider, D. Gembris, W. Frings, U. Habel, J. B. Salloum, K. Mathiak, S. Wiese, V. Kiselev, T. Graf, B. Elghahwagi, M. L. Grosse-Ruyken, and T.Eickermann, "A new approach to measure single-event related brain activity using real-time fMRI: Feasibility of sensory, motor, and higher cognitive tasks," Human Brain Mapping, vol. 12, pp. 25-41, Jan 2001.
[13] S. Posse, E. Ackley, R. Mutihac, T. Zhang, R. Hummatov, M. Akhtari, M. Chohan, B. Fisch, and H. Yonas, "High-speed real-time resting-state FMRI using multi-slab echo-volumar imaging," Front Hum Neurosci, vol. 7, p. 479, 2013, 3752525.
Figures