3769
Effects of Spinal Cord vascular geometry on the BOLD-fMRI contrast1IRCCS Fondazione Santa Lucia, Rome, Italy, 2Centro Fermi-Museo Storico della Fisica e Centro Studi e Ricerche "Enrico Fermi", Rome, Italy, 3A.I. Virtanen Institute for Molecular Sciences, University of Eastern Finland, Kuopio, Finland, 4CNR-Nanontec, c/o Dipartimento di Fisica, Rome, Italy
Synopsis
The effects of the spinal cord (SC) vessel topology on the blood oxygenation level dependent (BOLD) signal is poorly characterized. We performed numerical simulations on models of vasculature
Introduction
With the introduction of the fMRI, different BOLD models have been developed to characterize fMRI signal in the brain grey matter 1,2. Nonetheless, there is still poor literature about the characterization of the BOLD in the spinal cord (SC). All these models are strongly influenced by the vessel geometry (i.e. orientation and size) 3,4,5,6, which in SC substantially differs from brain. The vascular network of the brain is randomly distributed with respect to the external magnetic static field 7,8. On the contrary, within the SC the macro- and the micro-vasculature is preferentially oriented parallel or perpendicularly to the external magnetic field, respectively 7,8. The study was performed by means of numerical simulations of the static magnetic field on the SC vascular network. In particular, we studied the effect of the vessel orientation on the BOLD signal of simplified vessel models and subsequently using more complex vasculature systems extracted from X-ray tomographic images in a mouse SC. In this work, we examined the effects of the topology of the vasculature on the BOLD signal with the aim of determining the local variations in the induced magnetic field.Methods
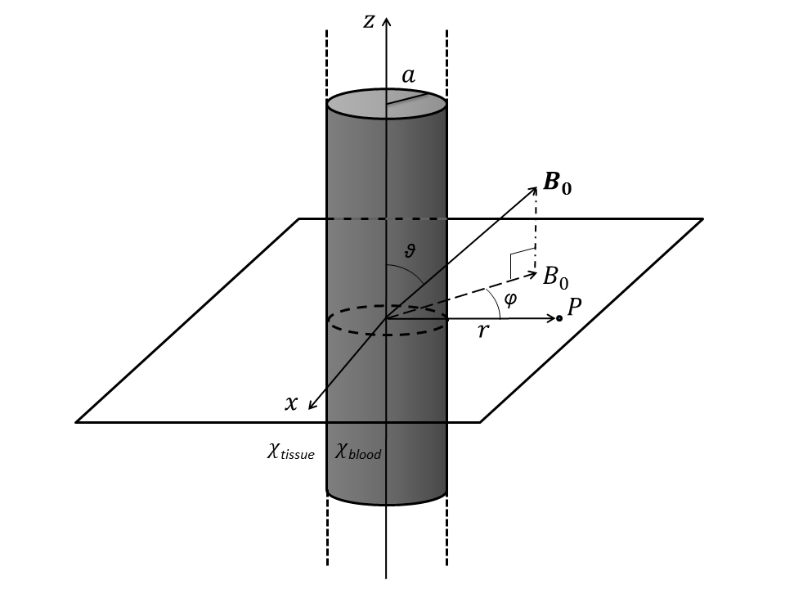
Numerical simulations on a simplified model of SC vasculature have been performed in order to quantify the effect of the vessel micro and macro distribution in the BOLD contrast. The induced local magnetic field was determined a angular frequency, through several numerical simulations representing the vessels as the so-called Infinite Cylinder Model (ICM, see Figure 1). After that, the diffusion random walk of the water molecule was computed show a Montecarlo simulation implemented in Matlab 9. The induced magnetic field was then integrated over these Brownian paths in order to calculate the accumulated phase for a particular echo time. Thanks to the knowledge of the phase, it was possible to determine the effective transverse relaxation rate constant R2*and consequently the BOLD signal 1,2,10,11.
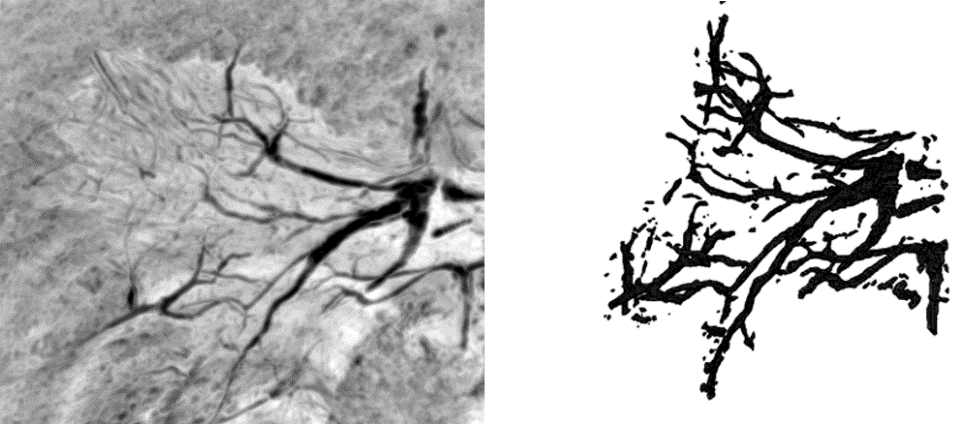
We improved the model using the COMSOL Multiphysics 12 software simulator and the SC vascular network extracted from the segmented X-ray tomographic images (Figure 2). The effective transverse relaxation rate constant R2* was then computed in the same way as described for the simplified model.
Results
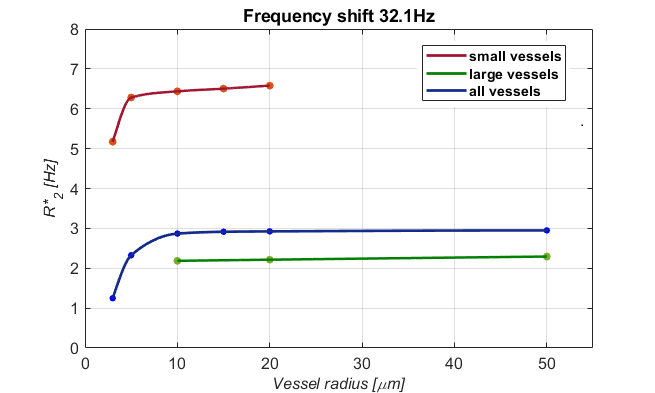
Our results show that small vessels contribute the most in the variation of the transverse relaxation rate R2* and therefore of the BOLD signal. On the contrary, a smaller contribution arises from large vessels, whose distribution is parallel to the direction of the external magnetic field ω0. In Figure 3, the relaxation rate constant value as a function of the vessel radius is reported for different vessel radius (small, large and aggregate). We observed that value is greater for the small transverse R2* compared to the large longitudinal vessels. These results indicate that SC microvascular system contributes to the BOLD more than the macrovascular one. Moreover, our results suggest that SC BOLD contrast function is greater with respect to the brain 11 (0.7-0.9 a.u.) being in the range of 0.8-1 a.u. as a function of the echo time (range of 0-100 ms).Discussion and Conclusion
We have obtained computational evidence that the BOLD contrast in SC is larger than in brain due to the more anisotropic distribution of the vascular network. The SC distribution of large vessels, only on the surface of the SC, should enhance the specificity of fMRI BOLD signal, even with R2* weighting, because of the inherent elimination of the confounding, unspecific effect of larger vessels from the grey matter signal. Similarly, the disposition of small vessels, all radial and thus orthogonal to magnetic field should emphasize the dephasing effect of deoxyhemoglobin. Therefore, the vascular anatomy of SC is optimally organized for the generation of strong and spatially specific BOLD effect. This can help in overcoming the numerous other difficulties that involves the SC fMRI. Overall, our study provide a theoretical framework for the experimental validation of the predicted BOLD signal, which will be useful for improving the design and analysis of SC fMRI data.Acknowledgements
This research was financially supported by The Italian Ministry of Health Young Researcher Grant 2013 (GR-2013-02358177).References
1. Ogawa, S., et al., Intrinsic signal changes accompanying sensory stimulation: functional brain mapping with magnetic resonance imaging. Proceedings of the National Academy of Sciences, 1992. 89(13): p. 5951-5955.
2. Ogawa, S., et al., Functional brain mapping by blood oxygenation level-dependent contrast magnetic resonance imaging. A comparison of signal characteristics with a biophysical model. Biophysical Journal, 1993. 64(3): p. 803-812.
3. Báez-Yánez, M.G., et al., The impact of vessel size, orientation and intravascular contribution on the neurovascular fingerprint of BOLD bSSFP fMRI. NeuroImage, 2017. 163: p. 13-23.
4. Dickson, J.D., et al., Quantitative phenomenological model of the BOLD contrast mechanism. Journal of Magnetic Resonance, 2011. 212(1): p. 17-25.
5. Kurz, F., et al., The influence of spatial patterns of capillary networks on transverse relaxation. Magnetic resonance imaging, 2017. 40: p. 31-47.
6. Shazeeb, M.S., J. Kalpathy-Cramer, and B. Issa, MRI Simulation Study Investigating Effects of Vessel Topology, Diffusion, and Susceptibility on Transverse Relaxation Rates Using a Cylinder Fork Model. Scientific reports, 2017. 7(1): p. 16223.
7. Blumenfeld, H., Neuroanatomy through clinical cases. 2014: Sinauer.
8. Ethan A. Prince and Sun Ho Ahn, Basic Vascular Neuroanatomy of the Brain and Spine: What the General Interventional Radiologist Needs to Know, Semin Intervent Radiol. 2013 ; 30(3): 234–239. 9. MathWorks Company Overview, on mathworks.com.
10. Uludağ, K., B. Müller-Bierl, and K. Uğurbil, An integrative model for neuronal activity-induced signal changes for gradient and spin echo functional imaging. Neuroimage, 2009. 48(1): p. 150-165. 11. Marques, J.P. and R. Bowtell, Using forward calculations of the magnetic field perturbation due to a realistic vascular model to explore the BOLD effect. NMR in Biomedicine: An International Journal Devoted to the Development and Application of Magnetic Resonance In vivo, 2008. 21(6): p. 553-565. 12. "COMSOL Modeling Software", on COMSOL.com. Comsol, Inc.
Figures