3766
R1 and R2 characterization of human blood with phase-cycled balanced steady-state free precession (bSSFP)1High-Field MR Center, Max Planck Institute for Biological Cybernetics, Tübingen, Germany, 2Graduate Training Centre of Neuroscience, IMPRS for Cognitive and Systems Neuroscience, University of Tübingen, Tübingen, Germany, 3Department of Biomedical Magnetic Resonance, University of Tübingen, Tübingen, Germany
Synopsis
Balanced steady-state free precession (bSSFP) sequences have received increased interest for functional BOLD experiments since, in contrast to conventional EPI-based techniques, they are not prone to geometric distortions in the phase encoding direction. Characterization of measured BOLD signal changes requires consideration of extravascular as well as intravascular contributions. Knowledge about the relaxation rates of human blood is a prerequisite to quantify the intravascular contribution to the BOLD effect. Here, R1 and R2 relaxation rates of blood samples are intrinsically obtained from a series of phase-cycled bSSFP scans to account for the repetition time dependence of R2 due to rapid refocusing.
Introduction
In recent years, balanced steady-state free precession (bSSFP) imaging has demonstrated ability to provide oxygen-sensitive contrast valuable for BOLD experiments 1,2,3,4. In this work, the intravascular contribution to BOLD bSSFP is investigated by characterizing the relaxation times of human blood samples differing in hematocrit (Hct) and oxygenation (Y) levels. For sequences with rapid refocusing such as bSSFP, R2 increases with longer repetition times – an effect similar to the echo-spacing dependence of R2 observed with CPMG 5 and caused by diffusion around red blood cells (RBCs) that contain paramagnetic deoxyhemoglobin. To consider this effect, R1 and R2 relaxation rates are directly estimated from a series of phase-cycled bSSFP scans based on the MIRACLE relaxometry method 6. For reference, R1, R2, and R2* values are obtained using gold-standard techniques.Methods
Blood sample preparation.
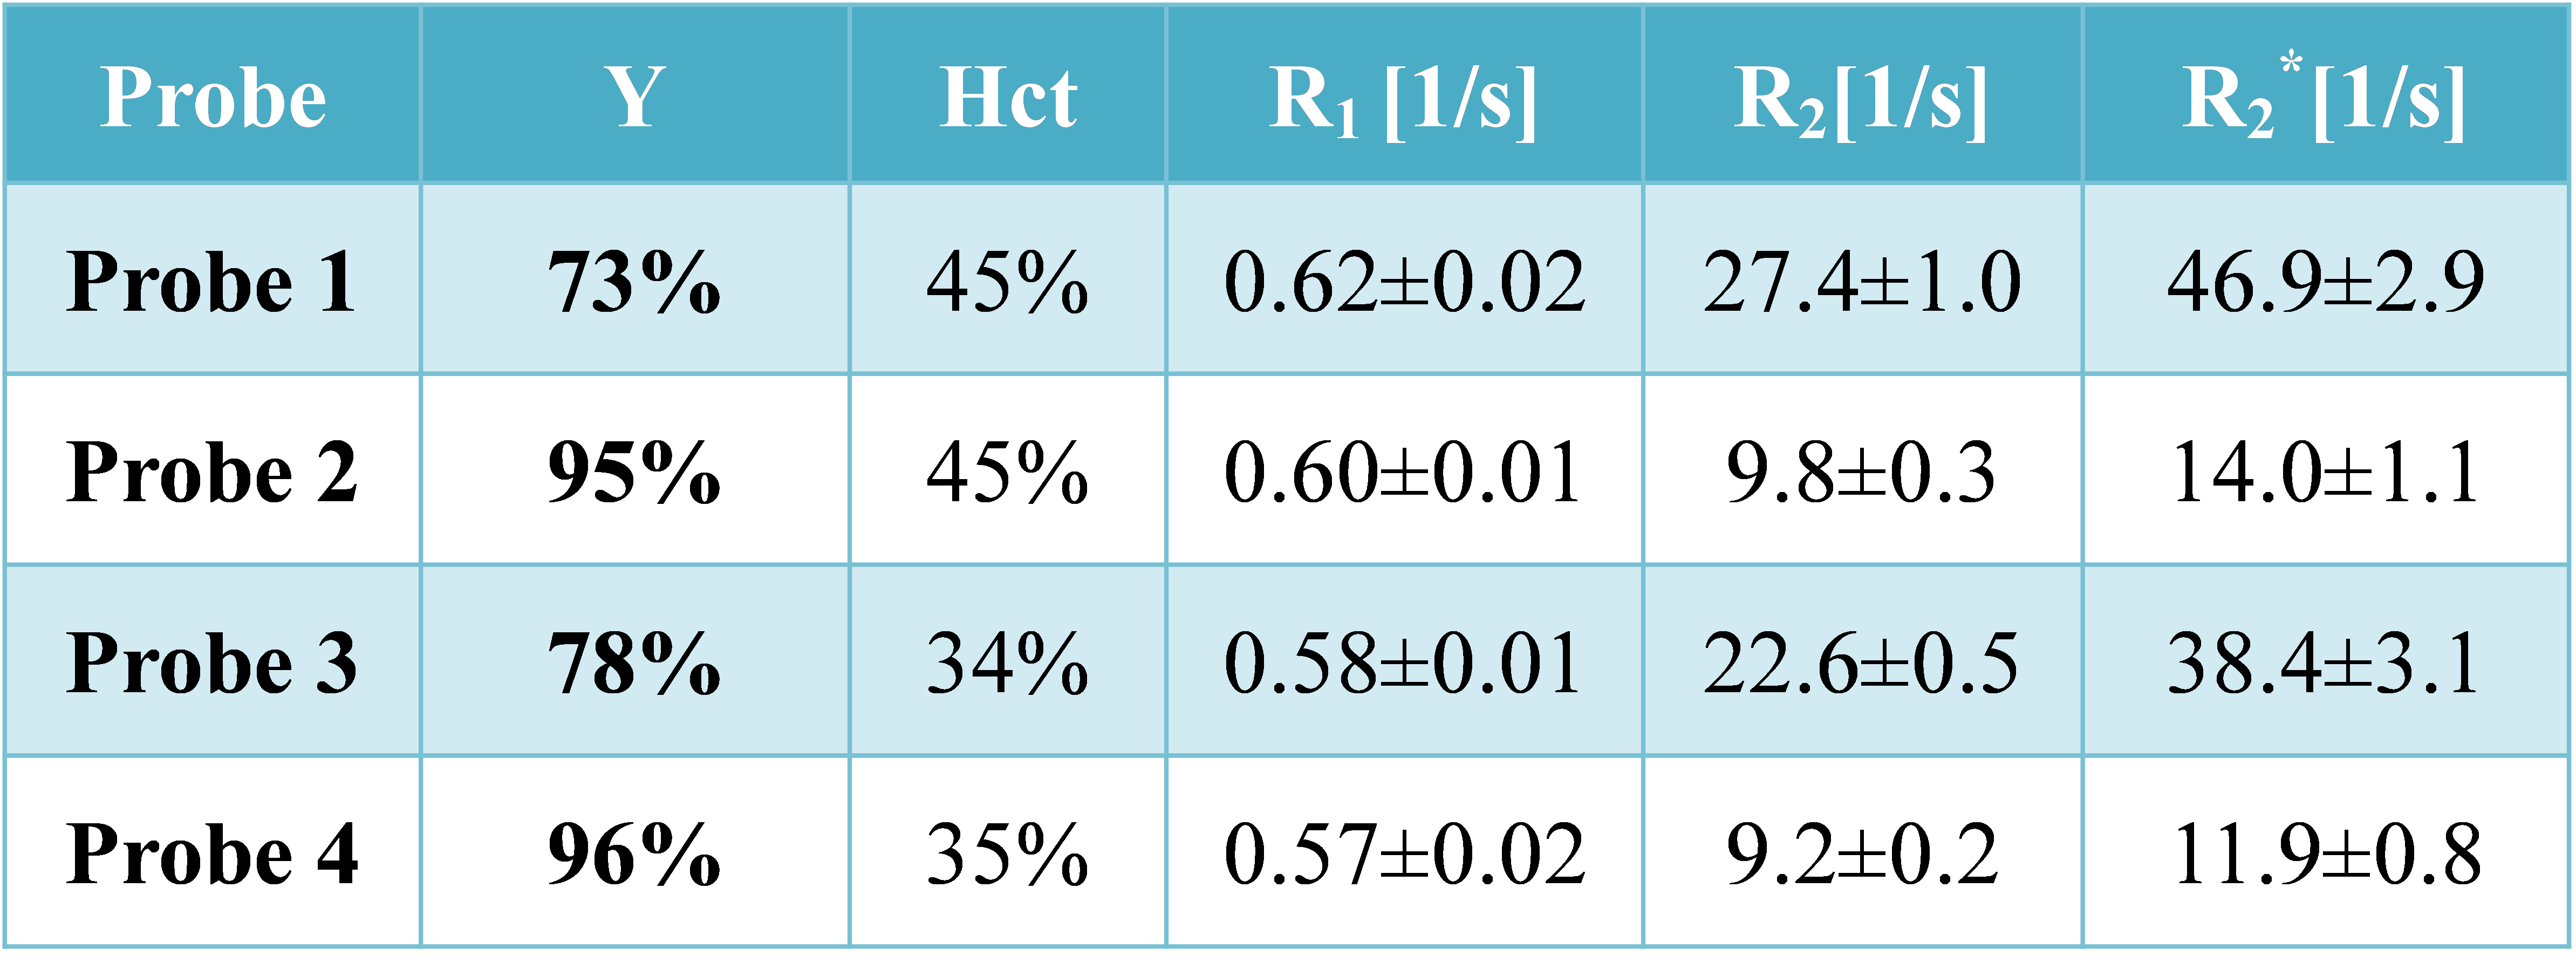
Fresh vein blood (20-30ml) was obtained from a healthy adult volunteer. A blood sample of ~10ml was centrifuged in order to separate plasma from RBCs. The extracted plasma was used to lower the Hct level. The oxygenation level was increased by bubbling air through the blood and gently mixing it. The Y and Hct values were assessed quantitatively using a radiometer after heating the blood samples in a water bath to a temperature of 37°C. In total, four blood samples were prepared in 3ml tubes; two of them with oxygenation levels reflecting resting state (~75%, referred to as deoxygenated) and the other two reflecting activated state (~95%, referred to as oxygenated). The two blood samples of each Y level differed in their Hct values (cf. Table 1).
MR acquisition at 3T.
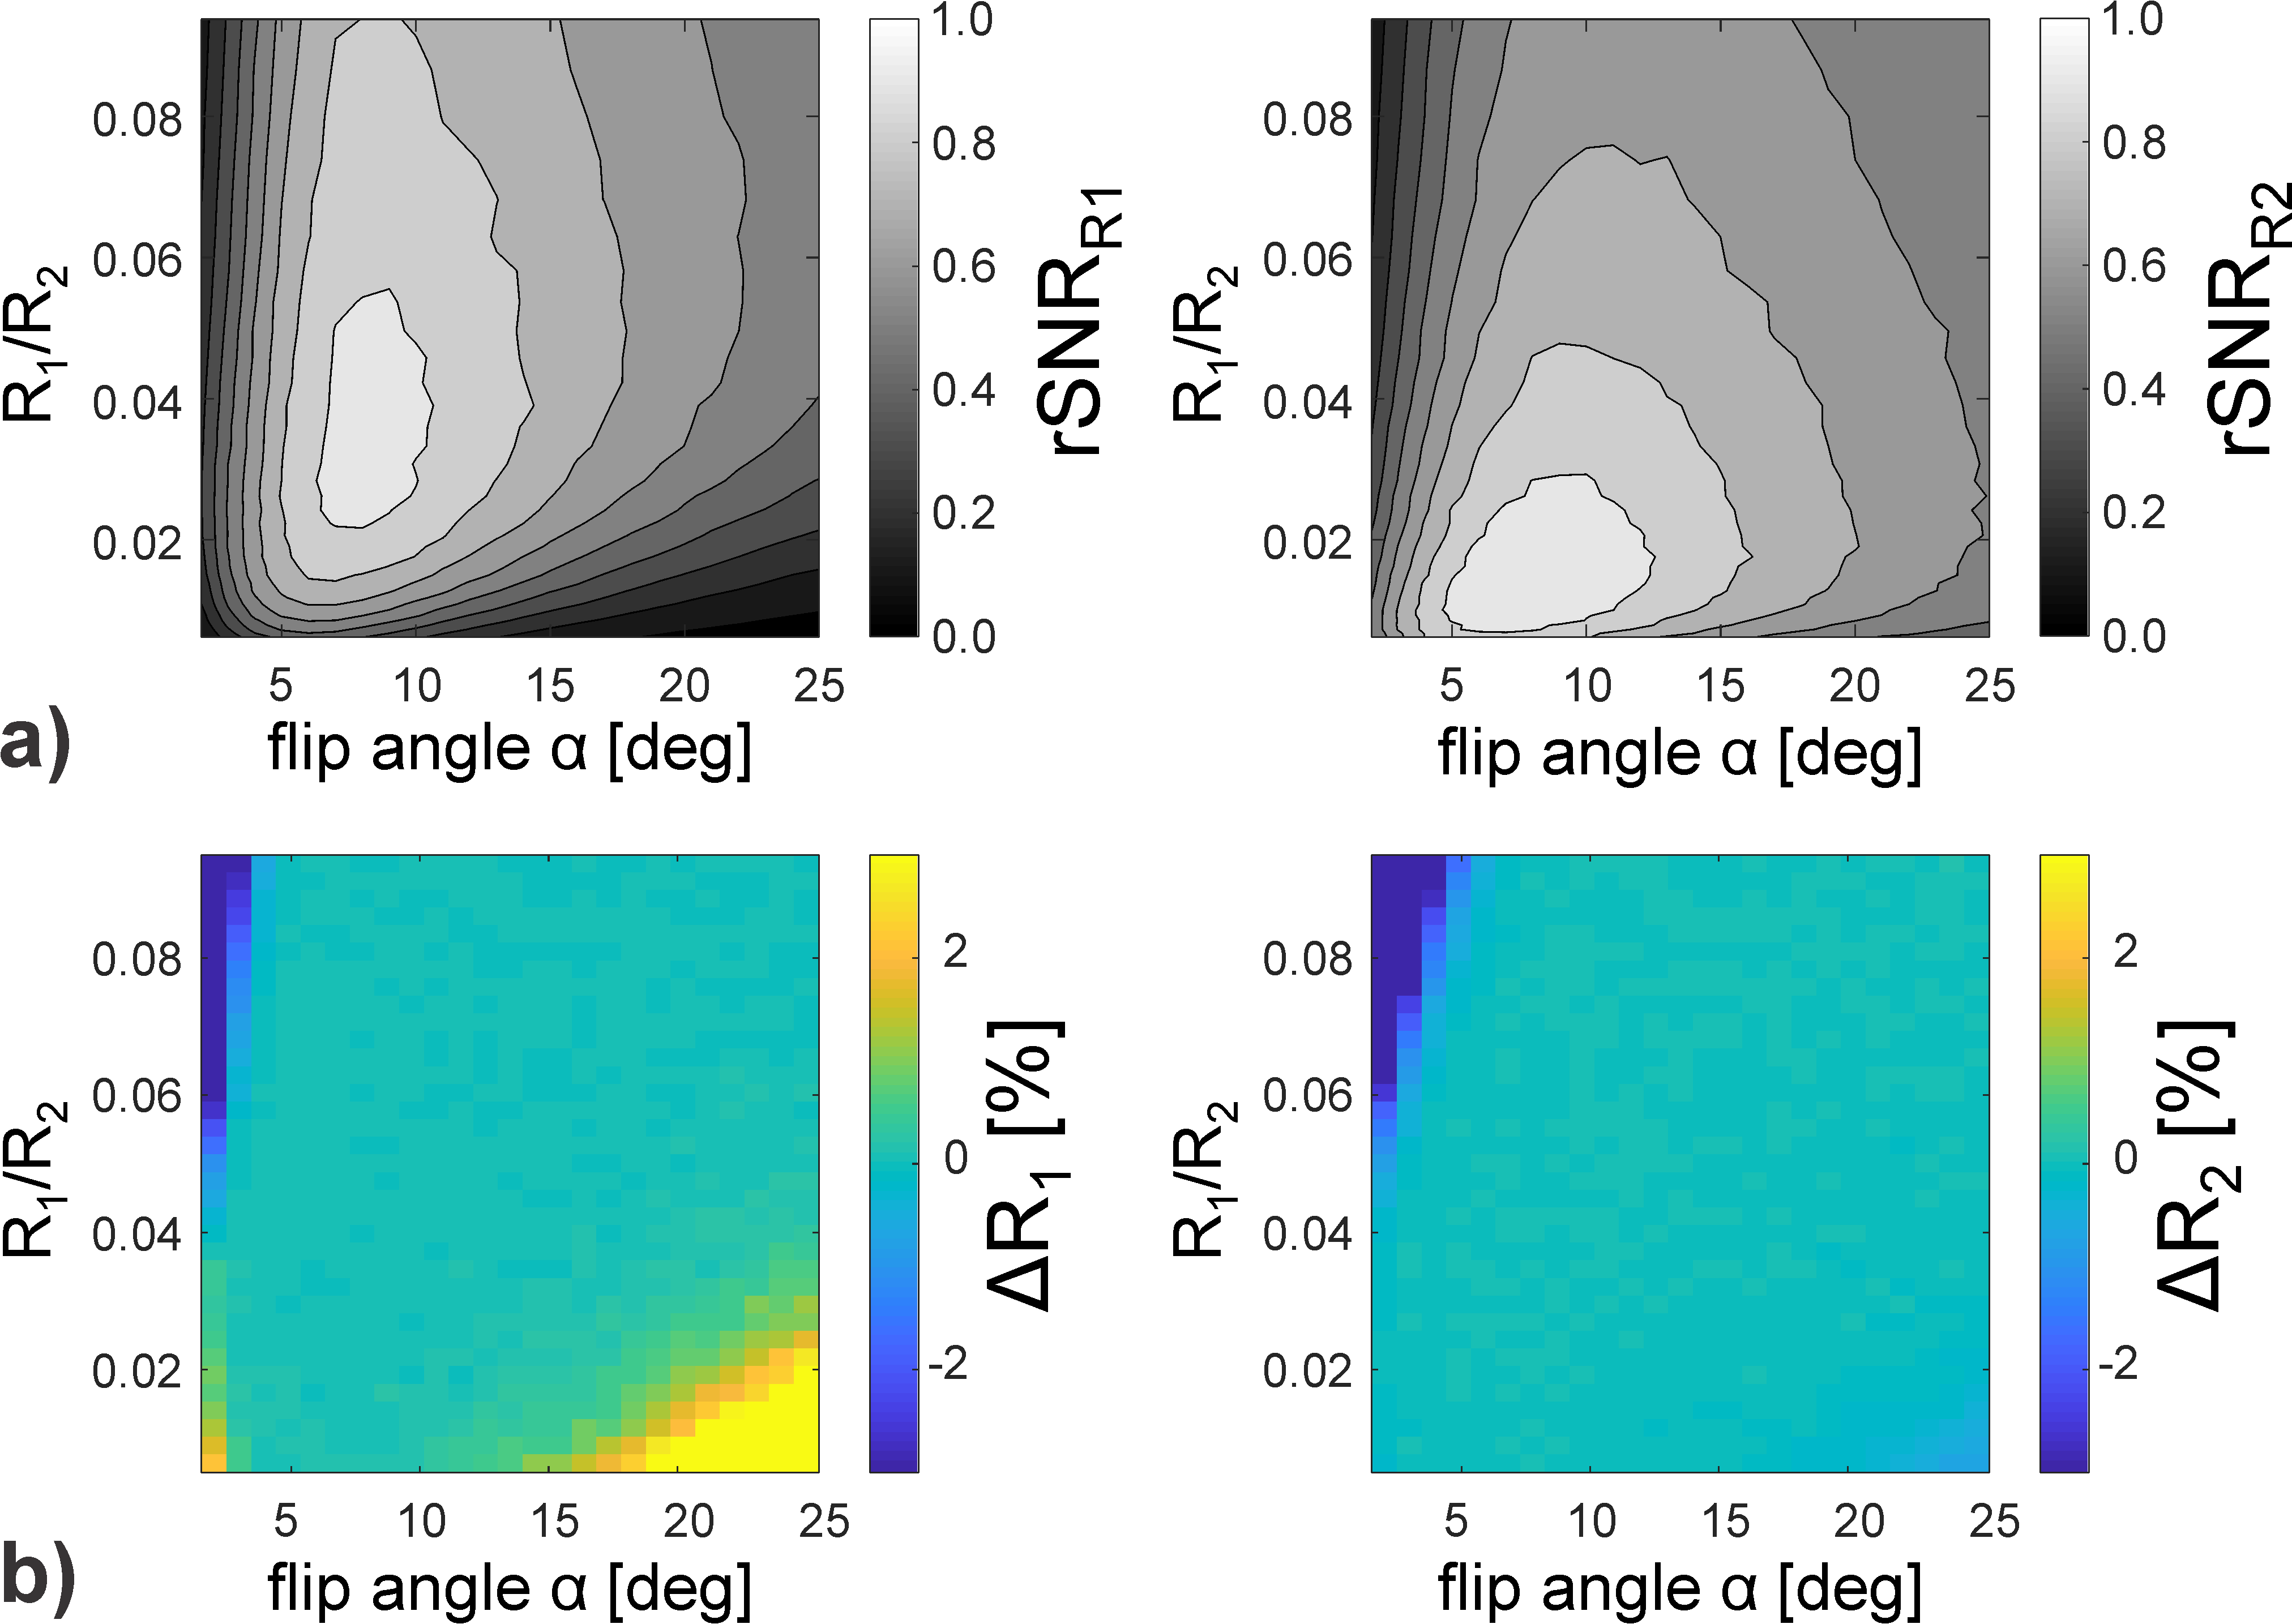
The prepared blood samples were placed in a cylindrical water phantom, connected to a temperature-controlled water pump to maintain a temperature of 37°C (switched off during the MR scans). The phantom was attached to an MR-compatible robot-arm, enabling to rotate the blood samples inbetween subsequent scans (maximal duration/scan: 7min) and thus to avoid RBC sedimentation. 3D phase-cycled bSSFP experiments were performed for 20 RF phase increments ϕ in the range (0°,360°) at a resolution of 1.2x1.2x2 mm3 (matrix size: 128x64x18). Based on a Fourier transform of the measured complex bSSFP frequency profile, R1 and R2 were estimated using MIRACLE 6. The bSSFP scans were repeated for TRs ranging from 4ms to 10ms in steps of 1ms at αopt=10°. The optimal flip angle αopt in terms of SNR in the R1 and R2 maps was found based on Monte-Carlo simulations with 10000 runs by adding 1% Gaussian white noise versus R1/R2 values reported for blood at 3T 7,8 (cf. Fig. 1). Gold standard R1 and R2 were derived based on single-slice inversion recovery with variable inversion times TI=[25, 200, 1000, 2000, 4000]ms and single-slice single-echo spin-echo with variable echo times TE=[10, 30, 75, 150, 300]ms. Gold standard R2* was obtained from a multi-echo gradient-echo sequence with echo times ranging from 4.92ms to 245ms.
Results
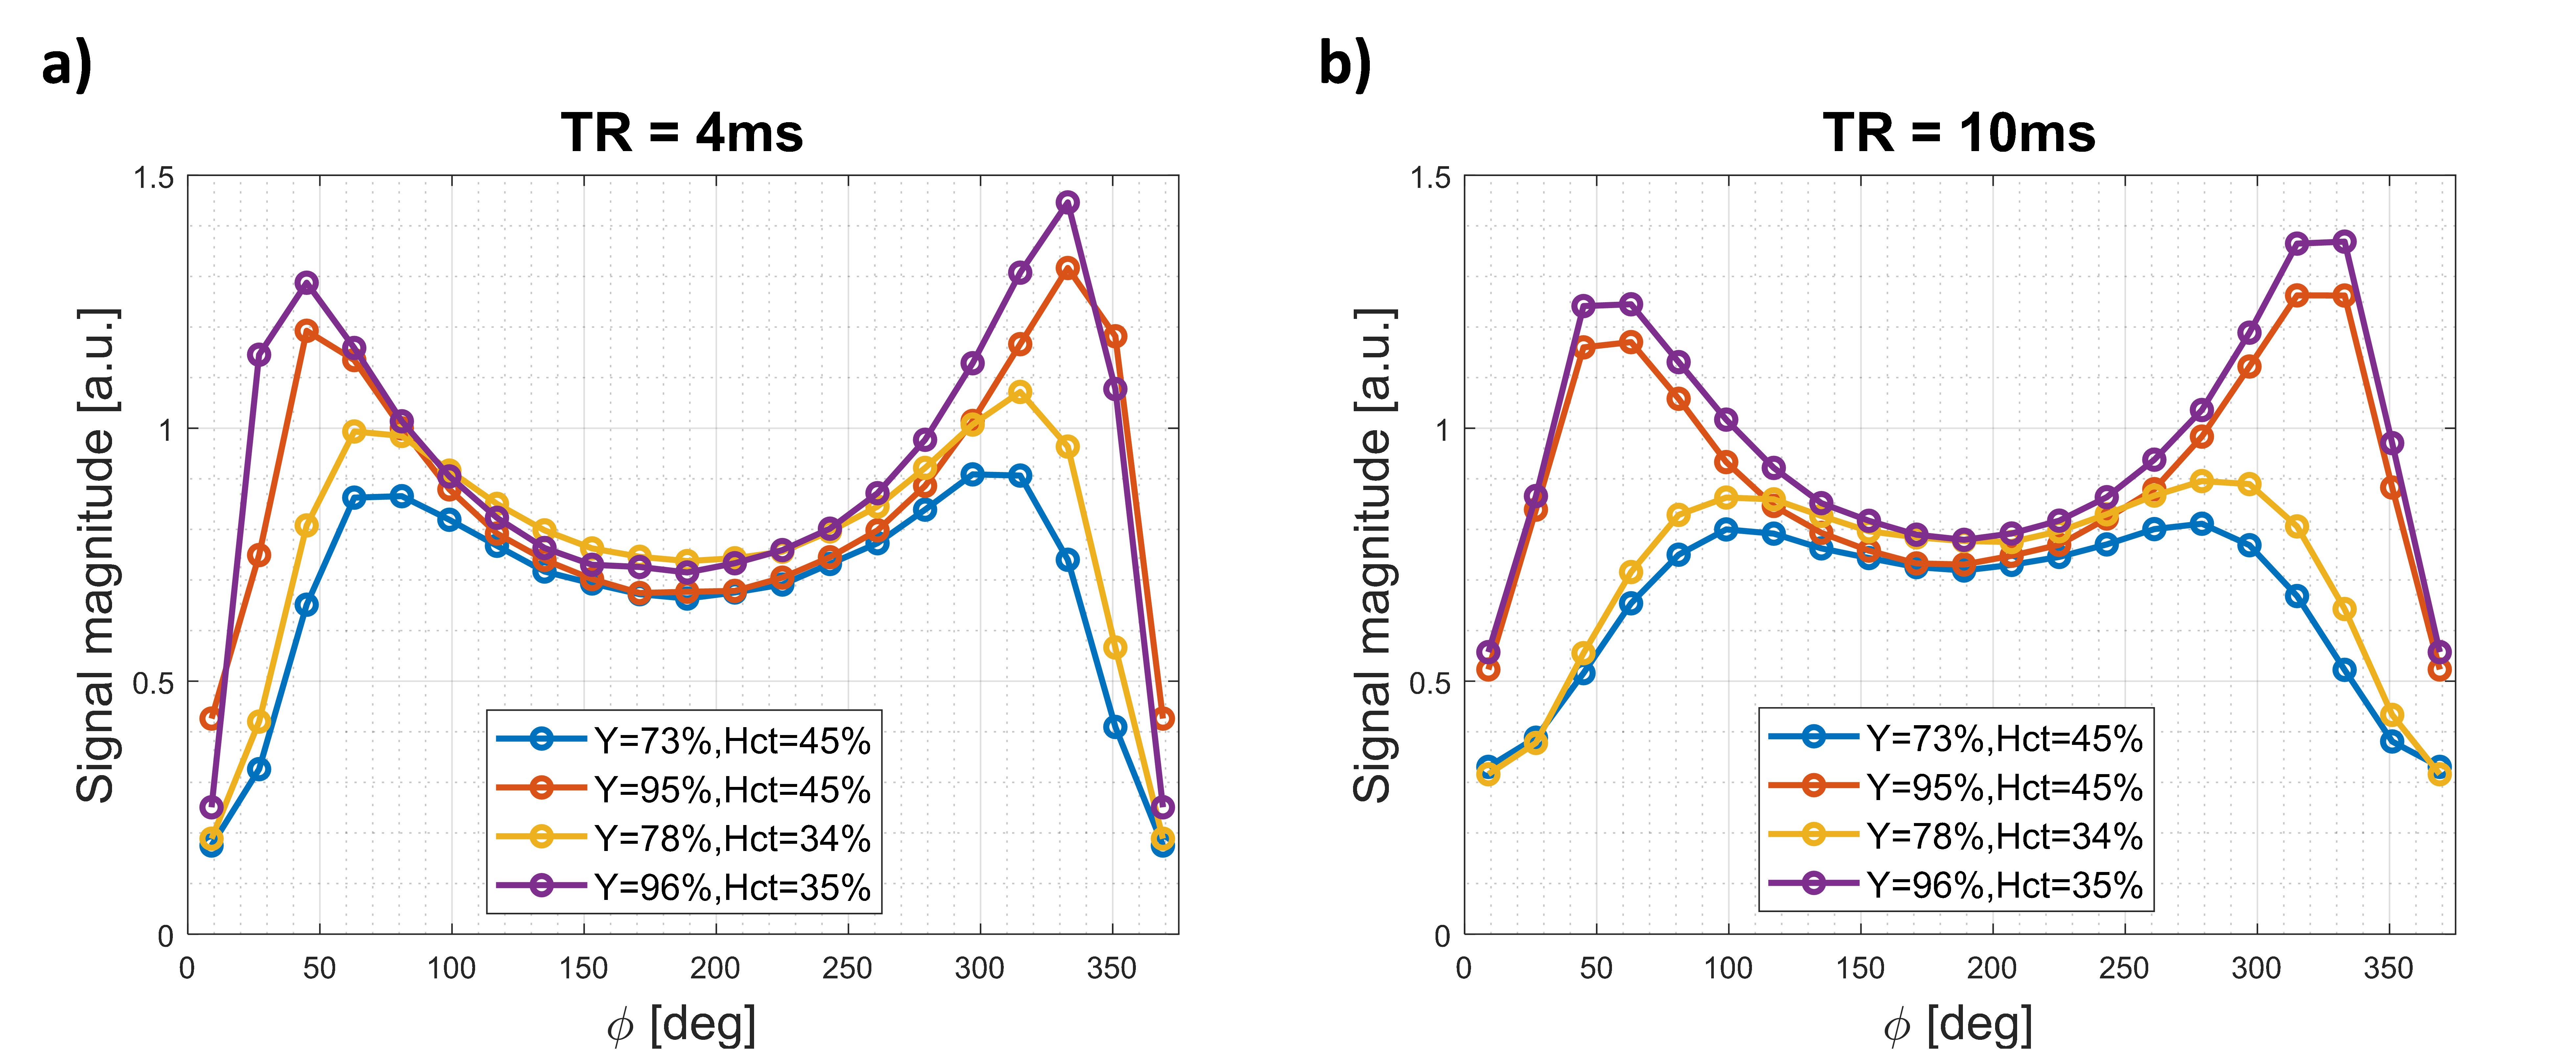
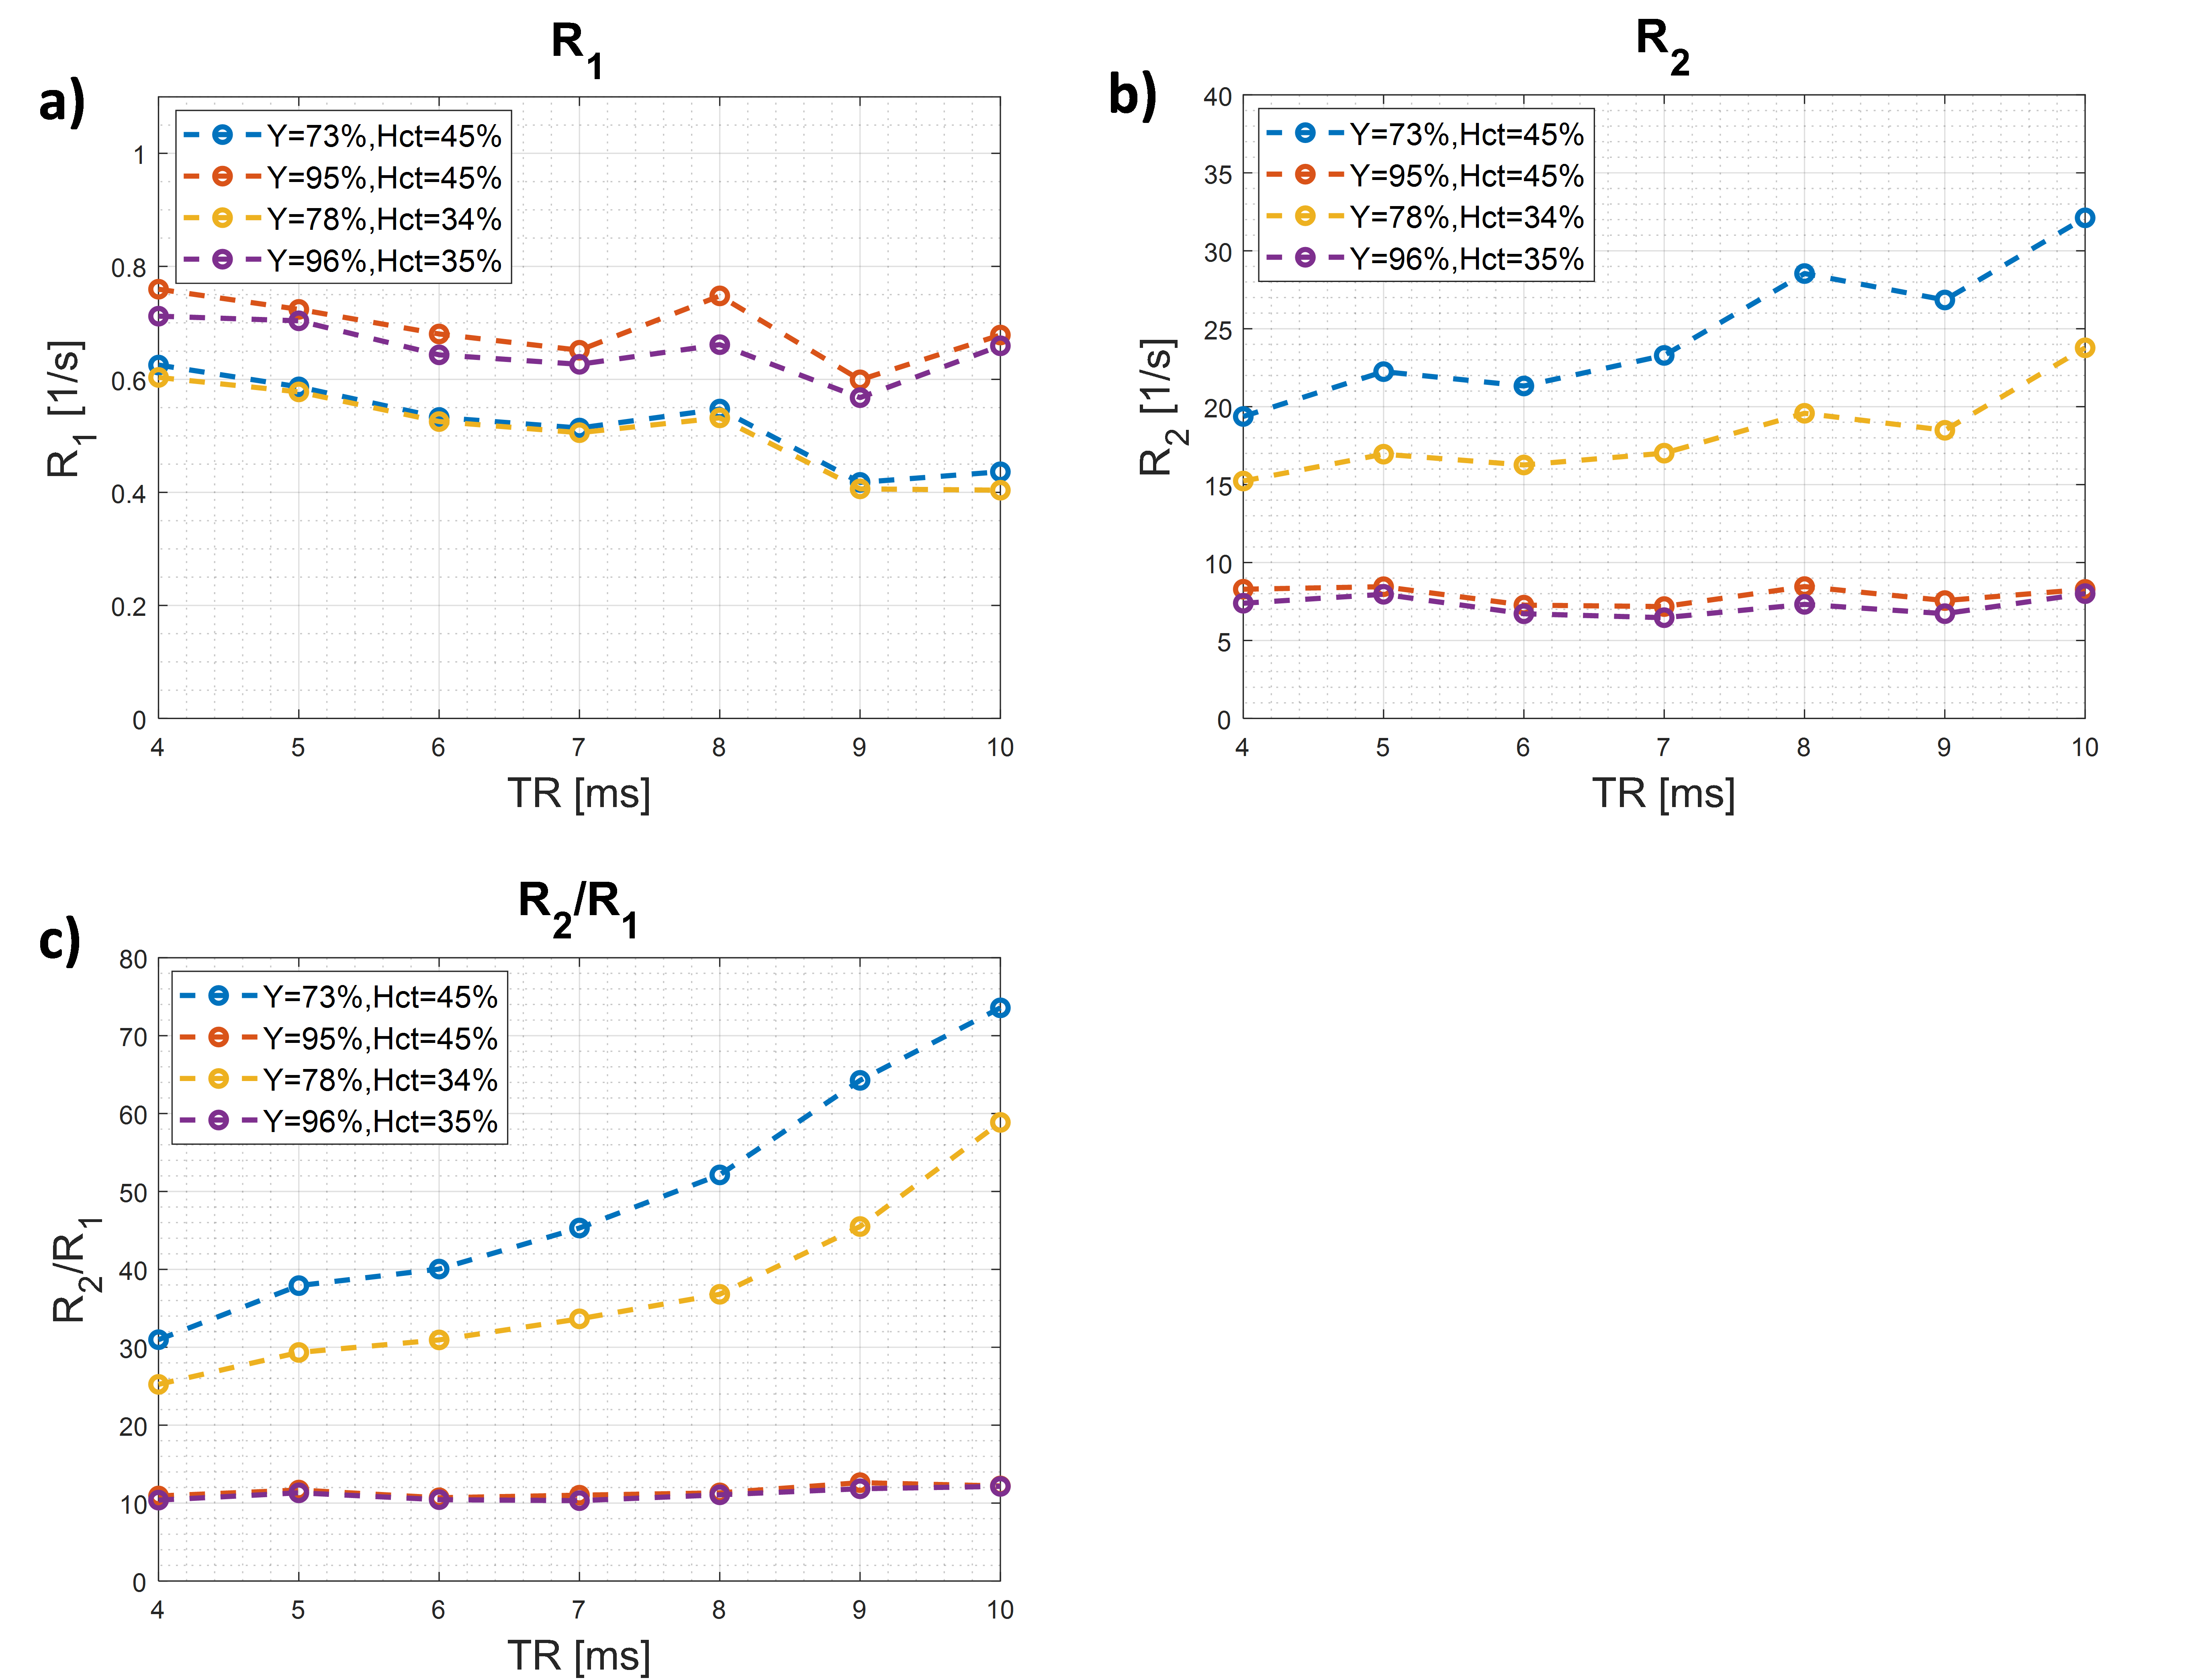
As evident from Figure 1a, MIRACLE-based R1 and R2 relaxometry performs optimally in terms of SNR for flip angles in the range of 5-10° with high accuracy in the presence of noise (cf. Fig. 1b). Here, a flip angle of 10° is used for all phase-cycled bSSFP experiments. Representative bSSFP frequency profiles measured in four blood probes are shown in Figure 2 (note the asymmetry, particularly in the oxygenated blood). Quantitative results for blood R1 and R2 estimation using MIRACLE are displayed in Figure 3. R1 tends to slightly decrease with increasing TRs (cf. Fig. 3a). R2 of the two deoxygenated blood samples shows the expected increase for longer TRs, while R2 of the oxygenated blood remains largely independent (cf. Fig. 3b). The R2/R1 ratio enhances the diffusion-sensitivity of the deoxygenated blood as corroborated by the strong increase versus TR whereas R2/R1 of the oxygenated blood is insensitive to TR (cf. Fig. 3c). High agreement between the relaxation rates obtained with MIRACLE and the gold standard is observed (cf. Fig. 3 and Table 1). The R2 values of the deoxygenated blood samples agree generally the better the longer the refocusing interval (TR), as expected.Discussion and Conclusion
While a rather low flip angle is optimal to
achieve maximal SNR in MIRACLE-based R1 and R2 maps (cf.
Fig. 1a), a higher flip angle may be preferred to maximize oxygen-sensitive
contrast 1. The expected sensitivity of MIRACLE R2 versus
TR in deoxygenated blood was evident. In conclusion, it was demonstrated that blood
R1 and R2 values can intrinsically be estimated from a
series of phase-cycled bSSFP scans enabling to assess the intravascular
contribution to BOLD bSSFP.Acknowledgements
No acknowledgement found.References
1. Dharmakumar R, Hong J, Brittain JH, Plewes DB, Wright GA. Oxygen-sensitive contrast in blood for steady-state free precession imaging. Magn Reson Med 2005;53(3):574-583.
2. Miller KL. FMRI using balanced steady-state free precession (SSFP). Neuroimage 2012;62(2):713-719.
3. Scheffler K, Ehses P. High-resolution mapping of neuronal activation with balanced SSFP at 9.4 Tesla. Magn Reson Med 2016;76(1):163-171.
4. Baez-Yanez MG, Ehses P, Mirkes C, Tsai PS, Kleinfeld D, Scheffler K. The impact of vessel size, orientation and intravascular contribution on the neurovascular fingerprint of BOLD bSSFP fMRI. Neuroimage 2017;163:13-23.
5. Gardener AG, Francis ST, Prior M, Peters A, Gowland PA. Dependence of blood R2 relaxivity on CPMG echo-spacing at 2.35 and 7 T. Magn Reson Med 2010;64(4):967-974.
6. Nguyen D, Bieri O. Motion-insensitive rapid configuration relaxometry. Magn Reson Med 2017;78(2):518-526.
7. Lu HZ, Clingman C, Golay X, van Zijl PCM. Determining the longitudinal relaxation time (T1) of blood at 3.0 Tesla. Magn Reson Med 2004;52(3):679-682.
8. Zhao JM, Clingman CS, Narvainen MJ, Kauppinen RA, van Zijl PCM. Oxygenation and Hematocrit dependence of transverse relaxation rates of blood at 3T. Magn Reson Med 2007;58(3):592-597.
9. Wansapura JP, Holland SK, Dunn RS, Ball WS. NMR relaxation times in the human brain at 3.0 Tesla. J Magn Reson Imaging 1999;9(4):531-538.
10. Stanisz GJ, Odrobina EE, Pun J, Escaravage M, Graham SJ, Bronskill MJ, Henkelman RM. T1, T2 relaxation and magnetization transfer in tissue at 3T. Magn Reson Med 2005;54(3):507-512.
11.
Heule
R, Ganter C, Bieri O. Triple echo steady-state (TESS) relaxometry. Magn Reson
Med 2014;71(1):230-237.
Figures