3764
fMRI signal oscillations in rats can be induced by electric paw stimulation but do not deteriorate the observed BOLD peak1Translational Research Imaging Center (TRIC), University Hospital Muenster, Muenster, Germany
Synopsis
Signal time courses of BOLD fMRI measurements in rodents often show a damped oscillation which may superimpose with the expected hemodynamic response. In order to explore and characterize these oscillations, we performed EPI-BOLD measurements with high temporal resolution upon electrical paw stimulation. 55 % of the measurements showed oscillations with a frequency of 0.2 Hz. We could verify that these oscillations were induced by stimulation but did not affect the BOLD response. Consequently, hemodynamic response function models for statistical analysis are valid independently from the occurrence of oscillations.
Introduction
It has been described previously that arterial vasodilation can create a damped oscillation of blood flow1. These fluctuations can cause oscillations in a T2* weighted MR signal. Together with other physiological oscillations and periodic signal fluctuations caused by aliasing2, these may superimpose the BOLD response in fMRI measurements. Models for analysis of the BOLD response usually ignore such signal fluctuations, and may therefore be prone to producing false results. To characterize the occurrence and shape of these oscillations, we have performed fMRI measurements with a high temporal resolution of 100 ms upon electrical paw stimulation.Methods
Experiments
were performed on ventilated Fischer rats (n = 12) under medetomidine sedation
at 9.4 T with single-shot GE-EPI (TE: 18
ms, matrix : 80 x 80, FOV: 26 mm x 28 mm,
slice thickness: 1.2 mm) upon electrical paw stimulation (9 Hz, 1 ms-pulses,
1.5 mA). First, measurements with a TR of 1 s and 9 contiguous slices were
acquired to determine the slice with the largest activation. The following measurements
were performed in this slice with a TR of 100 ms. Three stimulation paradigms were
used: 4 s ON, 16 s OFF; 5 s ON, 20 s OFF and 10 s ON, 30 s OFF. Paradigms were
repeated at least 9 times per measurement.
To average out long-term periodic effects, we performed further measurements
with these stimulation paradigms and added delays of random length (0 s – 5 s) between
repetitions of the basic paradigm the stimulation periods.
Using MATLAB, a voxel wise U-test determined whether the signal during
stimulation and rest period differed significantly for the entire S1 region of
the activated side of the brain. Time courses of the BOLD response were
calculated by summing up the signal of all voxels, which showed a significant
and positive signal change, and averaging over all stimulation cycles. Only
measurements with more than four significant, positive voxels were used for the
further analysis.
When
a time course showed oscillation, a damped oscillation h(t) was fitted to the
obtained signal according to: $$h(t) = -A \cdot e^{-ct} \cdot \cos(2 \pi ft) + b$$
The first minimum after the positive BOLD response (i.e. the undershoot)
was defined as starting point for each fit. Resulting oscillation frequencies f were compared for different
stimulation conditions using a U-test.
Additionally, time courses were filtered using the zero-phase digital filtering
function of MATLAB with a cut off frequency of 0.5 Hz, and cropped from start
of stimulation until five seconds after end of stimulation to obtain BOLD
peaks. BOLD peaks for data sets with and without detected oscillations were
compared using a customized functional t-test3, for the three
different stimulation lengths separately.
Results and Discussion
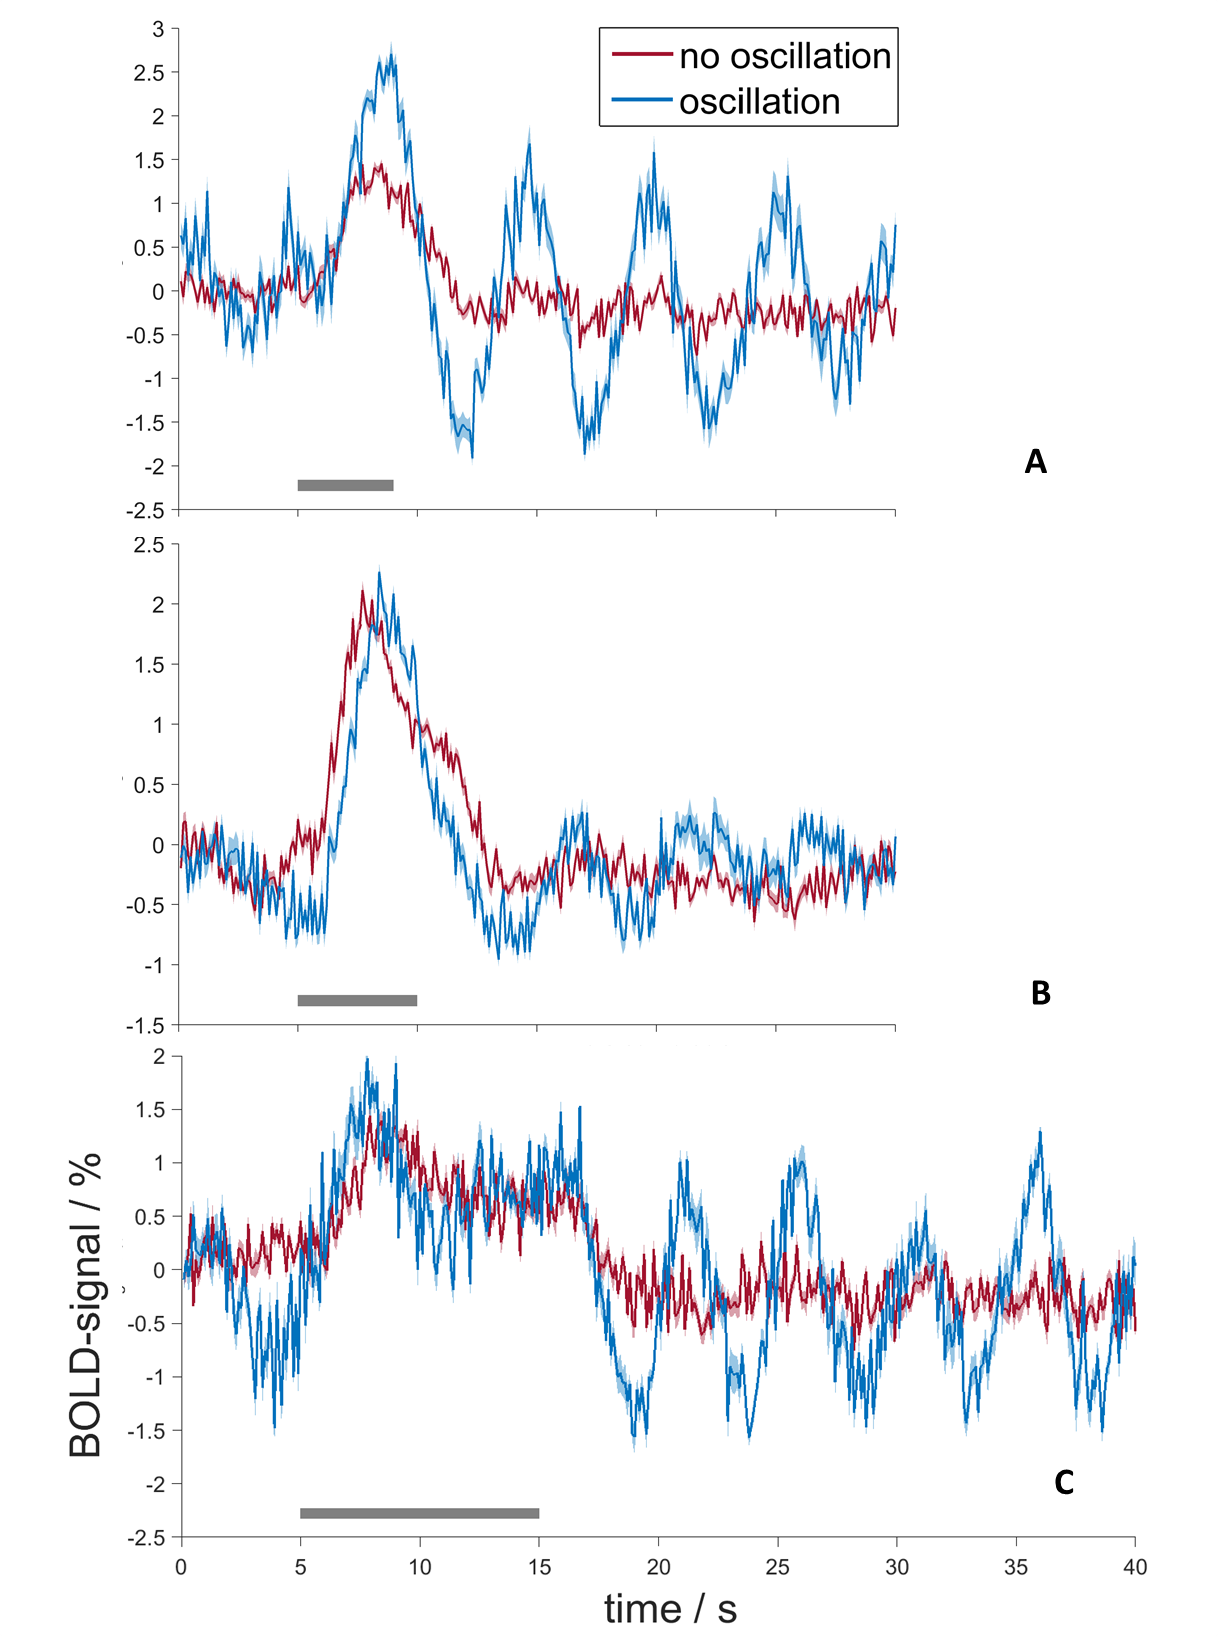
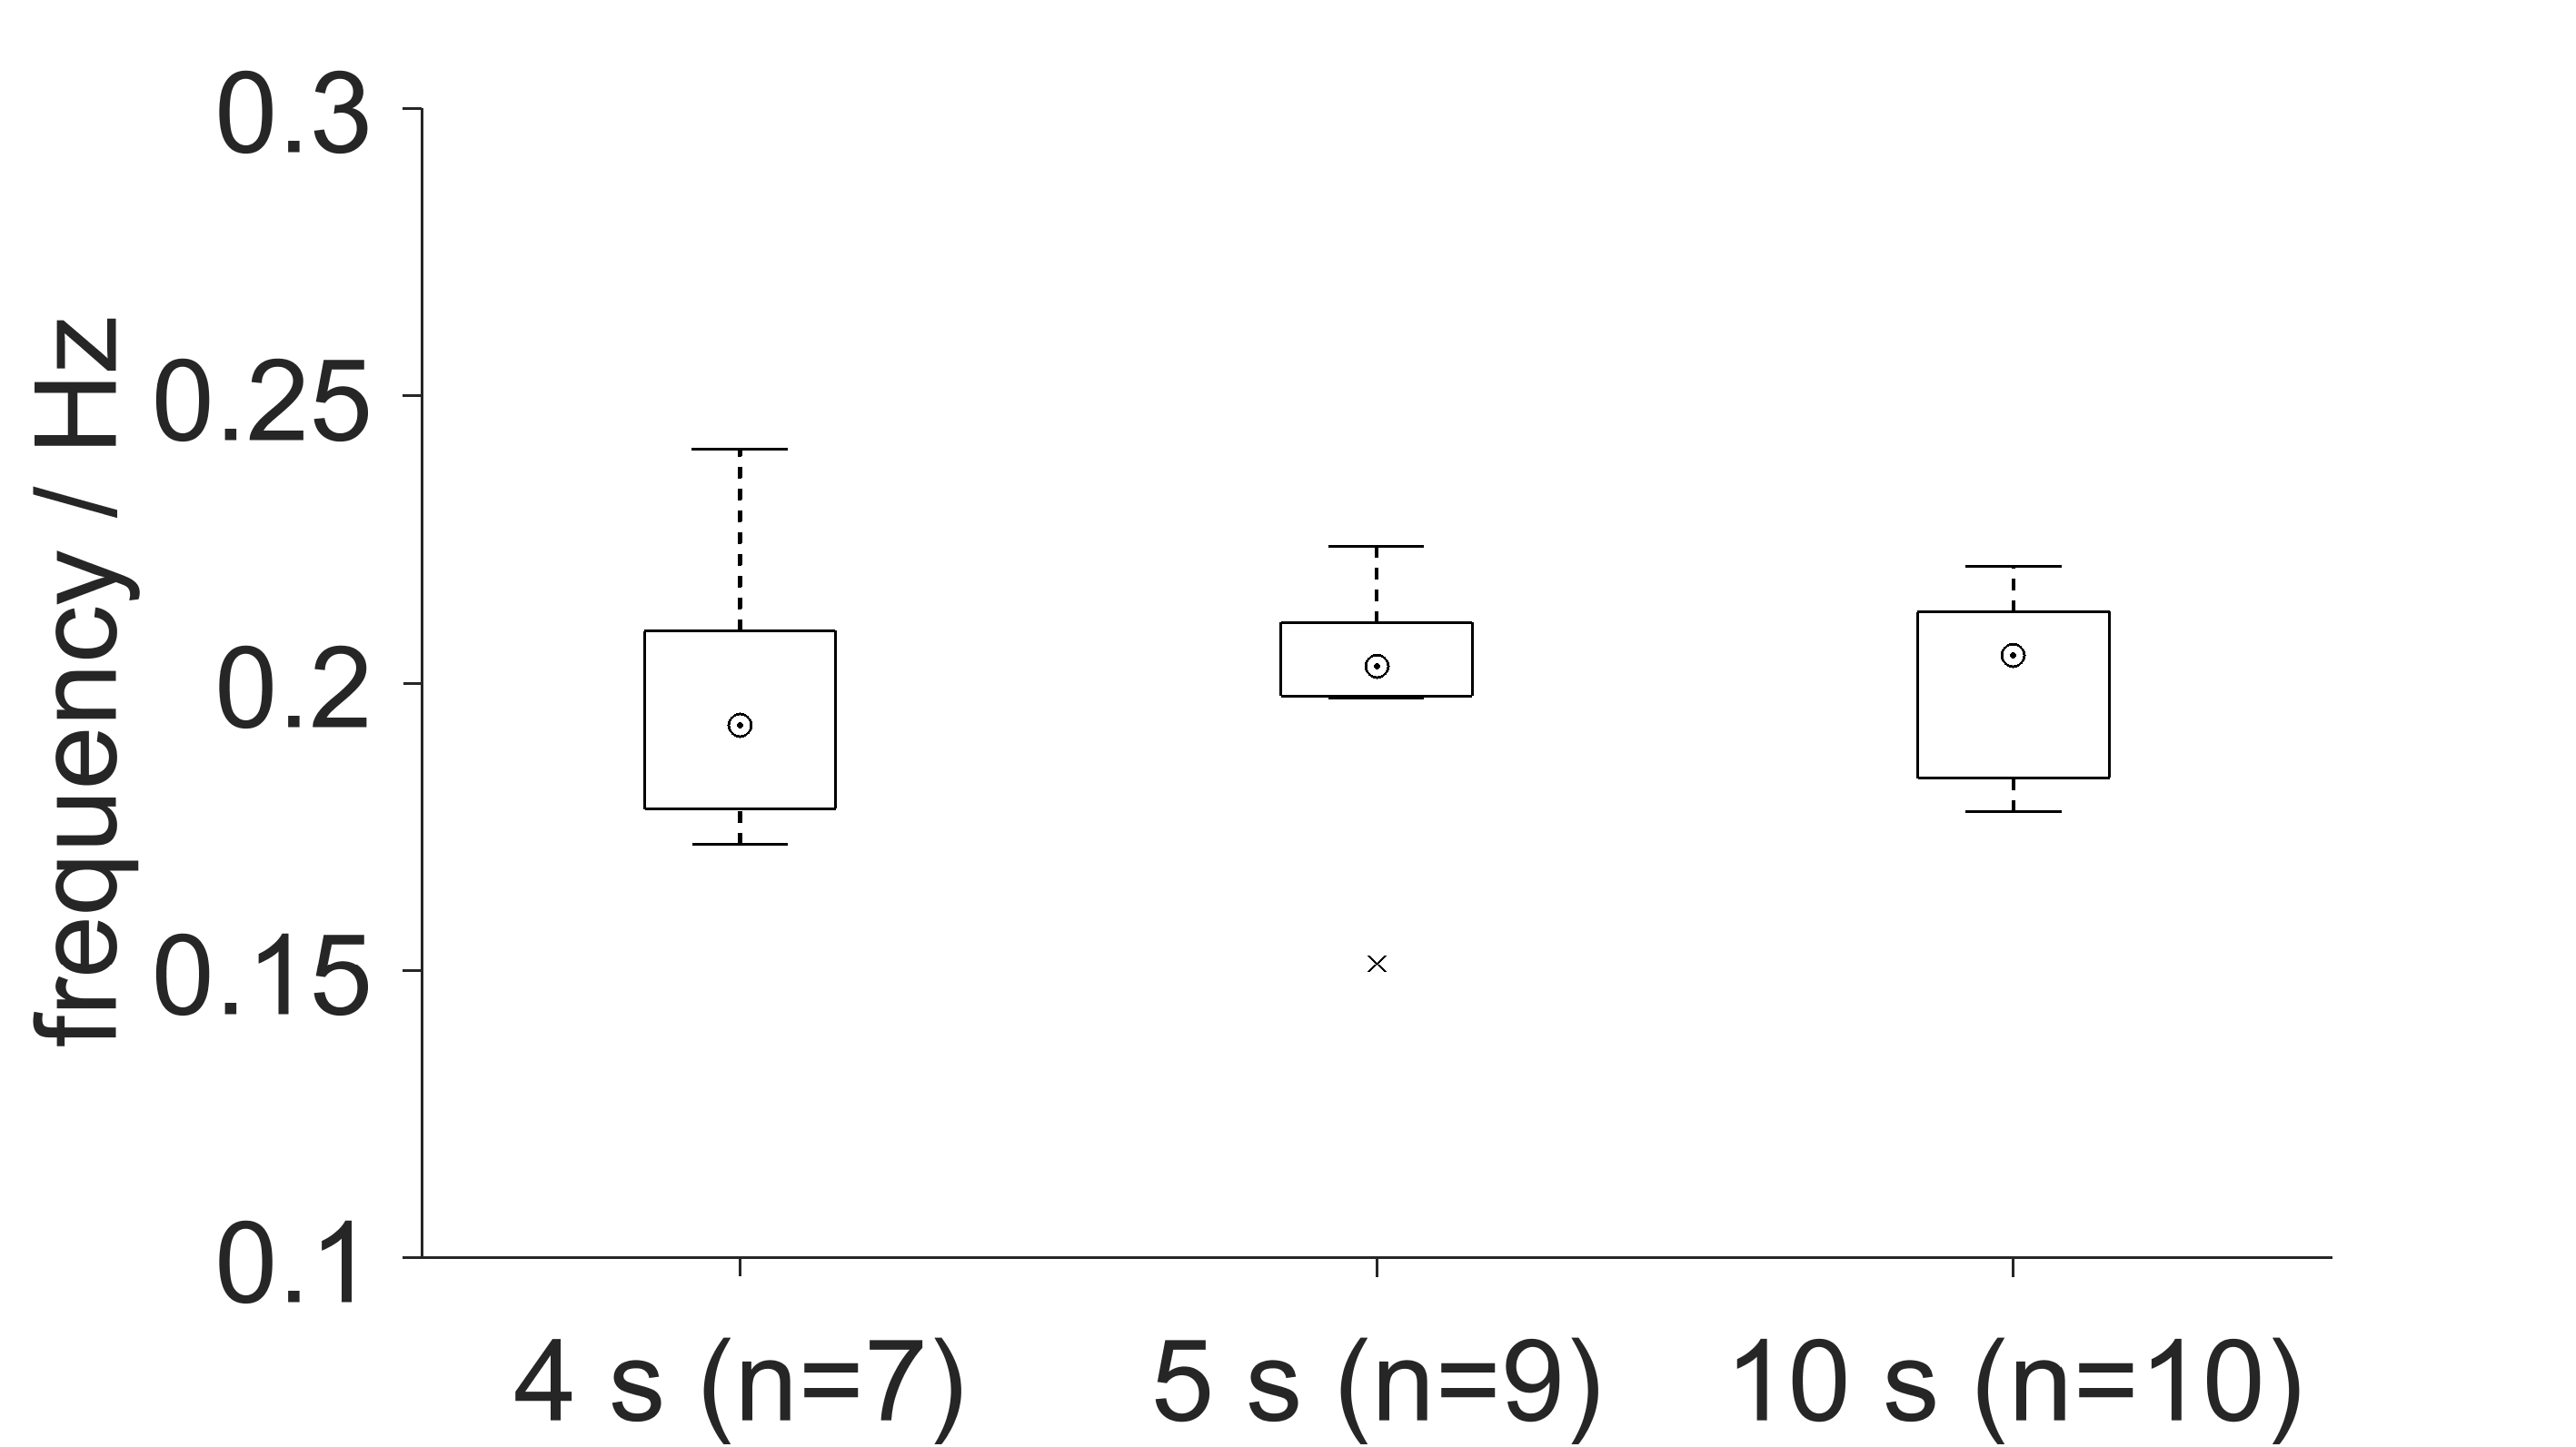
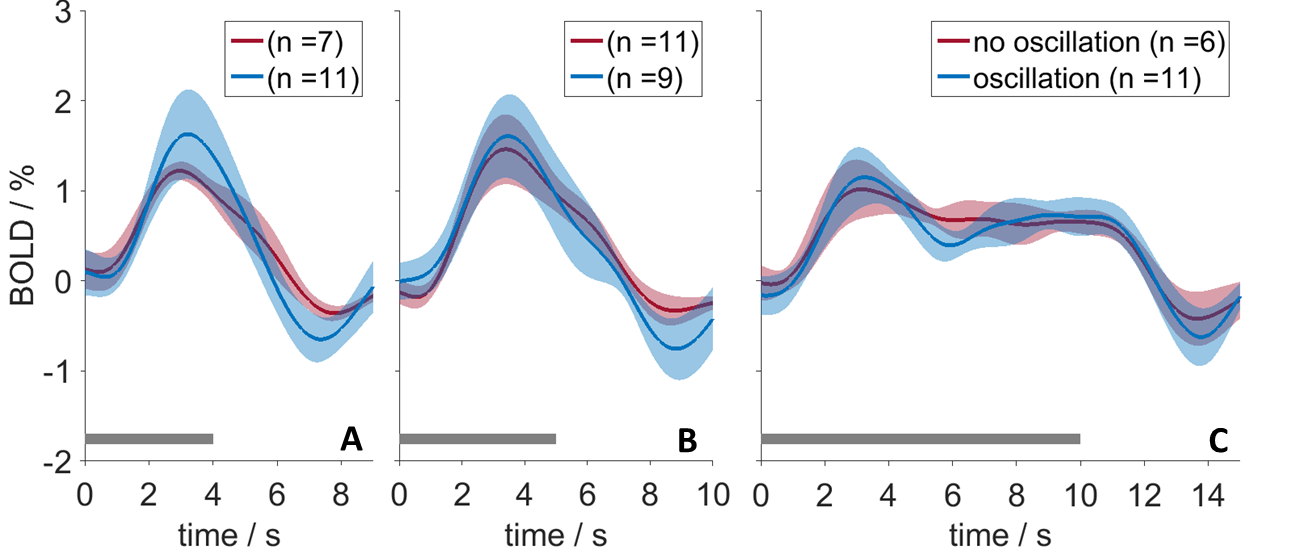
55 % of the measurements (n=60) showed periodic signal oscillations upon electrical paw stimulation. Figure 1 depicts representative measurements with and without oscillation detected, for each stimulation length used. Out of the total of 33 time courses with oscillations, 26 could be fitted successfully. The mean frequency of these oscillations was highly reproducible f=(0.20±0.02) Hz, and did not differ for different stimulation lengths (Figure 2). To exclude long-term periodic fluctuations as sole source of the oscillations, measurements (n=20) with random delays between the stimulation periods were analyzed separately. In 60 % of these measurements signal oscillations were observed, showing that oscillations were indeed induced by stimulation. Since these oscillatory signal fluctuations are of the same amplitude as the observed BOLD response, the starting point of the oscillation is crucial. A simultaneous onset of signal oscillations with the BOLD response may result in severe interference of both signal alterations. Errors in signal analysis may occur, if neglecting the contribution of signal oscillations. We therefore compared BOLD profiles for measurements with and without oscillation. No significant differences were observed at any of the stimulation lengths used (Figure 3), indicating a start of the oscillations only after end of the stimulation period. Also the observation that the oscillation frequency was independent of stimulation length corroborates the notion that the starting point is rather termination of the stimulation period.Conclusion
In 50 % of our measurements, electrical paw stimulation gave rise to signal oscillations with a defined frequency of 0.2 Hz in addition to the BOLD response. However, the BOLD response of measurements with oscillation showed no significant difference from those without oscillation. This indicates that the oscillations start after end of the stimulation period. Consequently, conventional fMRI analysis methods are valid independent from the occurrence of oscillations. However, further investigation into starting point and mechanism of these signal oscillations is warranted.Acknowledgements
No acknowledgement found.References
1. Kim JH, Ress D. Arterial impulse model for the BOLD response to brief neural activation. NeuroImage 2016;124:394-408
2. Pais-Roldán P, Biswal B, Scheffler K, et al. Identifying Respiration-Related Aliasing Artifacts in the Rodent Resting-State fMRI. Front. Neurosci. 2018; doi:10.3389/fnins.2018.00788.
3. Ramsay, J., Hooker, G., Spencer, G., 2009. Functional Data Analysis with R and MATLAB, 1st ed. Springer, Dordrecht, Heidelberg, London, New York.
Figures