3763
Laminar fMRI with T2-prepared multi-echo FLASH1Erwin L. Hahn Institute for Magnetic Resonance Imaging, University of Duisburg-Essen, Essen, Germany, 2High Field and Hybrid MR Imaging, University Hospital Essen, University of Duisburg-Essen, Essen, Germany
Synopsis
Examining signal changes at the level of cortical layers using T2*-weighted fMRI suffers from a systematic bias caused by extravascular effects of draining veins. T2-weighting promises higher specificity to signal changes near the origin of neural activity. In this work, we use a T2-prepared, multi-echo FLASH sequence at 7 T in a flickering checkerboard experiment targeting the visual cortex to investigate the feasibility of this sequence for laminar fMRI. The layer profiles indicate the desired T2-weighted response in grey matter, but also a peak at the pial surface likely caused by intravascular effects in the pial veins.
Introductions
T2-prepared sequences have recently been proposed as an alternative for SE-EPI to perform T2-weighted fMRI1 with the aim to reduce unwanted T2' weighting, which is detrimental for the effective resolution of laminar fMRI as it enhances sensitivity to draining vein effects. Here we present our first findings of a T2-prepared multi-echo FLASH sequence used for laminar fMRI.Methods
The echo time of the T2-prep module was 50 ms for optimal sensitivity in GM (T2=50ms @ 7 T). This module attenuates the longitudinal magnetisation that is available for the FLASH readout following it. As venous blood has a very short T22 (non-stimulated condition: oxygenation level (Y)=60%, T2=8ms; active condition: Y=70%, T2=13.5ms), the blood signal is expected to be close to fully attenuated by the T2-prep module (exp(-50/13.5) = 2%). As the FLASH multi-echo readout has TEs ranging from 2.6ms to 8.8ms, the extravascular contribution is expected to be attenuated as well, to approximately 25%-60% of its maximum response at TE=T2*GM=30ms. Taken together, the expectation is that the T2-weighting maximises sensitivity to capillary changes in GM, whilst suppressing/attenuating unwanted venous effects. Experiments were performed on a 7T Siemens scanner with a 32ch head coil. A 256x256x32 matrix was acquired per echo, TEs were: 2.88ms, 4.84ms, 6.8ms, and 8.76ms. TR was 11.2ms. We used an undersampling factor of 8 in the phase-encode dimension, but shifted the sampling patterns of the echoes w.r.t. each other to aid the joint reconstruction process3. This method uses all echoes to inform the reconstruction of a single one resulting in lower g-factors. Given the additional phase-encoding between echoes, one could argue this is 32-fold segmented EPI, but as the echoes are individually reconstructed, the FLASH designation seems more appropriate. The volume TR was 11.4 seconds. As T1 relaxation would certainly nullify the T2 preparation over such a long time, 8-fold segmentation was applied, resulting in 1.42 seconds of acquisition time per segment. To futher reduce T1-relaxation artefacts, the encoding was performed centre-out. Activity was induced using a flashing checkerboard in a 40-minute run in a single subject. Structural data (mp-rage) were processed in FreeSurfer to be able to perform cortical depth sampling in the functional data. Standard fMRI processing steps (registration, temporal filtering, etc.) were carried out using SPM12.Results
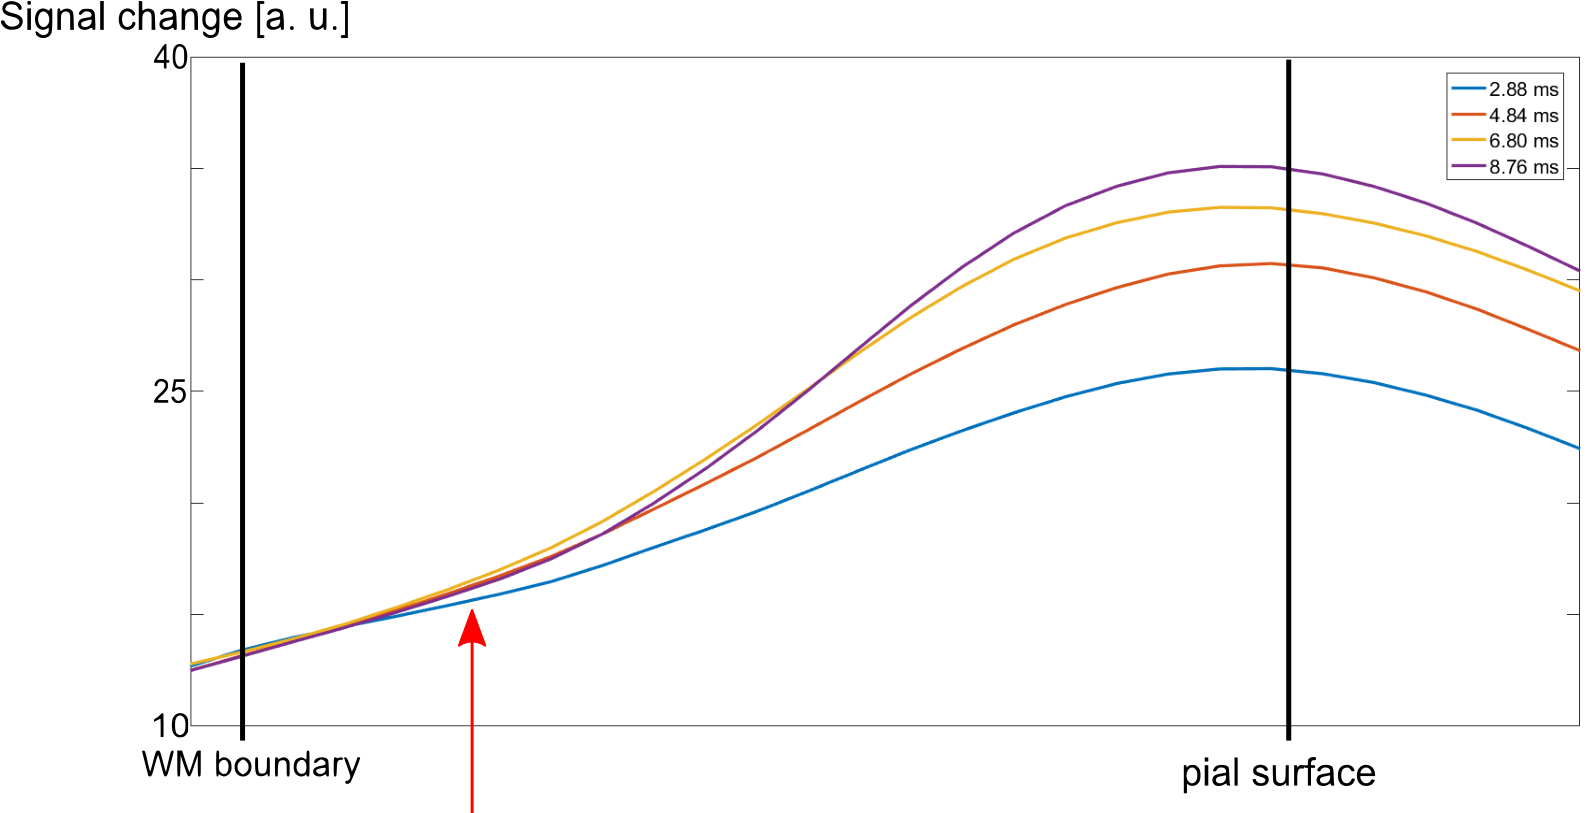
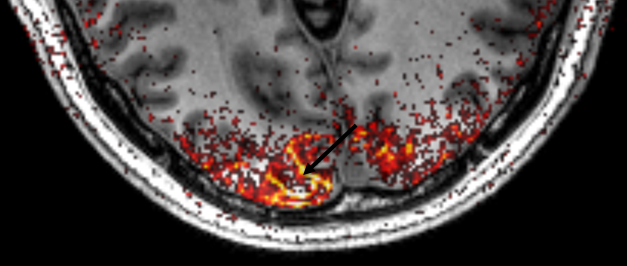
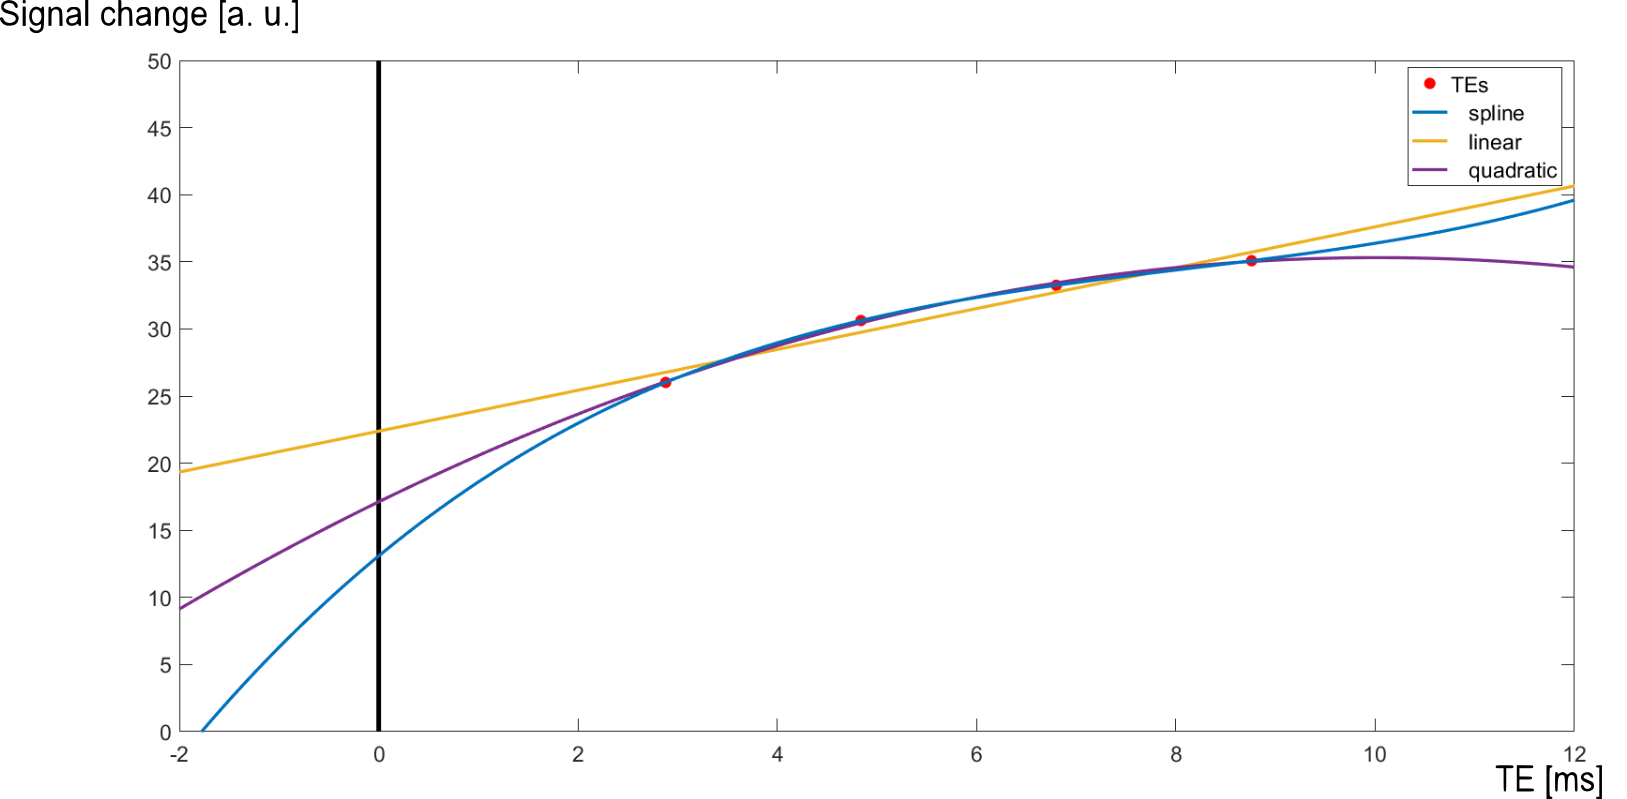
The laminar profiles of 'Checkerboard ON-OFF' are shown in fig. 1 for the four echoes. We discuss two noteworthy points here: 1) Deep in GM (red arrow in fig 1), the activity is relatively independent of TE. An extravascular effect (caused by pial/ascending veins) would have shown an approximately linear increase with TE (the 25-60% trend mentioned in Methods), but this is absent. Instead, the signal change is likely due to GM-T2 changes, which is the goal of T2-prep fMRI. 2) There is a very large signal change at the pial surface, which seems to be caused by veins as shown in the overlay image fig 2. Multiple mechanisms could perhaps explain this: (A) An extravascular effect in CSF. The diffusion in CSF is much larger than in tissue and therefore the regime in which dephasing is still considered dynamic is much wider. However at TE=0, the change should be zero, and even very liberal curve fits (shown in fig. 3) are not able to intersect the y-axis anywhere near 0. (the theoretical fit "d(signal)/dR2*" is not shown as it resulted in nonsense) (B) T1-relaxation could cause venous blood signal to reappear during the FLASH readout, which would then result in high T2*-weighted intravascular signal changes (despite the centre-out encoding). However, here too, the extrapolation through the origin seems unlikely. (C) Blood T2 in an activated state could be much higher than expected. In this case, there is a difference in ON vs OFF, prior to the FLASH readout resulting in the y-axis offset that was missing in (B).Discussion
The results suggest that intravascular signal change contributions are present in T2-prep FLASH data, probably due to elongated blood T2 during activity. In ascending veins this would result to blurring of laminar profiles, which would be hard to address with standard sequence improvements (e.g. increasing resolution). In pial veins, the impact would be limited to partial volume effects with superficial layers, and higher resolutions would help. In deeper GM, the desired T2-weighted signal changes are seen, with little evidence of extravascular effects of pial vessels. Next steps include using T2-prep-ME-FLASH to study the contributions of ascending intracortical veins in laminar fMRI.Acknowledgements
This work was funded by DFG grant KO5341/1-1.References
1. J. Hua et al.: Whole-Brain Three-Dimensional T2-Weighted BOLD Functional Magnetic Resonance Imaging at 7 Tesla. MRM. 72: 1530 - 40 (2014).
2. K. Uludag et al.: An integrative model for neuronal activity-induced signal changes for gradient and spin echo functional imaging. NeuroImage 48: 150 - 65 (2009)
3. B. Bilgic et al.: Improving Parallel Imaging by Jointly Reconstructing Multi-Contrast Data. Proc. MRM. 80: 619 - 32 (2018).
Figures