3762
BOLD-fMRI Using a 3D Ultrafast Gradient-echo-based Sequence Using Quadratic-phase Encoding (RASE-II) in Comparison with 2D and 3D EPI1Center for Neuroscience Imaging Research, Institute for Basic Science, Suwon, Korea, Republic of, 2Department of Biomedical Engineering, Sungkyunkwan University, Suwon, Korea, Republic of
Synopsis
We
recently introduced a novel ultrafast 3D gradient-echo-based
imaging technique using spatio-temporal encoding (SPEN) or quadratic-phase
encoding, which were dubbed RASE-I
and -II (Rapid Acquisition with Sequential Excitation). RASE has less sensitivity to field
inhomogeneities and susceptibility differences compared to conventional gradient-echo EPI (GE-EPI), sharing the
advantages of 3D imaging such as high signal-to-noise ratio and high spatial
resolution. In this study, we present promising results of RASE-II fMRI, i.e.,
better t-scores, tSNR than conventional 2D and 3D GE-EPI, on a 9.4-T animal
scanner.
Purpose
We recently introduced two
versions of a novel ultrafast 3D gradient-echo-based
imaging technique using spatio-temporal encoding (SPEN)1,2, or quadratic-phase
encoding, which were dubbed RASE-I and -II (Rapid Acquisition with Sequential
Excitation). RASE not only provides high immunity to field inhomogeneities including
susceptibility differences, but also shares the
advantages of 3D imaging such as high SNR with high spatial resolution. Especially,
RASE-II provides constant TE across
an object to be imaged. We previously reported the preliminary result of RASE-fMRI where RASE-II provided better tSNR, t-score maps, and BLOD percent-signal-change than conventional 2D GE-EPI3. Although it was very promising, the previous result had a critical
weakness of using a single rat. So, we tested RASE-fMRI again in a group of
rats, especially comparing it with both 2D and 3D GE-EPI fMRI this time. It turned out that RASE-II provides better tSNR than both 2D and 3D GE-EPI fMRI, intermediate SNR between them, similar BOLD percent-signal-changes
to them, showing that our previous result overestimated the percent-signal-changes
and t-score.Method
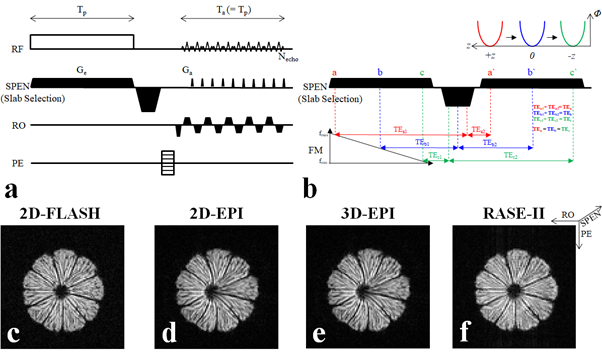
Sequence: Figure1 illustrates the RASE-II sequence diagram (a) and schematic representation of its sequential and local excitation and rephasing mechanism in SPEN direction (b). In RASE-II, spin excitation and data acquisition are performed with the same duration and, between them, a rephasing gradient is applied to make all the spins experience constant TE. We already described the features of the RASE-II sequence in detail in the previous reports2.
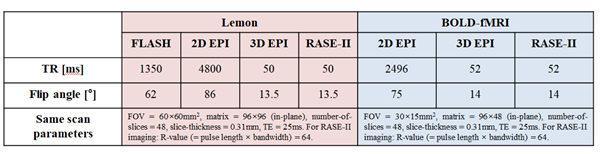
Lemon imaging: To demonstrate the robustness against B0-inhomogeneities, high-resolution lemon imaging was performed using 2D-FLASH (c), 2D-EPI (d), 3D-EPI (e) and RASE-II (f) for comparison purposes. Scan parameters were summarized in Table1.
BOLD-fMRI: RASE-II fMRI were compared with 2D-EPI (Group_1) and 3D-EPI (Group_2) fMRI using 5 rats (male Sprague-Dawley rats aged 7-8 weeks and weighing 270~300g), respectively, and 7 trials were performed on each rat at 9.4T (Bruker-BioSpec, 94/30 US/R) and averaged to calculate tSNR and SNR. Rat was initially anesthetized with 4% isoflurane in a mixture of oxygen and air gases (1:9) and 2.5% during surgical preparation. After surgery, isoflurane was discontinued and a-chloralose was injected (40mg/kg/90min). Two-needle electrodes were inserted into a left forepaw to induce the electrical-stimulus pulses (333.0-ms pulse width and 1.5-mA current) at a frequency of 3 Hz. Each trial consisted of three consecutive periods: resting(49.92s;20volumes)-stimulation(19.97s;8volumes)-resting(49.92s;20volumes). Scan parameters were summarized in Table1. Images were reconstructed offline with MATLAB(ver.8.2.0; R2013b) using the super-resolution (SR) algorithm along the SPEN direction4.
Results
Lemon imaging: Figure1 shows the high-resolution lemon images from 2D-FLASH (1c), 2D/3D-EPI (1d, 1e) and RASE-II (1f). Due to desirable degree of immunity to field inhomogeneity, RASE-II provided better image quality than EPI with less distortion and signal loss, especially in centered seed regions that experience large susceptibility differences.
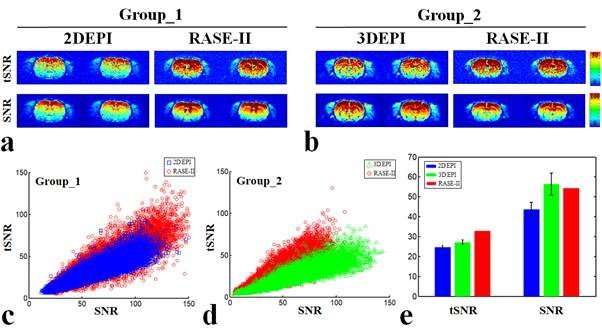
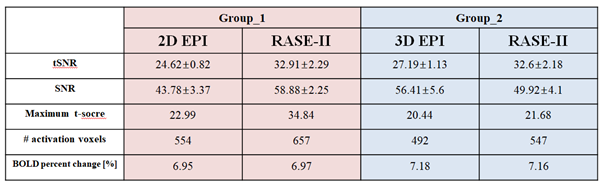
fMRI experiments: Figure2 shows tSNR and SNR maps from 2D/3D-EPI (a-left, b-left) and RASE-II (a-right, b-right) on the somatosensory area. As shown in Figs.2c-e where total voxel values of tSNR and SNR were plotted, RASE-II provided overall better tSNR than 2D- and 3D-EPI, whereas it provided intermediate SNR between 2D- and 3D-EPI. Mean values of tSNR/SNR in Group_1 and 2 were summarized in Table2. For better representation of relative comparison among three methods (Fig.2e), 2D- and 3D-EPI data in each group were normalized with respect to the mean tSNR/SNR values (=32.76/54.4) of RASE-II.
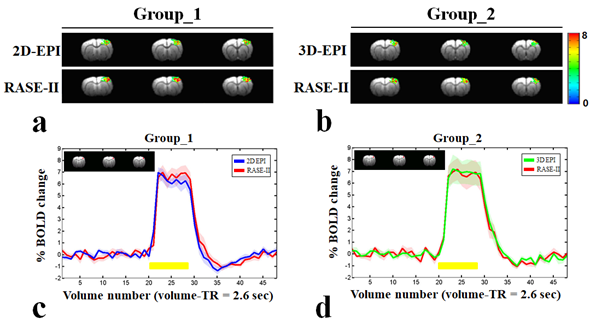
Fgiure3 shows total averaged t-score maps (≥ 3) of BOLD activation in Group_1 (a) and Group_2 (b). The maximum t-score and number of activation voxels were presented in Table2. BOLD percent-signal-changes calculated in the same ROI (33-voxels, subfigures) did not show a significant difference among three methods, implying that RASE-II fMRI belongs to gradient-echo fMRI.
Discussion & Conclusion
Here RASE-II, which is an
ultrafast 3D gradient-echo-based sequence with constant TE, was used for fMRI
in comparison with 2D/3D EPI and showed better tSNR than both of them,
intermediate SNR between them, and similar BOLD percent-signal-changes. These results
might be understood in the following respects: 1) RASE-II provides better SNR
and thereby tSNR than 2D-EPI since it is basically 3D imaging of high
resolution in which thermal noise is dominant over physiological noises. 2) Due
to the quadratic-phase encoding with partial-Fourier reconstruction, RASE-II seems
to have an intrinsic characteristic between 2D and 3D imaging. Thus, it not
only provides intermediate SNR between 2D and 3D-EPI, but it also makes RASE-II
less sensitive to physiological noises than 3D-EPI. 3) The fact that all spins
experience constant TE in RASE-II might also partly contribute to enhancing t-scores
when an optimal TE is used to maximize BOLD effects.Acknowledgements
This work was supported by IBS-R015-D1.References
[1] Ryu JK, et al. A new ultrafast 3D gradient-echo magnetic resonance imaging method: RASE-I. In Proceedings of the 25th Annual Meeting of ISMRM. 2017.
[2] Ryu JK, et al. A new ultrafast 3D gradient-echo-based imaging method: RASE-II. In Proceedings of the 25th Annual Meeting of ISMRM. 2017.
[3] Ryu JK, et al. Enhanced fMRI using a novel 3D ultrafast gradient-echo-based sequence using spatiotemporal encoding. In Proceedings of the 26th Annual Meeting of ISMRM. 2018.
[4] Chen Y, et al. Partial fourier transform reconstruction for single-shot MRI linear frequency-swept excitation. Mag Reson Med. 2013;69:1326-1336.
[5] Poser B.A, et al. Three dimensional echo-planar imaging at 7 Tesla. Neuroimage. 2010;51:261-266.
[6] van der Zwaag w, et al. Temporal SNR characteristics in segmented 3D-EPI at 7T. Mag Reson Med. 2012;67:344-352.
[7] Jin T, et al. Source of nonlinearity in echo-time-dependent BOLD fMRI. Mag Reson Med. 2006;55:1281-1290.
Figures