3761
Correlation between inter-cortical depth hemodynamic responses and oscillatory neuronal responses during music listening1Institute of Biomedical Engineering, National Taiwan University, Taipei, Taiwan, 2National Yang-Ming University, Taipei, Taiwan, 3Neurology Department, Taipei Veterans General Hospital, Taipei, Taiwan, 4Department of Neurosurgery, Taipei Veterans General Hospital, Taipei, Taiwan, 5Department of Medical Biophysics, University of Toronto, Toronto, ON, Canada, 6Department of Neuroscience and Biomedical Engineering, Aalto University, Espoo, Finland
Synopsis
We explored the correlation between cortical depth-specific BOLD signal and oscillatory neuornal activity during music listening using high resolution fMRI data (3T with 1.5 mm isotropic resolution) and stereotactic electroencephalography. Three findings are: first, the hemodynamic responses in human auditory cortex was significantly correlated with neuronal oscillation in high gamma band (40 Hz to 90 Hz). Second, the intermediate cortical depth was more closely related to neuronal oscillation. Third, the neuronal-hemodynamic correlation was higher in core than in noncore region.
INTRODUCTION
The BOLD signal in the human auditory cortex is positively and negatively correlated to gamma and alpha band neuronal oscillations, respectively, during movie watching1. Yet how BOLD signals at different cortical depths are correlated to neuronal signals under naturalistic acoustic stimuli remained unknown. Because of different input-output neuronal connections and vascular distributions across cortical depths, the coupling between BOLD signal and neuronal oscillations is expected to vary across cortical depths. Specifically, with preferential anatomical feed-forward connections to the intermediate cortical depth in the primary sensory region2,3, we hypothesize that the hemodynamic response in intermediate cortical depth is more significantly correlated to neuronal signals than in superficial or deep layers. However, the BOLD signal is biased by vascular density, which is higher at superficial cortical depth1. Thus, the BOLD signal at the superficial layer may be more closely related to neuronal responses.
Cortical-depth dependent fMRI has been studied in the human visual 4-11 and auditory 12-14 cortex. This method improves the specificity fMRI signal by reducing vascular bias caused by draining veins coursing along the pial surface 13,15, partial volume effects 16,17, and physiological noise 18. Here we use cortical-depth dependent fMRI to study the correlation between neuronal oscillations and BOLD signal across cortical depths in human primary auditory cortex under music listening.
METHODS
Sixteen healthy participants joined this study with written informed consents after the approval of the Institute Review Board. All data were acquired on a 3T MRI system (Skyra, Siemens) with a customized 24-channel coil array fitted to the right temporal lobe 19. Structural and functional images were acquired with a 1-mm isotropic resolution MPRAGE and a 1.5-mm isotropic resolution gradient-echo EPI sequence, respectively. Nine cortical surfaces with equally spaced cortical thickness were reconstructed from the structural images using FreeSurfer20,21. Auditory stimulus including three songs (Song 1: “Doraemon” theme song, Song 2: clip of “Brahms Piano Concerto No. 1”, and Song 3: “Lost stars” from Adam Levine). Each participant listened to each song twice in a randomized order. Electrophysiological responses were measured invasively from two epilepsy patients by stereotatic electroenecephalography (sEEG). The locations of electrodes (Ad-Tech Medical Instrument, Oak Creek, WI, USA) were planned solely based on the clinical needs. Each electrode had 6 to 8 contacts, where were separated by 5 mm. Pre-surgery and post-surgery MPRAGE images were obtained from both patients to identify electrode and contacts locations. Both patients gave written informed consents before participating the experiment. The same three songs were presented to each patient, who listened to each song twice in a randomized order. The sEEG data were re-referenced to the average of each electrode. Frequency-specific oscillatory neuronal responses were estimated by first applying the Morlet wavelet (the central frequencies varying between 4 Hz and 150 Hz in steps of 2 Hz and 7-cycle width) to the sEEG time series and then taking the absolute value. The time series filtered with different central frequencies were convolved with a canonical hemodynamic response function to model the BOLD signal. Sperate General Linear Models were used to correlate between frequency-specific sEEG and cortical depth specific fMRI data. We particularly focused our analysis in the core and noncore regions of the auditory cortex, which were mapped previously 19.RESULTS
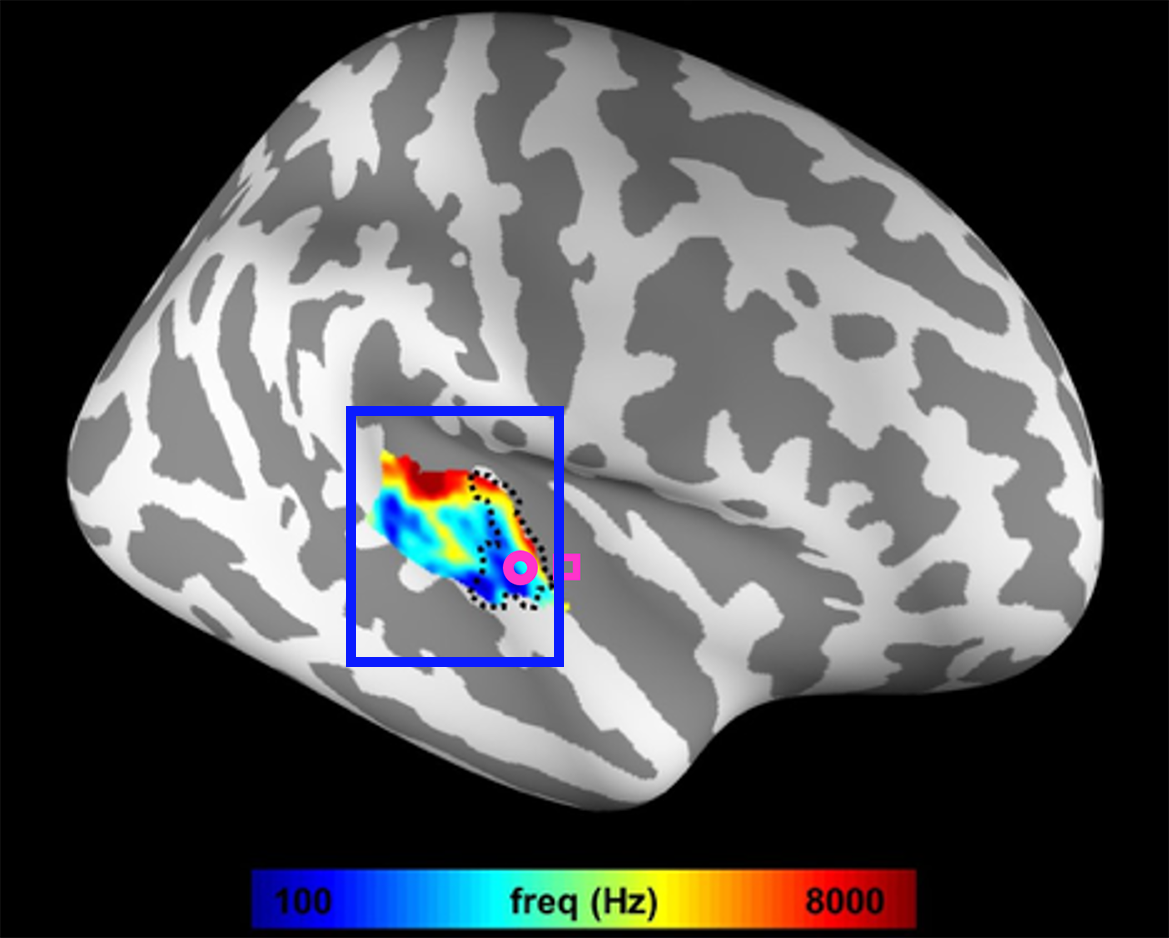
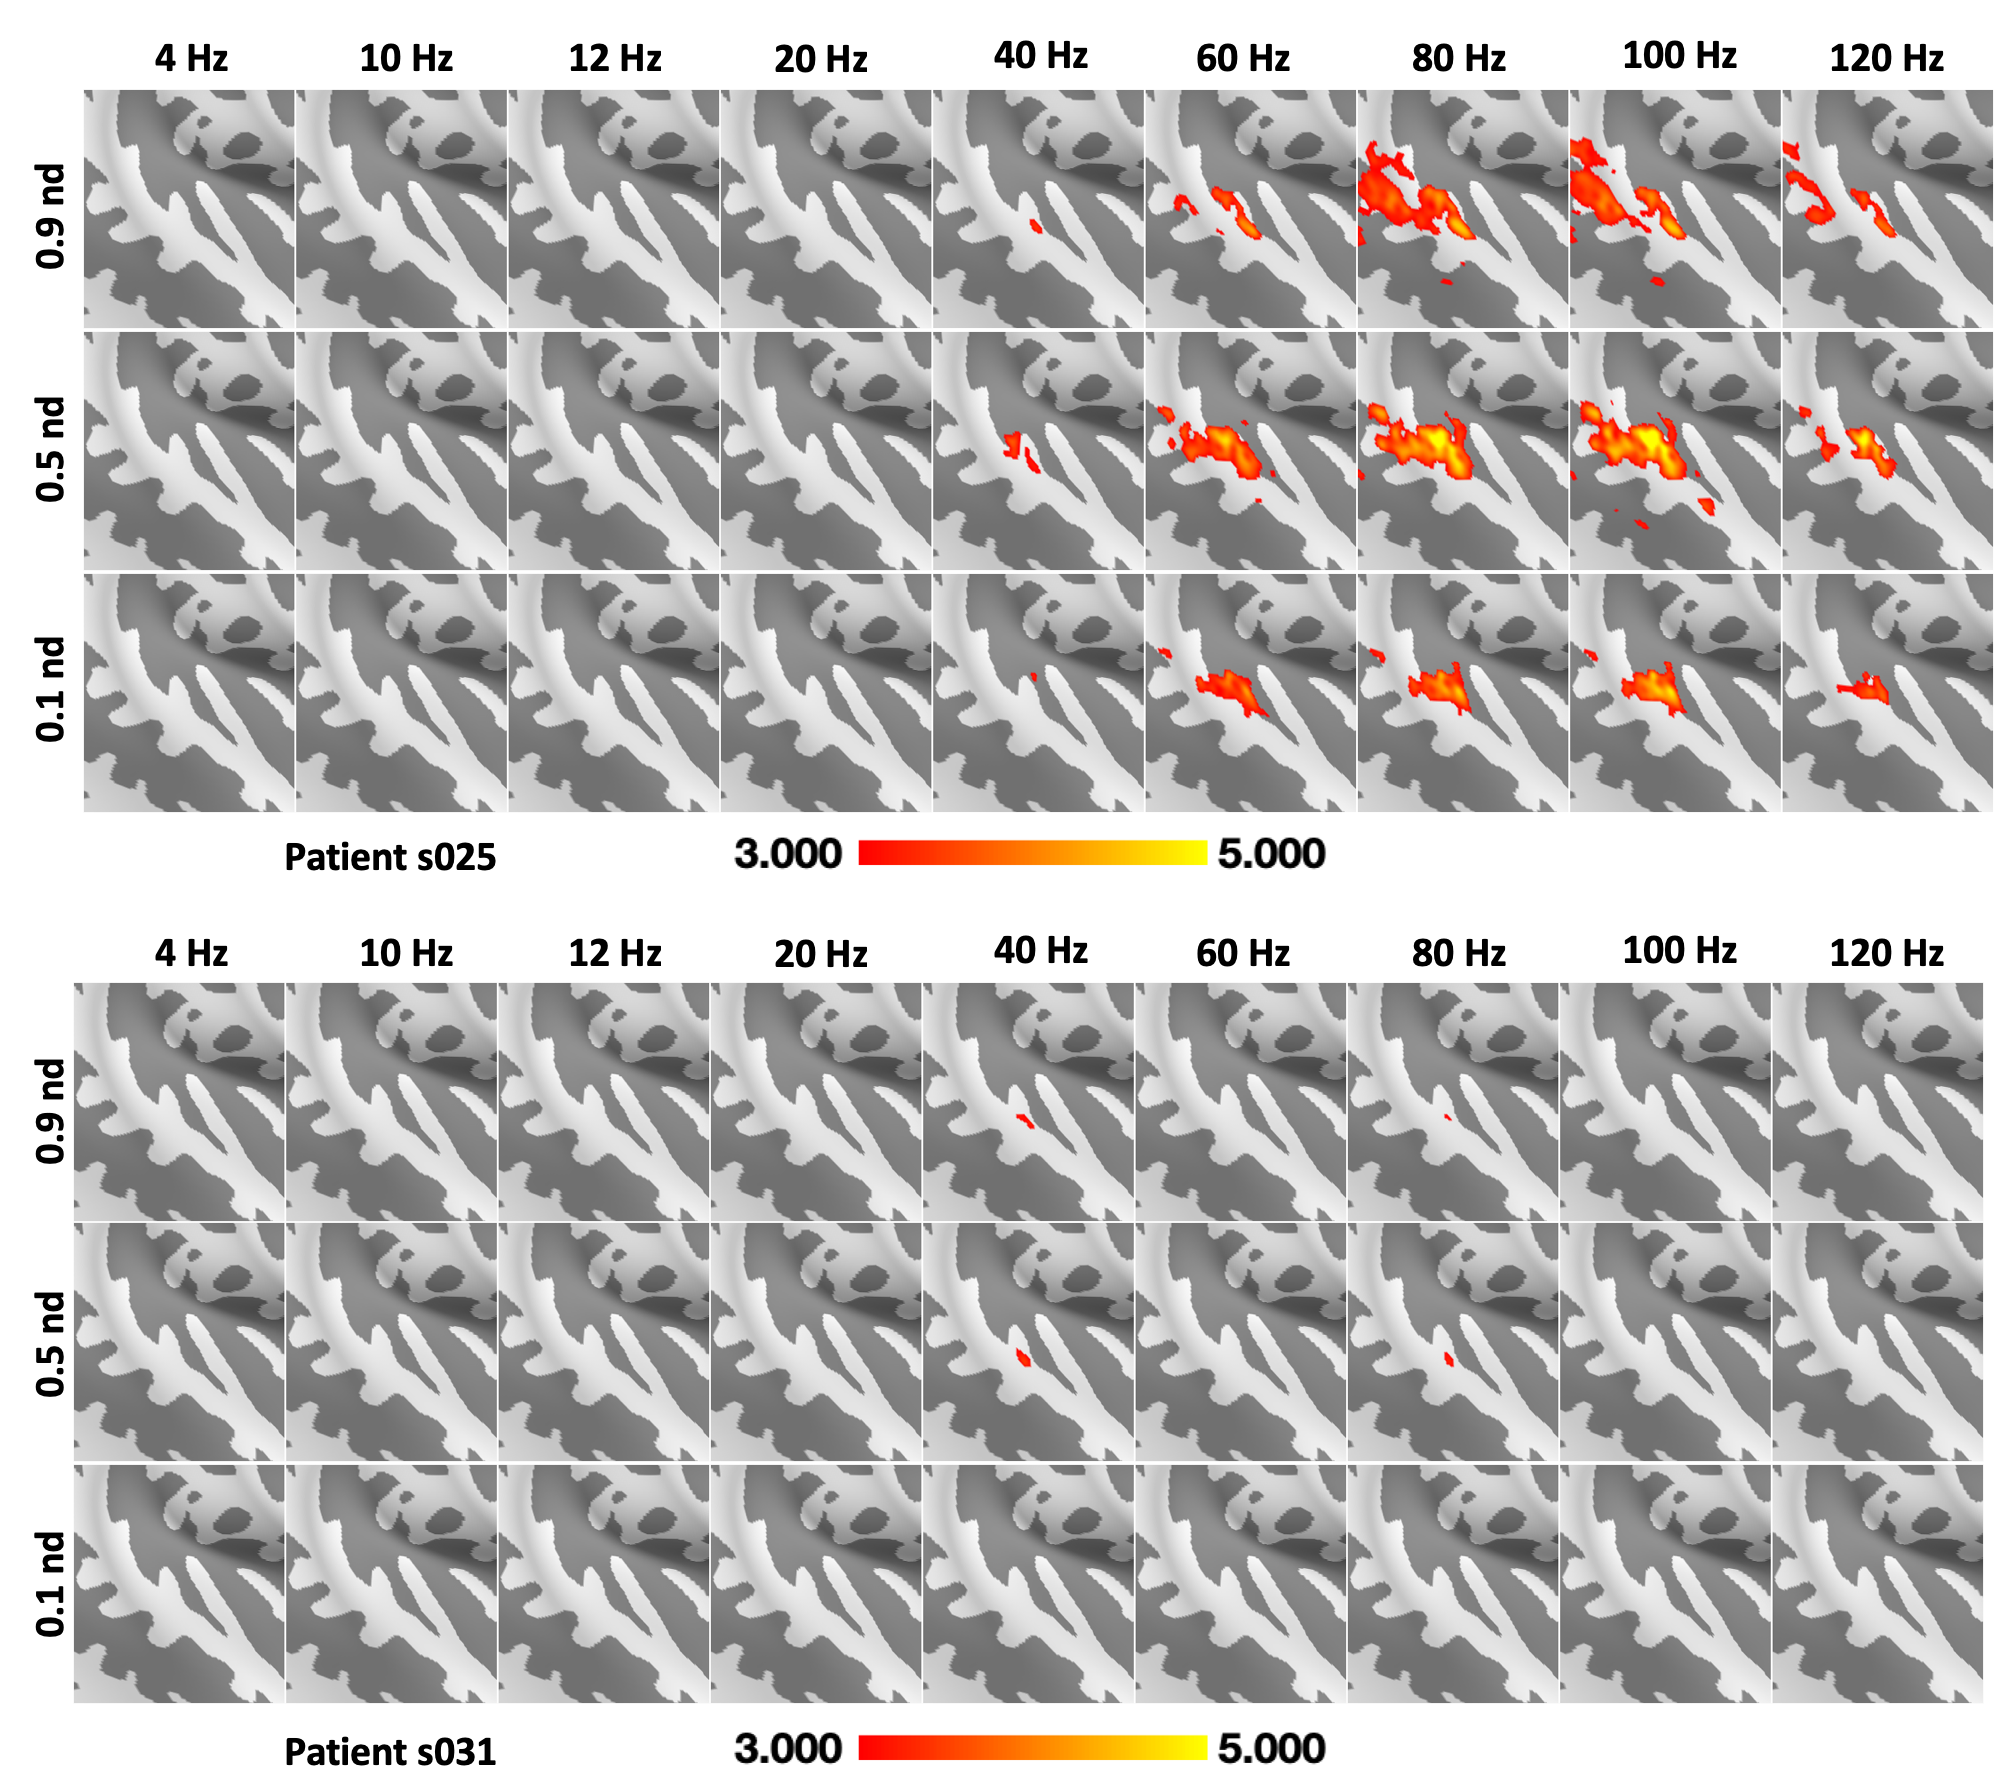
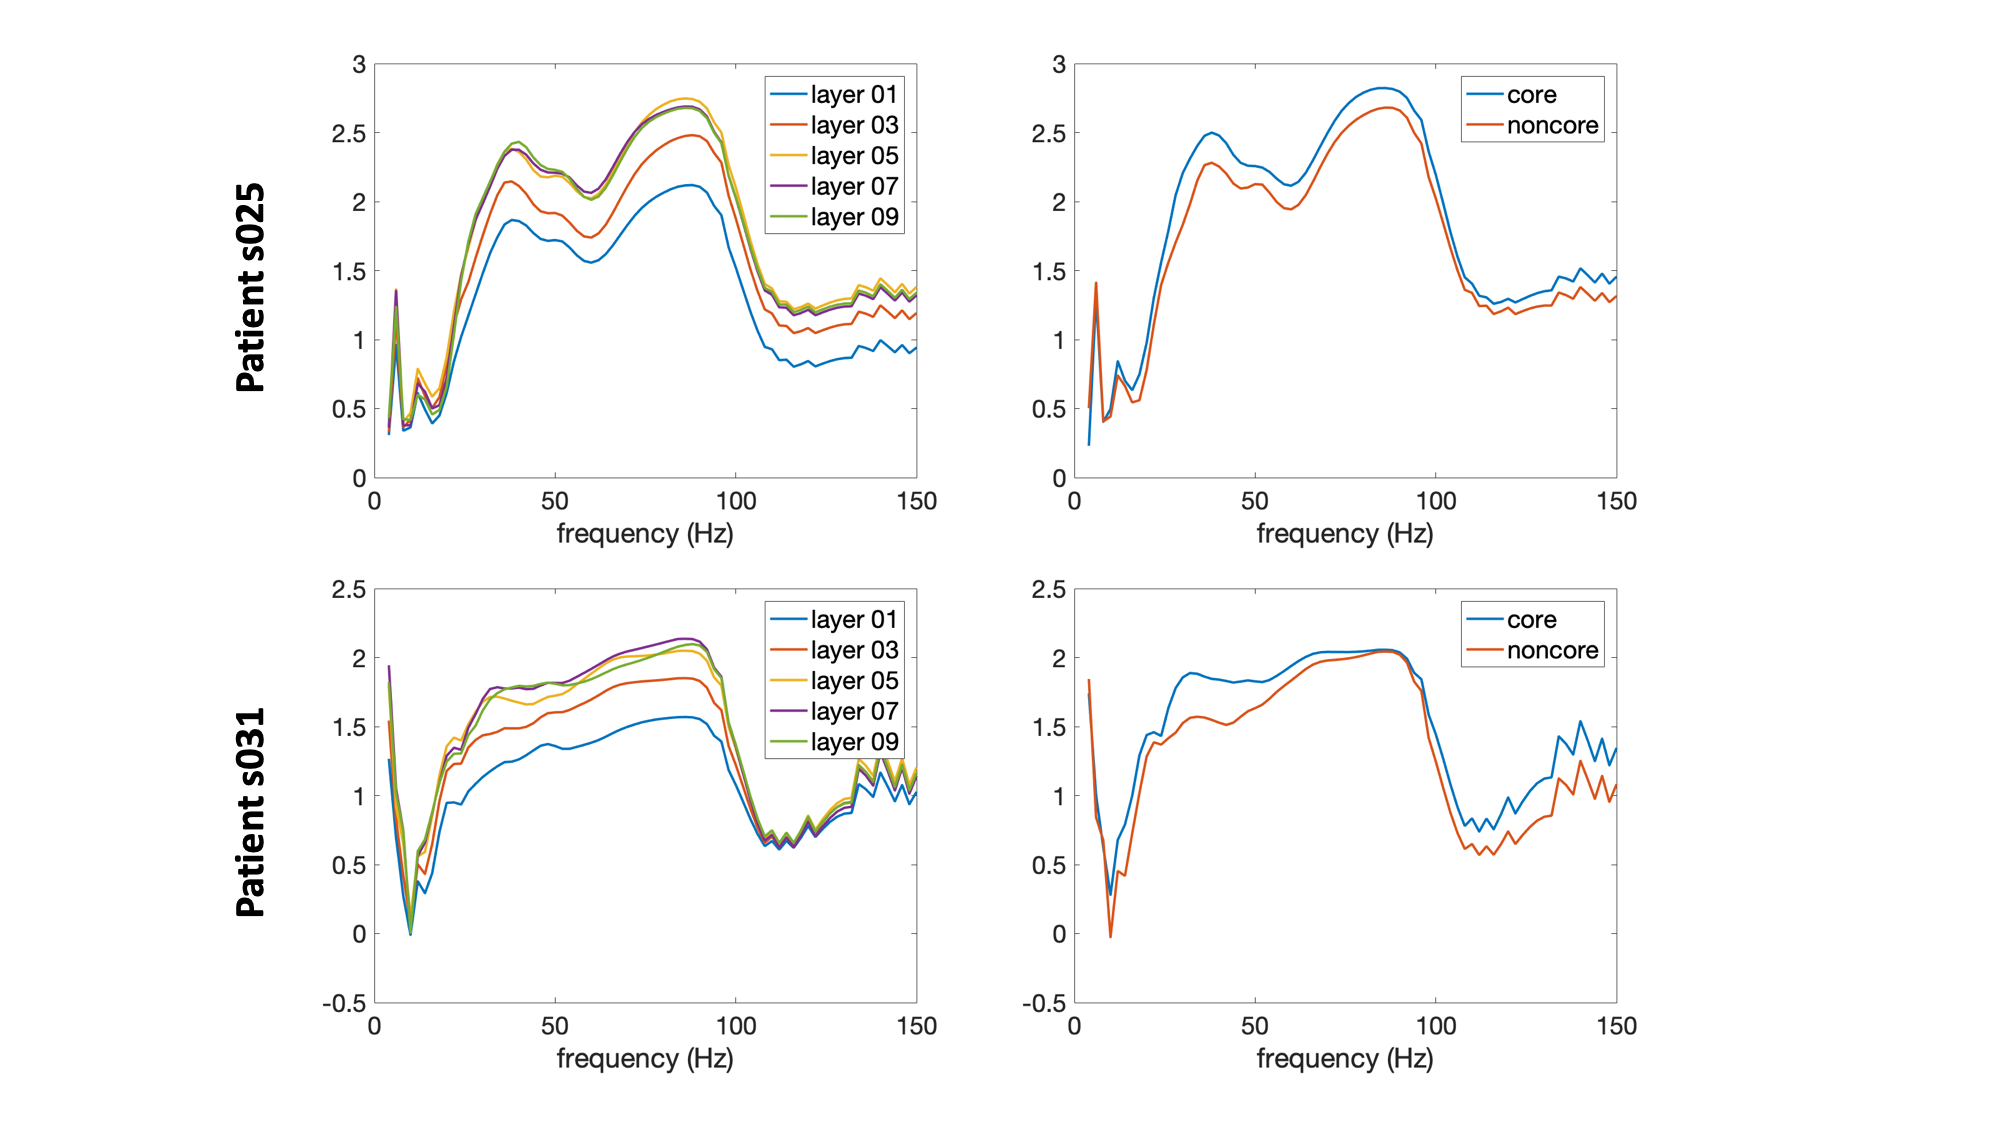
Figure 1 shows tonotopic maps as well as the boundary between core and noncore areas of the auditory cortex in the right hemisphere. The location of the electrode contacts from two patients were also indicated. BOLD signal was significantly correlated with the neuronal oscillation between 60 and 100 Hz (Figure 2). This correlation was stronger in the intermediate cortical depth than superficial or deep depth. The correlation between the BOLD signal and neuronal oscillation (40 Hz and 90 Hz) was stronger in intermediate and superficial depths (Figure 3). Furthermore, the correlation between neuronal oscillation in high gamma band was stronger in core than in nonecore region.DISCUSSION
We found the hemodynamic responses in human auditory cortex was significantly correlated with neuronal oscillation in high gamma band. This result corroborates with a previous study1. Two new findings here are: first, the intermediate cortical depth was more closely related to neuronal oscillation. Second, the neuronal-hemodynamic correlation was higher in core than in noncore region. Both finding can be attributed to structural connectivity findings that the feedforward pathway predominately targets the granualar layer, while the top-down feedback pathway targets the infragranular and supragranular layers2,3.Acknowledgements
This work was partially supported by Ministry of Science and Technology, Taiwan (103-2628-B-002-002-MY3, 105-2221-E-002- 104), the National Health Research Institutes, Taiwan (NHRI-EX107-10727EI), and the Academy of Finland (No. 298131).References
1 Mukamel R., Gelbard H., Arieli A. et al. Science.2005; 309:951-954.
2 Felleman D. J. & Van Essen D. C. Cereb Cortex.1991; 1:1-47.
3 Harris K. D. & Mrsic-Flogel T. D. Nature.2013; 503:51-58.
4 Ress D., Glover G. H., Liu J. et al. Neuroimage.2007; 34:74-84.
5 Koopmans P. J., Barth M. & Norris D. G. Hum Brain Mapp.2010; 31:1297-1304.
6 Olman C. A., Harel N., Feinberg D. A. et al. PLoS One.2012; 7:e32536.
7 Huber L., Goense J., Kennerley A. J. et al. Neuroimage.2015; 107:23-33.
8 Muckli L., De Martino F., Vizioli L. et al. Curr Biol.2015; 25:2690-2695.
9 Kok P., Bains L. J., van Mourik T. et al. Curr Biol.2016; 26:371-376.
10 Nasr S., Polimeni J. R. & Tootell R. B. J Neurosci.2016; 36:1841-1857.
11 Scheeringa R., Koopmans P. J., van Mourik T. et al. Proc Natl Acad Sci USA.2016; 113:6761-6766.
12 De Martino F., Moerel M., Ugurbil K. et al. Proc Natl Acad Sci USA.2015; 112:16036-16041.
13 Ahveninen J., Chang W. T., Huang S. et al. Neuroimage.2016; 143:116-127.
14 Moerel M., De Martino F., Kemper V. G. et al. Neuroimage.2017; pii: S1053-8119:30284-30287.
15 Polimeni J. R., Fischl B., Greve D. N. et al. Neuroimage.2010; 52:1334-1346.
16 Hoogenraad F. G., Hofman M. B., Pouwels P. J. et al. J Magn Reson Imaging.1999; 9:475-482.
17 Logothetis N., Merkle H., Augath M. et al. Neuron.2002; 35:227-242.
18 Triantafyllou C., Hoge R. D., Krueger G. et al. Neuroimage.2005; 26:243-250.
19 Wu P. Y., Chu Y. H., Lin J. L. et al. Sci Rep.2018; 8:13287.
20 Dale A. M., Fischl B. & Sereno M. I. Neuroimage.1999; 9:179-194.
21 Fischl B., Sereno M. I. & Dale A. M. Neuroimage.1999; 9:195-207.
Figures