3760
Cortical depth- and feature-dependent intrinsic functional connectivity in human visual and auditory cortices1National Taiwan University, Taipei, Taiwan, 2National Yang-Ming University, Taipei, Taiwan, 3Department of Radiology, Harvard Medical School - Athinoula A. Martinos Center for Biomedical Imaging, Charlestown, MA, United States, 4Department of Medical Biophysics, University of Toronto, Toronto, ON, Canada, 5Department of Neuroscience and Biomedical Engineering, Aalto University, Espoo, Finland
Synopsis
This study reveals the tonotopy- and retinotopy-dependent intrinsic functional connectivity (iFC) across cortical depths in the human auditory and visual cortieces, respectively. Using 7T fMRI data with 1-mm isotripic resolution, we demonstrated that feature-dependent iFC have a higher selectivity in the primary sensory than in the secondary sensory area. The selectivity was generally higher as we moved from superficial to deep cortical depths, while the difference between the primary sensory and secondary sensory area was more prominent in the intermediate cortical depth.
INTRODUCTION
Integrating sensory information may be facilitated by feature-dependent anatomical and functional connections, where neurons with similar functional properties are connected to each other across cortical locations1-5. As the cortex has different preferential connection to subserve feed-forward and feed-back pathways6,7, feature-dependent intrinsic functional connectivity (iFC) is likely to differ across cortical depths. Using fMRI data at 3T with 1.5 mm isotropic resolution, we recently delineated cortical depth-specific functional connectivity in the human auditory cortex8. This finding motivated us to futher examine the feature-depedent iFC in other brain areas and to examine how it varies across cortical depths.
In this study, we used 7T fMRI data with 1-mm isotropic resolution to study the iFC at both auditory and visual cortices. We hypothesize that the selectivity of iFC differs between primary and secondary cortices in the intermediate cortical depth, because bottom-up connections preferentially terminate at granualar layer6,7.
METHODS
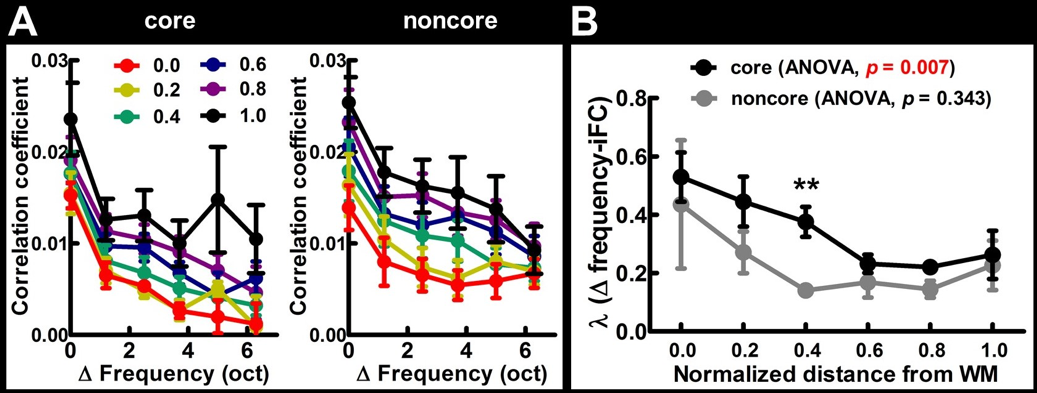
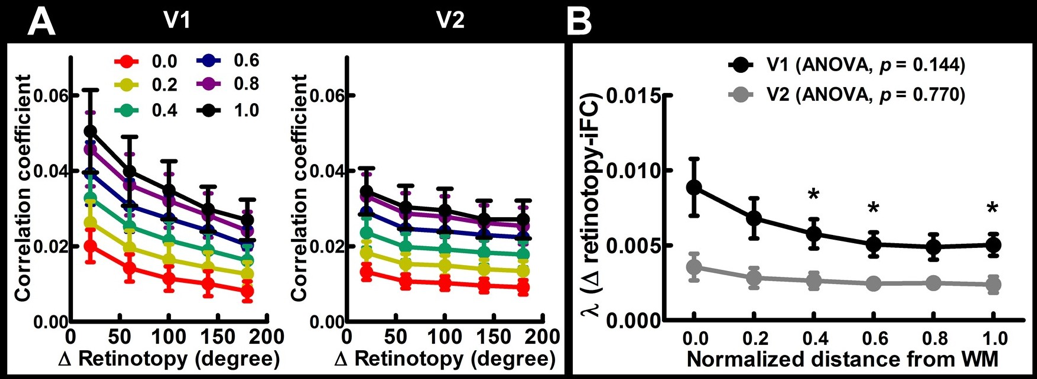
All data were obtained from a previous study9 performed on a 7T MRI (Siemens). Structural and functional images were acquired with a 1-mm isotropic resolution MPRAGE and a 1-mm isotropic resolution gradient-echo EPI sequences, respectively. The tonotopic map and the core as well as noncore regions of the auditory cortex were defined as reported in our previous published results8. The retinotopic map was obtained from a previous study10,11. The primary (V1) and secondary (V2) areas were defined by FreeSurfer12,13. iFC was computed as Pearson’s correlation of the residual fMRI signal at each cortical location. To obtain the iFC as a function of frequency preference difference, correlation was calculated between voxel pairs with the difference between their preferred frequencies matched to a specified Δ frequency. To obtain the iFC as a function of retinotopic map difference, correlation was calculated between voxel pairs with the root sum of squares of the difference between their eccentricity and polar angle matched to a specified Δ retinotopy. The iFC as a function of Δ retinotopy were then binned with bin edges of 0, 40, 80, 120, 160, and 200 degrees. We quantified the selectivity of iFC by the time constant (λ) of an exponential decay model fitted to Δ frequency- or Δ retinotopy-iFC data. λ's were calculated for each cortical depth separately.RESULTS
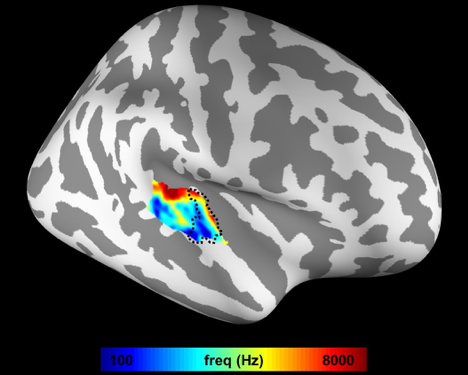
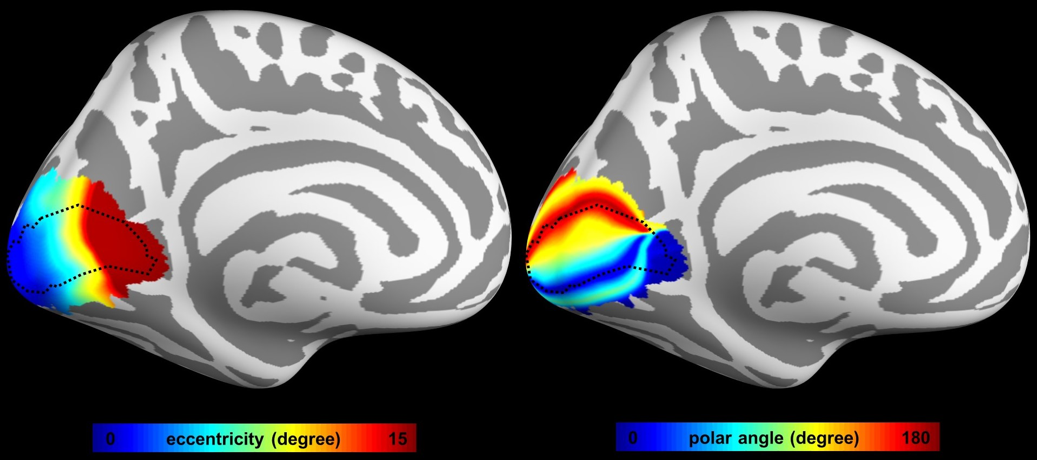
Figure 1 shows the mean frequency preference map across all participants. The core region of the auditory cortex was indicated by the dotted contour. Figure 2 shows the retinotopic maps including the eccentricity map and polar angle map. The V1 region was indicated by the dotted contour. Figure 3A shows the iFC as a function of difference in the frequency preference. The tonotopy-dependent iFC was found in both core and noncore regions at all depths of the auditory cortex. Figure 3B shows λ’ s fitted to Δ frequency-iFC data. Quantitatively, while the selectivity of tonotopy-dependent iFC was constant across depths in the noncore region, it varied significantly across depths in the core region. In particular, the maximum λ (highest selectivity) was found at deep depth. The selectivity of frequency dependent iFC was significantly higher in the core than noncore region at intermediate cortical depth. Figure 4A shows the iFC as a function of difference in the retinotopy. The retinotopy-dependent iFC was found in both V1 and V2 regions at all depths of the visual cortex. Figure 4B shows λ’ s fitted to Δ retinotopy-iFC data. While there was a similar trend that the deep cortical depth has a higher selectivity, the selectivity of retinotopy-dependent iFC was constant across depths in both V1 and V2 regions. The selectivity of retinotopy-dependent iFC was significantly higher in the V1 than V2 region at intermediate cortical depths and one of the superficial depth.DISCUSSION
Our results corroborated our previous finding by identifying the iFC selectivity difference between core and noncore regions in the intermediate cortical depth (0.3 and 0.4 normalized distance in our previous8 and current studies, respectively). These results suggested that 3T fMRI data with 1.5-mm isotropic resolution provide comparable results to 7T fMRI data with 1-mm isotropic resolution in disclosing iFC characteristics. More interestingly, the significant difference in iFC selectivity between primary and secondary visual cortices in the intermediate, but not superficial or deep depth, suggested an architecture of information integration in human brain. Specifically, the bottom-up modulation in both human visual and auditory cortices is underpinned by a structural connectivity6,7 and a functional architecture of stronger selectivity of feature-dependent iFC in primary than in secondary sensory cortices. Further experiments manipulating the relative contributions between feed-forward and feed-back modulation may justify this cortical-depth dependent functional architecture.Acknowledgements
This work was partially supported by Ministry of Science and Technology, Taiwan (103-2628-B-002-002-MY3, 105-2221-E-002- 104), the National Health Research Institutes, Taiwan (NHRI-EX107-10727EI), the Academy of Finland (No. 298131) ), and by the NIH grants R01DC016765, R01DC016915, and R21DC014134.References
1 Reale R. A., Brugge J. F. & Feng J. Z.Proc Natl Acad Sci USA.1983; 80:5449-5453.
2 Read H. L., Winer J. A. & Schreiner C. E.Proc Natl Acad Sci USA.2001; 98:8042-8047.
3 Rothschild G., Nelken I. & Mizrahi A.Nat Neurosci.2010; 13:353-360.
4 Fukushima M., Saunders R. C., Leopold D. A. et al.Neuron.2012; 74:899-910.
5 Cha K., Zatorre R. J. & Schönwiesner M.Cereb Cortex.2016; 26:211-224.
6 Felleman D. J. & Van Essen D. C.Cereb Cortex.1991; 1:1-47.
7 Harris K. D. & Mrsic-Flogel T. D.Nature.2013; 503:51-58.
8 Wu P. Y., Chu Y. H., Lin J. L. et al.Sci Rep.2018; 8:13287.
9 Ahveninen J., Chang W. T., Huang S. et al.Neuroimage.2016; 143:116-127.
10 Benson N. C., Butt O. H., Datta R. et al.Current biology : CB.2012; 22:2081-2085.
11 Benson N. C., Butt O. H., Brainard D. H. et al.PLoS computational biology.2014; 10:e1003538.
12 Dale A. M., Fischl B. & Sereno M. I.Neuroimage.1999; 9:179-194.
13 Fischl B., Sereno M. I. & Dale A. M.Neuroimage.1999; 9:195-207.
Figures