3758
The role of perivascular spaces in white matter blood oxygenation level dependent MRI1UBC MRI Research Centre, Vancouver, BC, Canada, 2Physics and Astronomy, University of British Columbia, Vancouver, BC, Canada, 3Pediatrics, University of British Columbia, Vancouver, BC, Canada, 4Physics and Astronomy, Heidelberg University, Heidelberg, Germany, 5Division of Neurology, Faculty of Medicine, University of British Columbia, Vancouver, BC, Canada
Synopsis
Using vascular parameters obtained from dynamic susceptibility contrast MRI, the gradient echo and spin echo blood oxygenation level dependent (BOLD) signals were simulated at 3 and 7T in order to investigate the effects of tissue orientation and perivascular spaces. We show that both the magnitude and the tissue orientation dependence of the BOLD effect is amplified by perivascular spaces.
Introduction
BOLD
fMRI detects neural activity via changes in blood oxygenation. Most
fMRI studies focus on the brain’s gray matter (GM), but there are
also reports on white matter (WM)1-3. Previously, the effects of
tissue orientation on the BOLD signal have been described for
cortical GM; in cortical folds parallel to the main magnetic field,
the gradient echo (GRE) BOLD signal was shown to be 40% higher
compared to folds perpendicular to the main magnetic field4. Recent
research using dynamic susceptibility contrast (DSC) MRI demonstrated
that the vasculature in WM is highly anisotropic5,6. Moreover,
perivascular spaces (PVS) surround larger blood vessels in the brain.
These PVS are two to three times the diameter of the containing
vessel, and are often enlarged in pathological conditions and
aging7,8. Recent work demonstrated that the free water in
perivascular spaces significantly affects DTI measures9, suggesting
that the fluid within the perivascular spaces cannot be neglected in
BOLD fMRI. Here, we perform numerical simulations of the GRE and the
spin echo (SE) BOLD signal at 3 and 7T in order to explore the
influence of PVS and tissue orientation.Methods
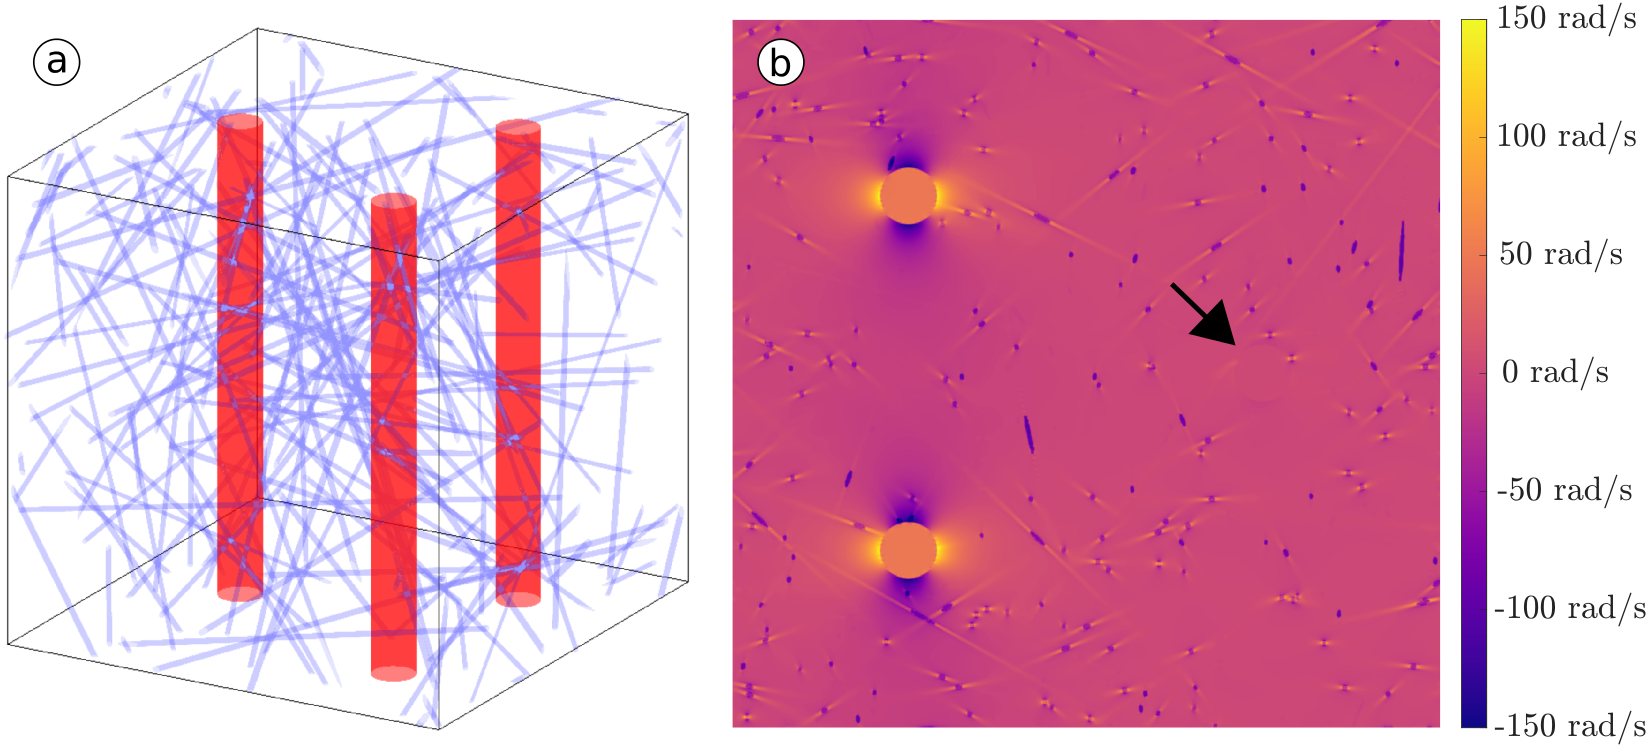
Simulation of the BOLD effect which accounts for diffusion effects requires solving the Bloch-Torrey equation, which describes the SE or GRE signal time evolution, within a simulated WM voxel filled with anisotropic and isotropic blood vessels. The construction of the voxel geometry, calculation of the local field inhomogeneities, and solving of the Bloch-Torrey equation is described in our previous work6.
The vascular architecture resulted from a parameter fitting process6 (Figure 1). This geometry is used as the input for a forward calculation of the BOLD signal at a range of echo times and tissue orientations for both GRE and SE at 3 and 7T. The simulations were performed without and with a perivascular space of twice the anisotropic vessel radius. The diffusivity within the perivascular space and the blood was set to that of water, $$$3037\mu{m}^2/ms$$$. The diffusivity within the surrounding tissue was set to $$$1000\mu{m}^2/ms$$$. Venous blood oxygenation was assumed as $$$Y=0.61$$$ at baseline and $$$Y=0.73$$$ at activation10, resulting in susceptibility differences of 0.39ppm and 0.27ppm at rest and activation, respectively. The magnetic field within the voxel was then calculated by convolution of the susceptibility distribution with a magnetic unit dipole (Figure 1). $$$T_2$$$ relaxation times at [3T,7T] were [33.3ms,14.1ms] for venous blood at baseline and [49.7ms,21.9ms] at activation, [1790ms,1010ms] for PVS fluid, and [69.0ms,45.9ms] for WM.
Results and Discussion
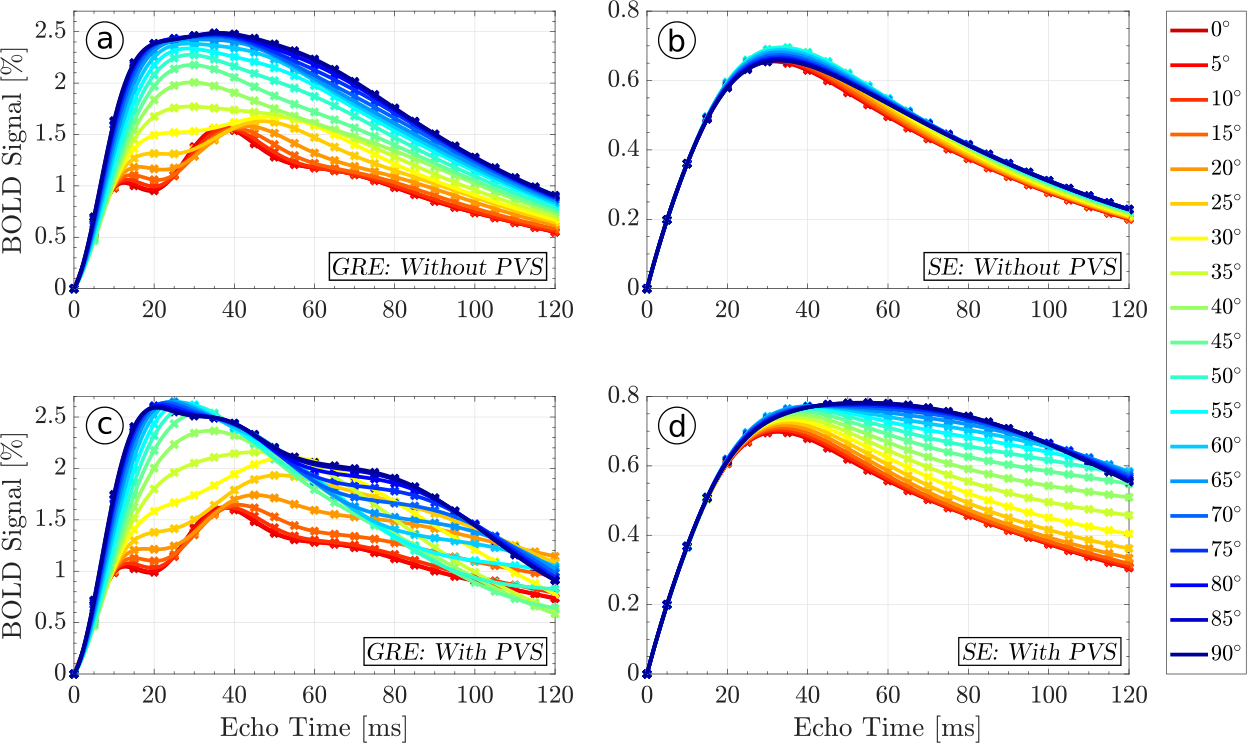
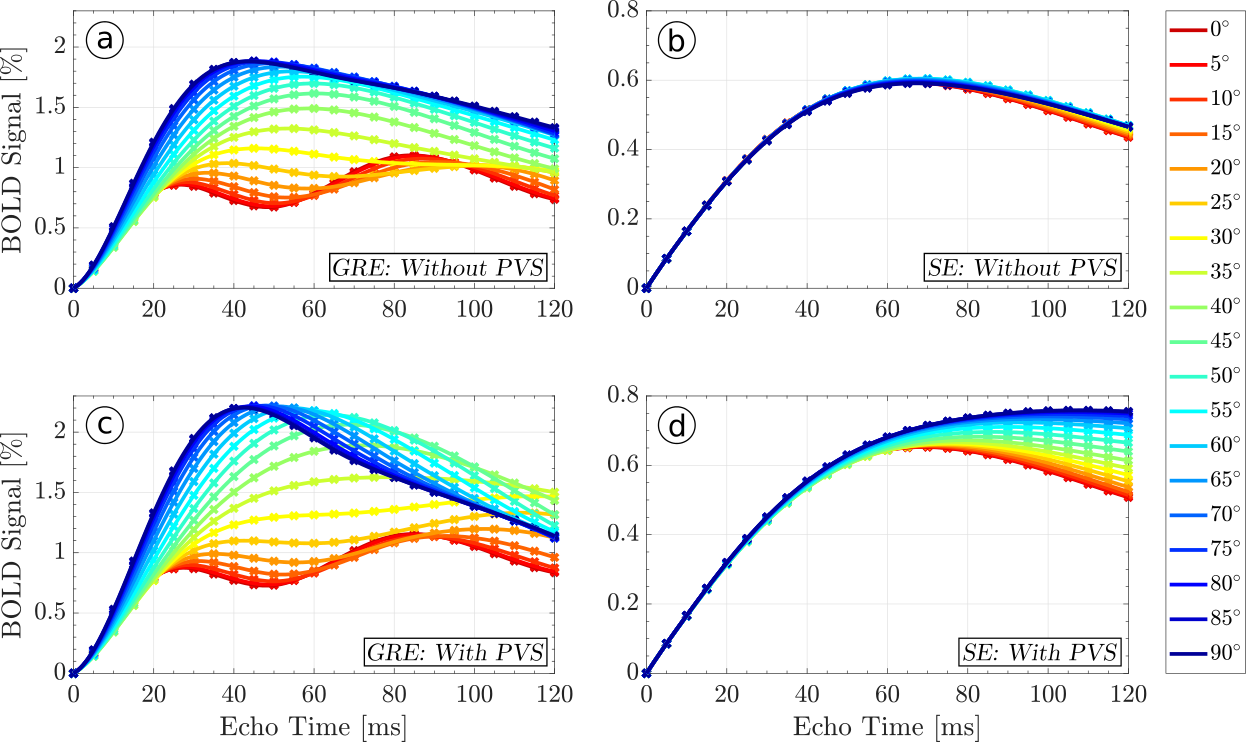
Both the SE BOLD signal's magnitude and orientation dependence, which are mediated by diffusion near blood vessels, are amplified by PVS. Figures 2 and 3 show the relative BOLD signal as a function of orientation and echo time with and without perivascular space at 7T and 3T, respectively. The GRE BOLD effect, which is dominated by static dephasing, shows considerable orientation dependence of up to 150% at both field strengths (Figures 2 and 3). For the SE signal at 7T with PVS, diffusion around the larger vessels has no relevant influence until echo times (i.e. diffusion times) of about 30ms. Until then, the BOLD signal is dominated by smaller vessels with no preferred orientation. At 3T, where the field gradients around the vessels are weaker, relevant orientation effects in the SE BOLD signal with PVS start to appear at 70ms. Without PVS at both 3 and 7T, orientation effects are small. The SE BOLD signal peaks later than the GRE BOLD signal, which is expected since it requires diffusion within the field inhomogeneities. Furthermore, the relative (i.e. not scaled for field strength) SE BOLD signal is almost the same at 3 and 7T, which is due to the reduced $$$T_2$$$-times of tissue at 7T, which attenuate the SE BOLD contrast. At 3T, orientation dependence in the SE signal emerges at echo times beyond 60ms, which are usually not employed in functional MRI. At 7T, on the other hand, an orientation dependence of 20% to 40% of the BOLD signal is present at echo times between 40ms and 60ms.
The high diffusion coefficient and the long $$$T_2$$$ of the fluid within the perivascular spaces act as amplifiers of the BOLD-effect’s magnitude and orientation dependence. Due to the dramatic orientation effects in the WM GRE BOLD signal, WM fMRI experiments may have to be performed using SE methods, with echo times around 35ms at 7T and 60ms at 3T. Additionally, orientation dependence in the cortical GM4 should vary between cortical layers due to systematic intra-cortical differences in vessel architecture.
Acknowledgements
No acknowledgement found.References
- Gawryluk, J.R., D’Arcy, R.C.N., Mazerolle, E.L., Brewer, K.D., Beyea, S.D., 2011. Functional mapping in the corpus callosum: a 4T fMRI study of white matter. NeuroImage 54, 10–15. https://doi.org/10.1016/j.neuroimage.2010.07.028
- Peer, M., Nitzan, M., Bick, A.S., Levin, N., Arzy, S., 2017. Evidence for Functional Networks within the Human Brain’s White Matter. J. Neurosci. 37, 6394–6407. https://doi.org/10.1523/JNEUROSCI.3872-16.2017
- Ding, Z., Newton, A.T., Xu, R., Anderson, A.W., Morgan, V.L., Gore, J.C., 2013. Spatio-temporal correlation tensors reveal functional structure in human brain. PloS One 8, e82107. https://doi.org/10.1371/journal.pone.0082107
- Gagnon, L., Sakadžić, S., Lesage, F., Musacchia, J.J., Lefebvre, J., Fang, Q., Yücel, M.A., Evans, K.C., Mandeville, E.T., Cohen-Adad, J., Polimeni, J.R., Yaseen, M.A., Lo, E.H., Greve, D.N., Buxton, R.B., Dale, A.M., Devor, A., Boas, D.A., 2015. Quantifying the microvascular origin of BOLD-fMRI from first principles with two-photon microscopy and an oxygen-sensitive nanoprobe. J. Neurosci. Off. J. Soc. Neurosci. 35, 3663–3675. https://doi.org/10.1523/JNEUROSCI.3555-14.2015
- Hernández-Torres, E., Kassner, N., Forkert, N.D., Wei, L., Wiggermann, V., Daemen, M., Machan, L., Traboulsee, A., Li, D., Rauscher, A., 2017. Anisotropic cerebral vascular architecture causes orientation dependency in cerebral blood flow and volume measured with dynamic susceptibility contrast magnetic resonance imaging. J. Cereb. Blood Flow Metab. Off. J. Int. Soc. Cereb. Blood Flow Metab. 37, 1108–1119. https://doi.org/10.1177/0271678X16653134
- Doucette, J., Wei, L., Hernández-Torres, E., Kames, C., Forkert, N.D., Aamand, R., Lund, T.E., Hansen, B., Rauscher, A., 2018. Rapid solution of the Bloch-Torrey equation in anisotropic tissue: Application to dynamic susceptibility contrast MRI of cerebral white matter. NeuroImage. https://doi.org/10.1016/j.neuroimage.2018.10.035
- Doubal, F.N., MacLullich, A.M.J., Ferguson, K.J., Dennis, M.S., Wardlaw, J.M., 2010. Enlarged Perivascular Spaces on MRI Are a Feature of Cerebral Small Vessel Disease. Stroke 41, 450–454. https://doi.org/10.1161/STROKEAHA.109.564914
- Mestre, H., Kostrikov, S., Mehta, R.I., Nedergaard, M., 2017. Perivascular spaces, glymphatic dysfunction, and small vessel disease. Clin. Sci. 131, 2257–2274. https://doi.org/10.1042/CS20160381
- Sepehrband, F., Cabeen, R.P., Choupan, J., Barisano, G., Law, M., Toga, A.W., Initiative, the A.D.N., 2018. A systematic bias in DTI findings. bioRxiv 395012. https://doi.org/10.1101/395012
- Zhao, J.M., Clingman, C.S., Närväinen, M.J., Kauppinen, R.A., van Zijl, P.C.M., 2007. Oxygenation and hematocrit dependence of transverse relaxation rates of blood at 3T. Magn. Reson. Med. 58, 592–597. https://doi.org/10.1002/mrm.21342
Figures