3757
Improved Selection of Hemodynamic Response Function in ASL Based Perfusion fMRI1Laureate Institute for Brain Research, Tulsa, OK, United States, 2Cornell MRI Facility, Cornell University, Ithaca, NY, United States, 3Stephenson School of Biomedical Engineering, University of Oklahoma, Norman, OK, United States
Synopsis
Two types of hemodynamic response function (HRF) are used in the data analysis of ASL based perfusion fMRI (ASL-fMRI): single gamma function (1-gamma) and the sum of two gamma functions (2-gamma). This study aims to optimize the selection of HRF by comparing the performances of standard 1-gamma and 2-gamma HRFs and also a modified 2-gamma HRF, which has earlier response peak time than the standard one. Our visual ASL-fMRI experiment indicate that the modified 2-gamma provides the best detection sensitivity and we recommend to use it in ASL-fMRI.
Introduction
Perfusion fMRI based on the arterial spin labeling (ASL-fMRI) [1-3] offers a noninvasive and quantitative measure of cerebral blood flow changes induced by neural activity. In the functional ASL data analysis based on the general linear model (GLM) [4-5], previous studies have used either a single gamma density function (1-gamma) [6] or the sum of two gamma functions (2-gamma) [7] as the canonical hemodynamic response function (HRF). Since the accuracy of statistical analysis depends on the HRF, it is necessary to select the accurate HRF to maximize the detection sensitivity of ASL-fMRI. This study aims to optimize the choice of HRF by comparing the performances of 1-gamma, 2-gamma and a new time shifted version of 2-gamma in detecting visual ASL-fMRI signals. The improved selection of HRF should result in better sensitivity and reliability of ASL-fMRI.Methods
ASL-fMRI images were acquired on four healthy human subjects using a 32-channel receive only head coil at a 3.0 T MRI scanner (Discovery MR750; GE Healthcare Systems, Milwaukee, WI). A visual stimulation with 4 Hz black and white flashing checkboard paradigm was delivered to the subjects. The block-design fMRI paradigm consisted of 4 blocks of task and rest epochs (40s each), and one extra rest epoch at the end (6 min scan duration). During the rest epochs a black background with a white fixation cross were presented on the screen. Twenty four axial ASL image slices were acquired using the pseudo continuous ASL pulse sequence [8] with the following parameters: matrix = 64 × 64, FOV/slice thickness = 240/5 mm, labeling duration/post-labeling delay = 2.2/1.5 s, TR/TE = 4000/12.4 ms, and flip angle = 90°. For anatomical reference, a 3D MPRAGE scan was performed to acquire T1-weighted images of 0.9-mm isotropic resolution.
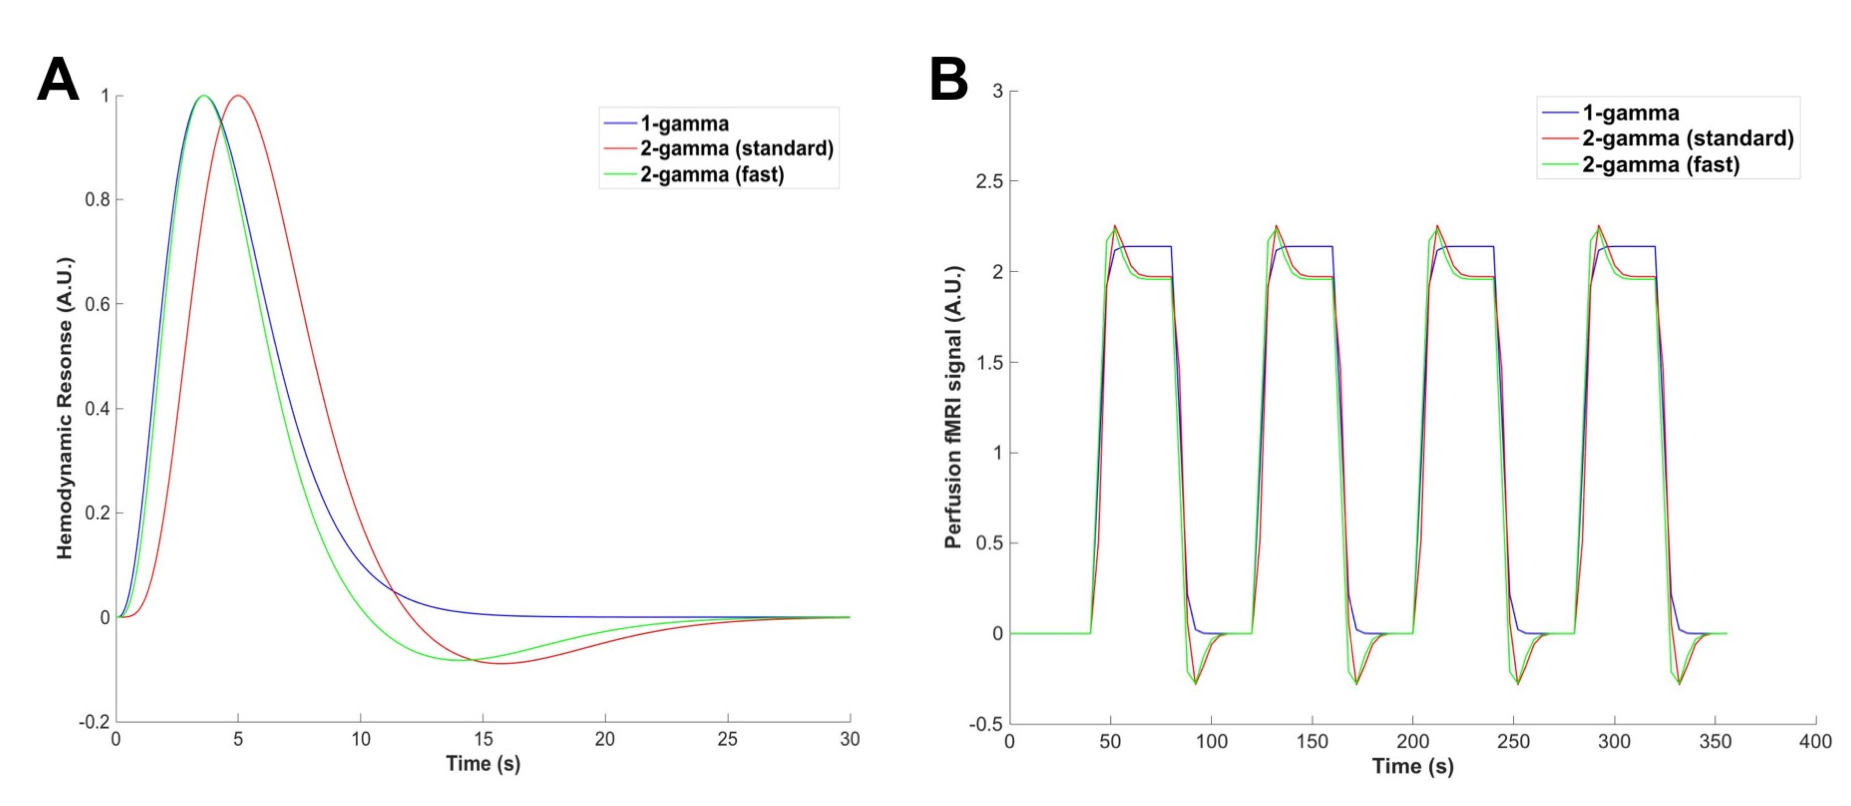
The ASL-fMRI images were motion corrected in AFNI and then analyzed using the GLM [5,9] with in-house MATLAB scripts. Different visual task regressors were created by convolving the paradigm with three HRFs (Fig. 1A). The first two were the standard 1-gamma and 2-gamma used in ASL-fMRI studies [6-7]. In addition, a fast version of 2-gamma was constructed by shifting the standard 2-gamma forward, such that its response peak time (~ 4 s) matched the measured value from the previous study [10]. The statistical t-maps were obtained by applying the GLM with the regressors (Fig. 1B) to the ASL-fMRI data. The mean t-values of voxels above the threshold of p<0.001 uncorrected (tmean) and the number of activated voxels (Nact) (i.e., activation volume) were calculated in the visual cortex. The subject-averaged Nact and tmean from the different HRF cases were compared to evaluate their performances.
Results
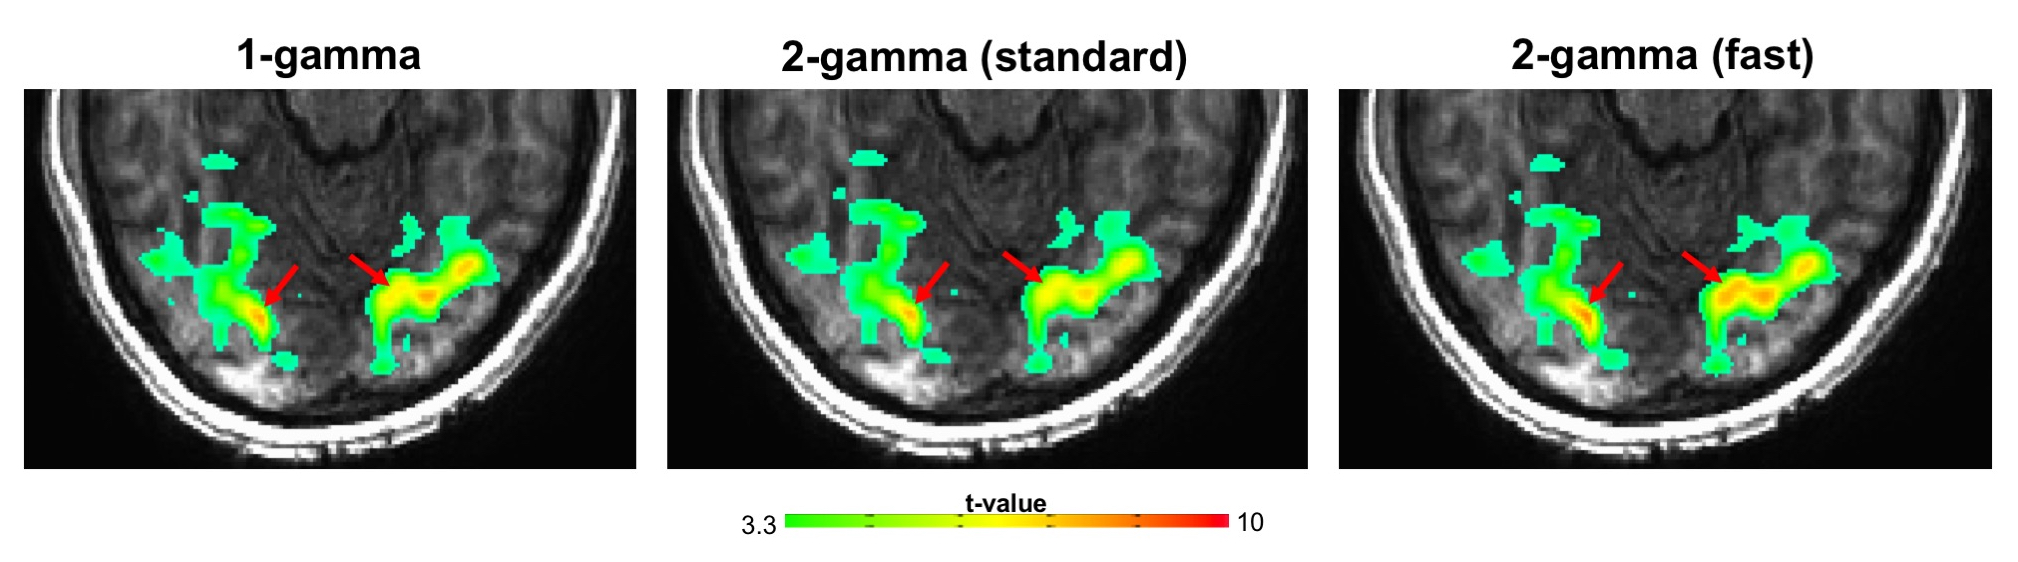
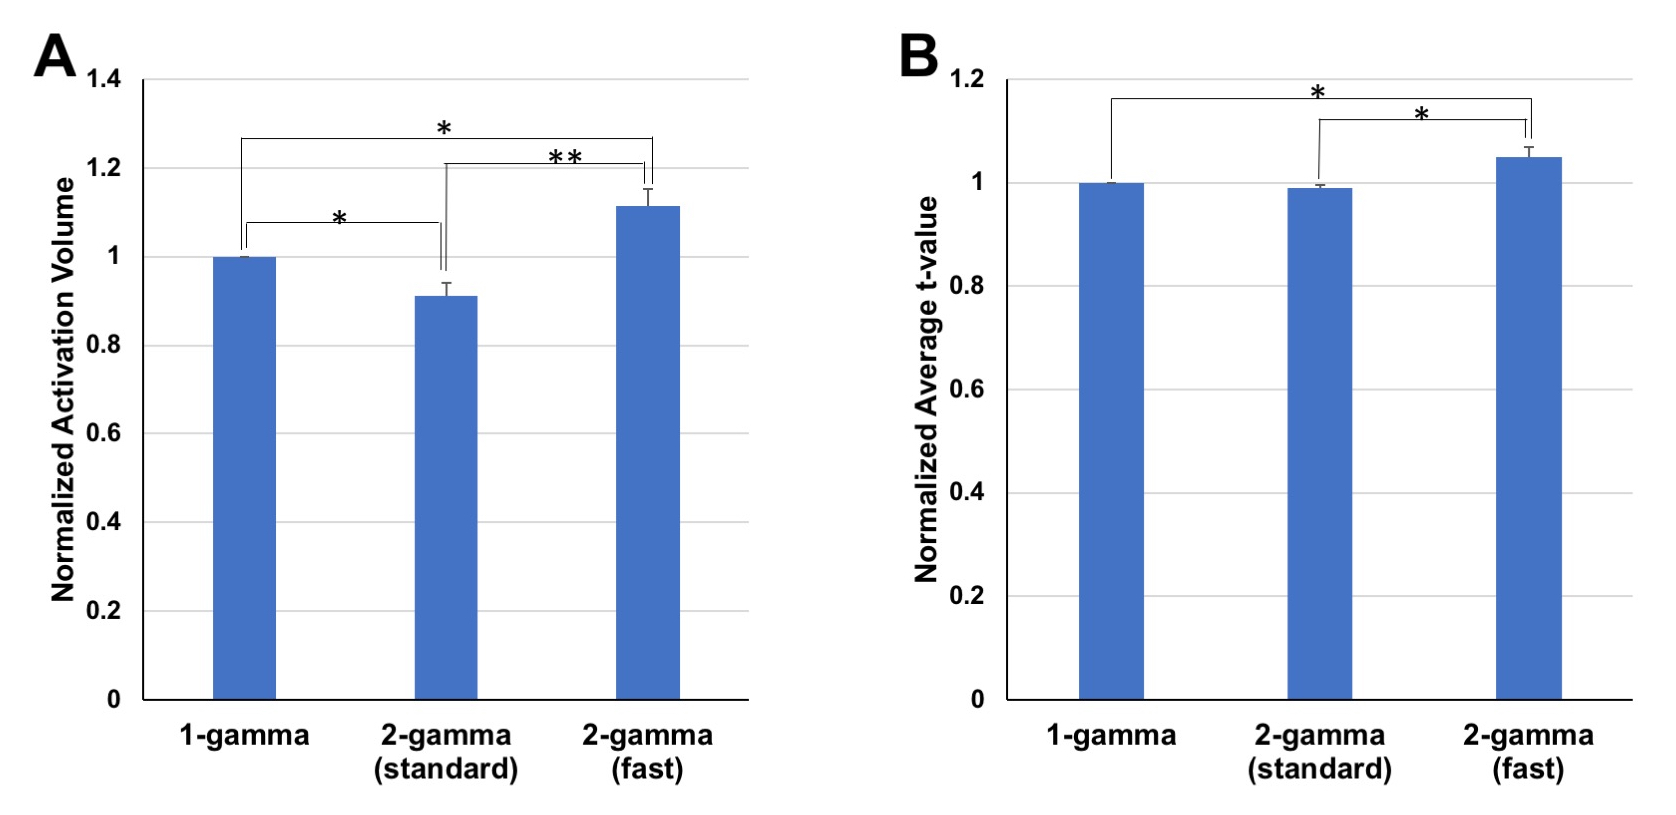
We found that the standard 1-gamma HRF produced higher t-values than the standard 2-gamma HRF in the activated foci of visual cortex (Fig. 2), and the activation volume of 1-gamma was also larger. However, compared to the standard 1-gamma and 2-gamma HRFs, the visual activation detected with the time shifted fast 2-gamma HRF showed larger t-values and more activated voxels (Fig. 2). The same tendency and results were consistently observed in all the four subjects. As shown in Fig. 3, the subject averaged Nact using the fast 2-gamma was improved by approximately 11.4% and 22.1% than the standard 1-gamma and 2-gamma, respectively. The corresponding tmean was elevated by about 4.9% and 5.9%. Thus, the GLM analysis based on the fast 2-gamma HRF provided significantly higher detection power than the other two HRFs.Conclusions and Discussion
Our study results illustrate that the time shifted fast version of 2-gamma HRF can achieve higher detection sensitivity than the standard HRFs usually used in perfusion fMRI studies. Thus, the fast 2-gamma provides a better and more accurate HRF to model the perfusion fMRI response, and improves the ability of ASL-fMRI in detecting neural activity.
The essential difference of the time shifted fast 2-gamma compared to the 1-gamma HRF is the undershoot component that occurs during 10-20 s after the stimulus (Fig. 1A). For a blocked task design, the undershoot results in higher perfusion response at the beginning of the task epoch and a signal dip after the task ends (Fig. 1B). In addition, it should be noted that the standard 2-gamma HRF used in ASL-fMRI is actually taken directly from BOLD fMRI experiments. The better performance of fast 2-gamma HRF implies that the undershoot is present in the perfusion fMRI response and also suggests and indicates that indeed the perfusion fMRI signal peaks earlier than the corresponding BOLD effect [10].
Acknowledgements
This work has been supported by Laureate Institute for Brain Research, and the William K. Warren Foundation.References
1. Kim, S.G., 1995. Quantification of relative cerebral blood flow change by flow-sensitive alternating inversion recovery (FAIR) technique: application to functional mapping. Magn Reson Med 34: 293-301.
2. Wong, E.C., Buxton, R.B., Frank, L.R., 1997. Implementation of quantitative perfusion imaging techniques for functional brain mapping using pulsed arterial spin labeling. NMR Biomed 10:237-249.
3. Ye, F.Q., et al., 1997. Quantitation of regional cerebral blood flow increases during motor activation: a steady-state arterial spin tagging study. Neuroimage 6:104-112.
4. Friston, K. J., Jezzard, P. J., Turner, R., 1994. Analysis of functional MRI time-series. Hum Brain Mapp 1: 153–171.
5. Liu, T.T., et al., 2002. Analysis and design of perfusion-based event-related fMRI experiments. Neuroimage 16:269-282.
6. Liu, T.T., Wong, E.C., 2005. A signal processing model for arterial spin labeling functional MRI. Neuroimage 24:207-215.
7. Raoult, H., et al., 2011. Arterial spin labeling for motor activation mapping at 3T with a 32-channel coil: reproducibility and spatial accuracy in comparison with BOLD fMRI. Neuroimage 58:157-167.
8. Dai, W., et al., 2008. Continuous flow-driven inversion for arterial spin labeling using pulsed radio frequency and gradient fields. Magn Reson Med 60:1488-1497.
9. Mumford, J.A., 2006. Estimation efficiency and statistical power in arterial spin labeling fMRI. Neuroimage 33:103-114.
10. Liu, H.L., et al., 2000. Comparison of the temporal response in perfusion and BOLD-based event-related functional MRI. Magn Reson Med 43:768-772.
Figures